Disrupting the Borg is expensive and time consuming!
Google Search
-
Recent Posts
- Gaslighting 1924
- “Why Do You Resist?”
- Climate Attribution Model
- Fact Checking NASA
- Fact Checking Grok
- Fact Checking The New York Times
- New Visitech Features
- Ice-Free Arctic By 2014
- Debt-Free US Treasury Forecast
- Analyzing Big City Crime (Part 2)
- Analyzing Big City Crime
- UK Migration Caused By Global Warming
- Climate Attribution In Greece
- “Brown: ’50 days to save world'”
- The Catastrophic Influence of Bovine Methane Emissions on Extraterrestrial Climate Patterns
- Posting On X
- Seventeen Years Of Fun
- The Importance Of Good Tools
- Temperature Shifts At Blue Hill, MA
- CO2²
- Time Of Observation Bias
- Climate Scamming For Profit
- Climate Scamming For Profit
- Back To The Future
- “records going back to 1961”
Recent Comments
- Bob G on Gaslighting 1924
- John Francis on “Why Do You Resist?”
- conrad ziefle on Gaslighting 1924
- Bob G on Gaslighting 1924
- Bob G on Gaslighting 1924
- Bob G on Gaslighting 1924
- conrad ziefle on Gaslighting 1924
- Bob G on Gaslighting 1924
- Bob G on Gaslighting 1924
- arn on Gaslighting 1924
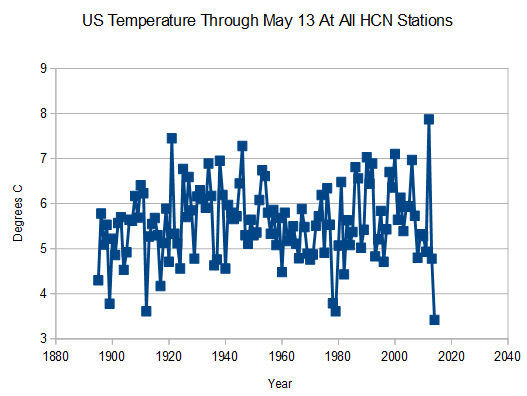
Coldest Year On Record In The US Through May 13
This entry was posted in Uncategorized. Bookmark the permalink.


Unusually cold here in Missouri today.
The AGW tale has developed into a comedy that may now evolve into a tragedy for humanity because:
1. The combined political forces of world leaders and puppet scientists are on one side, but
2. Precise experimental data to falsify Standard Models of the atomic nuclei, stars, Earth’s climate and cosmology are on the other side.
Ancient scriptures of various religions and teachings agree on the outcome:
“Truth is victorious, never untruth!”
Well, seems we had our summer the past couple of weeks, now back down into the 60’s (average this time of year is 80F) .. argh .. just when the golf was starting to ramp up.
Coldest thru May 13 after last year, same period, was warmest–priceless!
And, it kinda makes it hard to claim that this is “cherry picked”, since it’s apples to apples.
Now it becomes more and more obvious that the US is not warming, the CO2 warmists are trying to convince the public that Antarctica is melting (which it is not). Piers Corbyn wrote this comment:
http://www.weatheraction.com/docs/WANews14No18.pdf
Screaming headlines in a carefully synchronised Goebbels-esque fanfare. The NASA-BBC-Al Jazeera-NYT.. aim is brainwashing the public into stupidity and then treat them as stupid.
As a drowning person strugges most mightily just before sinking, . . .
So the frightened alliance of world leaders and puppet scientists that secretly formed in 1945 to save the world from nuclear annihilation . . .
(Including leaders of the world’s most powerful nations and their puppet national academies of “science”)
are now signaling their surrender to reality.
Looking at raw USHCN data, the first four months of 2014 is actually the 19th coldest on record (there aren’t enough reports for May to say much yet). Here is what USHCN raw Jan-April data actually looks like: http://i81.photobucket.com/albums/j237/hausfath/Jan-AprilUSHCNRaw_zps5f9bf038.png
We’ve been over this before, but you can’t average raw temperatures from a group of stations unless the set of available stations stays the same over time. Lets look at a very simple example to show why this is the case.
Suppose we only had four stations in the U.S. Two had average Jan-April temperatures of 10 degrees, one had an average temperature of 5 degrees, and the fourth had an average temperature of 20 degrees.
The actual U.S. temperature estimated from these stations (assuming that they were spatially representative, which is another can of worms with absolute temperatures, but we will ignore that for now) would be 11 degrees. However, if the 20 degree station hasn’t reported yet for the latest year, that estimate drops to 6 degrees. If both the 20 and 5 degree stations haven’t reported, the average is 10 degrees. In both cases changing composition of the station network results in a significant bias.
Since only roughly half of stations have reported so far for April 2014, if the stations reporting tend to be colder than the stations not reporting for one reason or another (say, co-op observers in the South tend to report a bit later), than you’d get a spurious cooling bias in your analysis.
Using anomalies (e.g. difference from the mean) nicely avoids this problem, as the absolute temperatures of stations dictated by climatological factors like their elevation or latitude are removed through subtracting the mean for each month.
I thought WMO standards were pretty clear. Why doesn’t your linked graph use them? Your “baseline” period is not to standard. FAIL. Fix it, and try again.
This is ridiculous. I can’t believe it’s 41 deg now in the NW Chicago suburbs.
You must be joking. Can’t be series [sic]. Looking at thermometer incorrectly; parallax error. Look at it straight-on, not from above or below …
The world is warming, indeed, that is the party line and it is to be adhered to …
Sort of a warm up we only have to shelter the new trees in the garage so they hopefully escape the freezing temps at night. To us in the UP of Michigan it looks like summer may just be a memory sort of like snow was be a few years ago, by the way we got 3″ of snow last Monday a week ago.
Perhaps we should be sending letters demanding our share of global warming.