
There are 50 states, 12 months per year, and four opportunities for each state to set a hottest/coldest/wettest/driest record each month. The temperature record is about 100 years long. That means that approximately 24 state min/max/wet/dry records should be set every year.
50 * 4 * 12 / 100 = 24
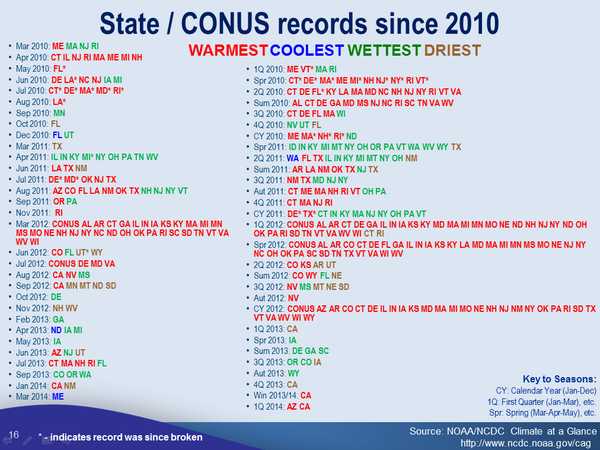
Climate genius Deke Arndt tweeted this alarmist hype, which shows that 2013 had less than half as many records as would be expected in a normal year.
These geniuses are trying to scare people with meaningless statistics which they don’t understand.

You wrote: “There are 50 states, 12 months per year, and four opportunities for each state to set a hottest/coldest/wettest/driest record each year.”
Did you mean instead: “There are 50 states, 12 months per year, and four opportunities for each state to set a hottest/coldest/wettest/driest record each month.”?
I see it was corrected! Thanks.
And if the “climate bozos” can’t baffle the people with simple math.
They change the measurement method and announce that “tornadoes are getting stronger!!!” http://www.wired.com/2014/04/tornado-strength/
Stupidity is galloping in the halls of climatology!!!
Tornadoes smell worse than they did in the 1880s.
Am I seeing this correct, he is only showing the weather data from 2010 onward?
What an idiot.
But the young sheeple will lap it up.
In my capacity as a three-time Mosher Award for Good Physics laureate, I flipped a coin twice & it came up heads both times! There’s less than a 0.0001% chance that such an event could be caused by natural variation.
First, there is the fact that 100 years ago only 48 states were actual states in the USA. Arizona and New Mexico achieved statehood in 1912. Alaska and Hawaii joined in 1959.
Second, there is the issue of instrumentation–was that measuring equipment up to 21st Century accuracy standards? Where was it located? And has the terrain around the measuring stations changed any–like were the measuring stations in wilderness forests back then, but now are located at a busy airport in the center of an urban sprawl?
Third, high school statistics are not what they used to be. Let’s see: 48 states, 100 years, 12 months–that’s 576 chances to have record highs (or record lows) per year out of 57600 high readings (highest temperature per state in a month over 100 years).
Finally, all this sophomoric sophistry ignores the duration of climate cycles–centuries or more.
Sounds like denial to me!
Stupidest comment of the day, so far.
Thanks. I had to try really hard to meet the level of our government on this issue.
What happened to the other 7 states?
Was wondeting that myself. Steven?
Its better than that. Temps are measured in 1/10ths of a degree. That means for any given day with a possible range of 20C (15-35 in July), means 200 possible slots. But we’ve been measuring for only 100 years. It’s a simple calculation to find out that it would take 3000 years to fill every slot for the entire year for one location. Reaching a record temp has nothing to do with hotter trends, and everything to do with accounting.
Not that simple . While it would take some time or research to work out the distribution of new extremes for , eg a stationary Gaussian , over time , clearly it declines .
Consider that in the first year the probability of new records is 100% on every measure .
Aye that, and we have new stations quiet often.
… and of course this only reinforces the significance of the fact that most US highs set in the 30s and 40s, have yet to be exceeded.
You Lie!!…. Denialist…. Lol… 😉