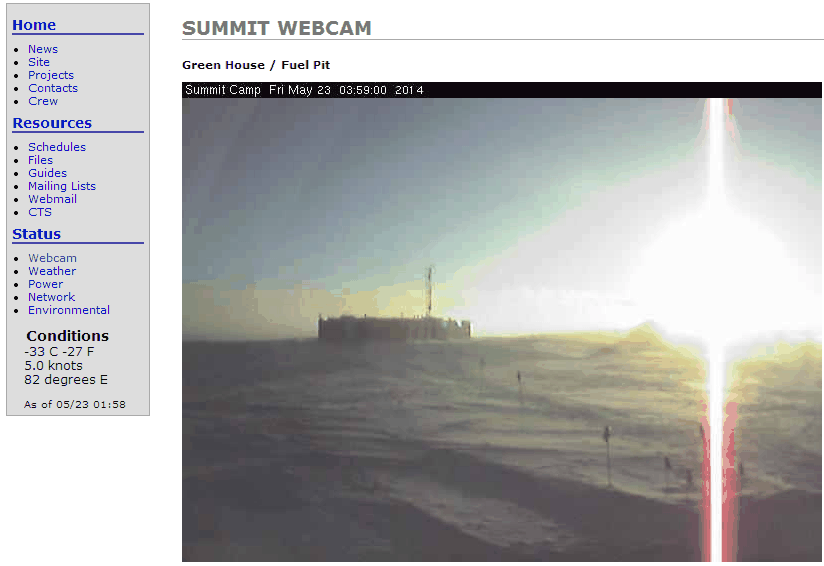
Climate experts are nearly unanimous in their belief that Greenland is melting down at -33C
Disrupting the Borg is expensive and time consuming!
Google Search
-
Recent Posts
- Analyzing The Western Water Crisis
- Gaslighting 1924
- “Why Do You Resist?”
- Climate Attribution Model
- Fact Checking NASA
- Fact Checking Grok
- Fact Checking The New York Times
- New Visitech Features
- Ice-Free Arctic By 2014
- Debt-Free US Treasury Forecast
- Analyzing Big City Crime (Part 2)
- Analyzing Big City Crime
- UK Migration Caused By Global Warming
- Climate Attribution In Greece
- “Brown: ’50 days to save world'”
- The Catastrophic Influence of Bovine Methane Emissions on Extraterrestrial Climate Patterns
- Posting On X
- Seventeen Years Of Fun
- The Importance Of Good Tools
- Temperature Shifts At Blue Hill, MA
- CO2²
- Time Of Observation Bias
- Climate Scamming For Profit
- Climate Scamming For Profit
- Back To The Future
Recent Comments
- Bob G on Analyzing The Western Water Crisis
- Bob G on Analyzing The Western Water Crisis
- Bob G on Analyzing The Western Water Crisis
- arn on Analyzing The Western Water Crisis
- Scott Allen on Analyzing The Western Water Crisis
- conrad ziefle on Analyzing The Western Water Crisis
- conrad ziefle on Analyzing The Western Water Crisis
- Bob G on Analyzing The Western Water Crisis
- Bob G on Analyzing The Western Water Crisis
- Bob G on Gaslighting 1924


This site looks interesting:
http://www.dmi.dk/en/groenland/maalinger/greenland-ice-sheet-surface-mass-budget/
I’m still digesting what it all means, however I’m guessing that alarmists see only the red line in the lowest graph.
We note that sublimation has been included with melting (very conveniently); the sublimation is most influenced by RH and direct normal insolation, indicative of fewer clouds, and that is about it.
Wow!!!
Another sunbathing day in Greenland.
But I thought the Arctic looked like this!
“@ThislsDeep: Global warming http://twitter.com/ThislsDeep/status/469357064989728768/photo/1”
Link wrong
“@ThislsDeep: Global warming http://twitter.com/ThislsDeep/status/469357064989728768/photo/1
Common Core math. – 33 x -27 = positief a lot like Venus
and don’t forget the 82 degrees !
Uh, does the cold have something to do with the altitude?
“Welcome to Summit Station, located at the peak of the Greenland ice cap at 72°35’46.4″N 38°25’19.1″W, 10,530 ft (mean sea level) elevation…..
http://www.summitcamp.org/
Not in our brave new world where only catastrophic warming exists. Although I do admire your courage for using the ‘c’ word.
SSSHHHhhhhh
If you mention altitude (atmospheric pressure) and the word temperature, then you are opening the door to the fact that the high temperature on Venus is due to the Adiabatic Lapse Rate and all of that PV =nRT stuff.
Somebody needs to build a pair of identical greenhouses. Fill one with air and the other with pure CO2 at atmospheric pressure. Make it 100% pure, not even any water vapor.
See which one gets hotter.
Why is it ppl continually bring up this ‘greenhouse’ analogy? It is not particularly applicable … better to think of the classic Yagi-Uda (Hidetsugu Yagi and Shintaro Uda) array and contemplate adding or removing the reflector element …
.
We bring up greenhouses (real) because we like to yank the chain on the junkyard dogs of CAGW.
The ENTIRE CAGW hoax is built on the ASSumption that CO2 is well mixed in the atmospher. It is not. Therefore the excuse used to toss out all the high readings from historic wet chemistry data and from pre-1985 Ice Core data (using ALL the sample including the ice not just the air bubbles that formed on decompression) is invalidated.
Short synopsis: http://doctorbulldog.wordpress.com/2008/12/10/exposing-the-global-warming-myth-co2-levels/
See the pdfs listed here: http://www.warwickhughes.com/icecore/
Gail Combs says May 23, 2014 at 9:36 pm
I take it your post is intentionally not responsive re: Yagi-Uda arrays and proposed analogy using same …
Most of the surface of the Greenland ice sheet is at high altitude, because it is two miles thick.
And with all that new snow from this winter, reflective aka high albedo.