
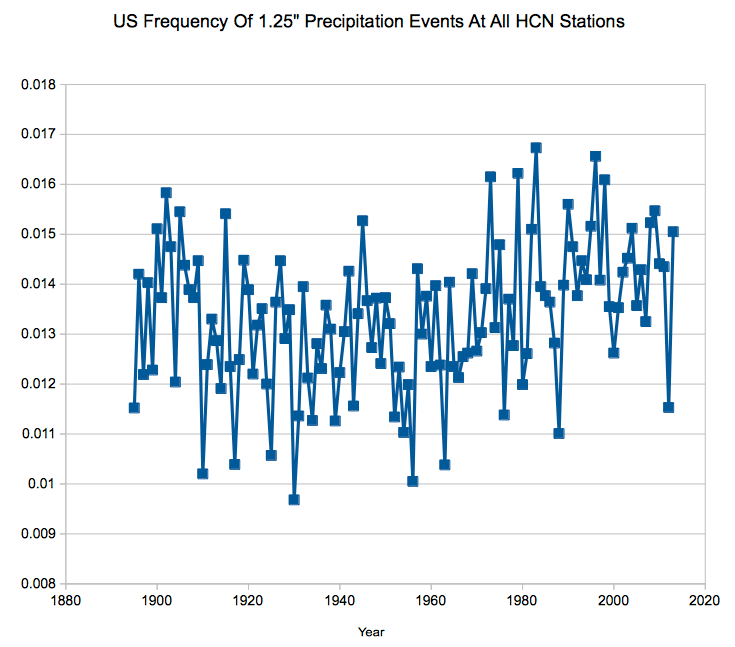
Contrary the the nonsense being spewed by the White House, there is no long term trend in heavy precipitation events in the US. It looks like a sine wave which peaked during the high ENSO years of the 1980’s and 1990’s.
Contrary the the nonsense being spewed by the White House, there is no long term trend in heavy precipitation events in the US. It looks like a sine wave which peaked during the high ENSO years of the 1980’s and 1990’s.

Looks like a slight upward trend over the whole period, however the last 40 years look pretty flat, and a decline in the last decade.
All this is pretty moot anyway considering that a graph on its own doesn’t prove what caused it; whether it is going up, down, or sideways. Same goes for any other “extreme” conditions (if any increase actually exists): no-one has any proof of what is causing them.
If you draw a linear trend across a sine wave, with the negative phase on the left side, it will erroneously appear to be increasing.
Bingo. I have made a solver that will take your chart and give me the sine amplitude, wavelength, phase, trend, acceleration. You mind giving me the GHCN command to make that chart, I’ll post up the results here. Thanks.
I don’t see it in the existing code. Can you post the .csv?
How would going from .013 to .014 be meaning full. (not saying that is what it does.)
It just occurs to me that the entire chart is essentially flat.
That can’t be. The University of Hawaii (Choom Central) says we are doomed!
El Nino is coming and will destroy us all in the Big One! And the movie Noah is only a prelude to what will happen in the USA.
“Elsewhere in the world, such as in America, they will see a large amounts of rain and storms that could lead to widespread flooding as the warm water carries rain from Asia and Australia and displaces it over southern and eastern America.”
http://www.news.com.au/technology/environment/el-nio-has-been-forecast-to-return-in-2014-and-it-could-be-a-big-one/story-fnjwvztl-1226910244082
PS – since you NH guys are taking our rain, we will send you an invoice, payable to my Cayman Islands a/c.
It actually looks like the rainfall events spiked during the cold period of the 1960’s and 1970’s. Probably stands to reason, more cold air coming down and clashing with warm air causes more rain events.
How dare you disrupt their pretty oversimplified charts with more facts!
Alert: Washington Post has a story today about Popular Science killing ALL readers comments due to readers arguing against the millions of global warming articles that lie about facts!
This is one of many publications that are now eliminating comments due to the fight over facts so they can publish lies! Isn’t that pathetic?
And I grew up reading Popular Science! Haven’t read it in years, of course. Say, I am a techie, after all!
Same goes for Nature and Scientific American both of which censored my father, Dr. Aden Meinel when he tried to get warnings about a cooling sun published 12 years ago.
The apparent sinusoidal wave in the graph is likely due to the summation of wave energies generated by low frequency sound waves emitted by whales.
Rain patterns never varied before we had bans on killing whales. As the whale population grows, expect much more “extreme” weather. Also, more whales cause sea levels to rise, see “Archimedes Principle”.
(I’m going to omit any mention of sarc….)
You mean the ‘suicidal wave’, don’t you? 🙂
& as whale populations increase, expect to see more of them bodily flung from the overcrowded oceans, & exploding on our formerly pristine beaches.
Further funding is needed to pursue this line of research.
Obviously.
And the approved messages from the WH – well what did you expect from the choom-smoker-in-chief’s administration, science?
More smoke and less mirror would have been nice …
🙂
The reasons for an increase in flooding in the US- Urban development.
http://pubs.usgs.gov/fs/fs07603/
“Over the past century, the United States has become an increasingly urban society. The changes in land use associated with urban development affect flooding in many ways. Removing vegetation and soil, grading the land surface, and constructing drainage networks increase runoff to streams from rainfall and snowmelt. As a result, the peak discharge, volume, and frequency of floods increase in nearby streams. Changes to stream channels during urban development can limit their capacity to convey floodwaters. Roads and buildings constructed in flood-prone areas are exposed to increased flood hazards, including inundation and erosion, as new development continues. Information about streamflow and how it is affected by land use can help communities reduce their current and future vulnerability to floods.
The effect of urban development in the last half of the 20th century on small floods is evident in Salt Creek, Illinois. With the exception of an unusually large flood in 1987, large floods have increased by about 100 percent (from about 1,000 cubic feet per second to about 2,000 ft3/s) while small floods have increased by about 200 percent (from about 400 ft3/s to 1,200 ft3/s). Nonetheless, even a small increase in the peak discharge of a large flood can increase flood damages.
The frequency of moderate flooding can increase substantially after development. The annual frequency that daily discharge exceeded 1,000 ft3/s on the Northeast Branch of the Anacostia River in Maryland increased from once or twice per year in the 1940s and 1950s to as much as six times per year in the 1990s”