
Anthony Watts posted his take on the USHCN adjustments. Here is my take on his take. Anthony’s graph shows my method in red.
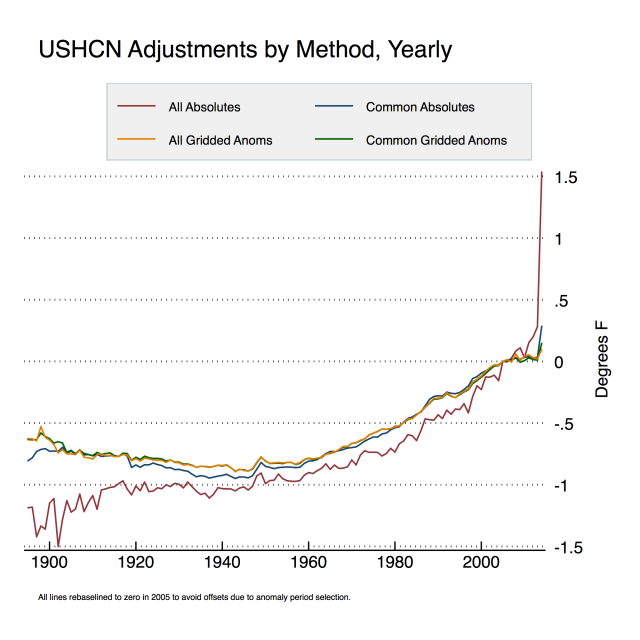
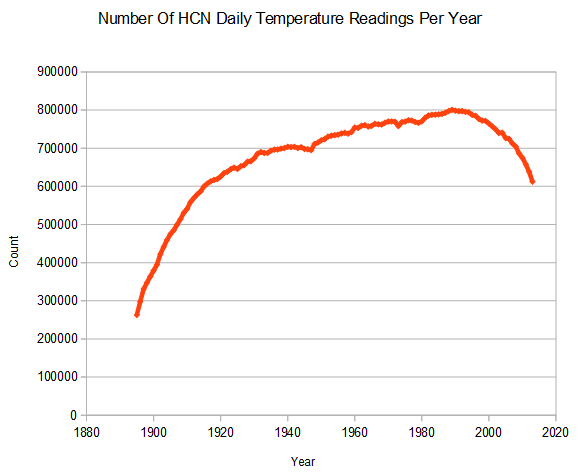
The spike in 2014 is due to USHCN fabricating temperatures in their adjusted version. The adjusted version includes a lot of May temperatures from stations which USHCN doesn’t have any data for. May is a warmer month than January-April, so the USHCN final average gets elevated relative to the raw average, because the final version includes more (imaginary) May station data. If USHCN didn’t fabricate temperature data, this spike wouldn’t exist.
My method takes the average of all monthly readings at all stations in a given year, and subtracts the average of the raw data from the average of the final data. I assume a Monte Carlo distribution of missing data, which is probably a safe assumption for a large data set. This shows the total amount of adjustment for all of the USHCN temperature gymnastics. Zeke wants me to take the average of all of the individual station deltas. My approach is probably more meaningful because it also shows the effects of station loss.
Note in Anthony’s plot, that my approach and his approaches are roughly parallel from 1930 to 1995. After 1995, my approach shows a sharp increase in slope while his tails off. Not coincidentally, since 1995 the number of stations has dropped dramatically. It is possible that stations which showed less warming (or more cooling) disappeared selectively after 1995. Whatever it is, this an important piece of information and should not be hidden by the methodology. I don’t know exactly why the methodologies diverge after 1995, but the fact that the break is coincident with a drop off in stations strongly hints at a possible correlation.
Gridding would provide a better average for the whole country than what I am doing, but that isn’t my intent. I’m just showing the average adjustment across all stations.
Zeke says “everybody uses anomalies” but that isn’t correct. NCDC publishes absolute temperatures for their US temperature data, and most of my comparisons are HCN raw vs. NCDC published.
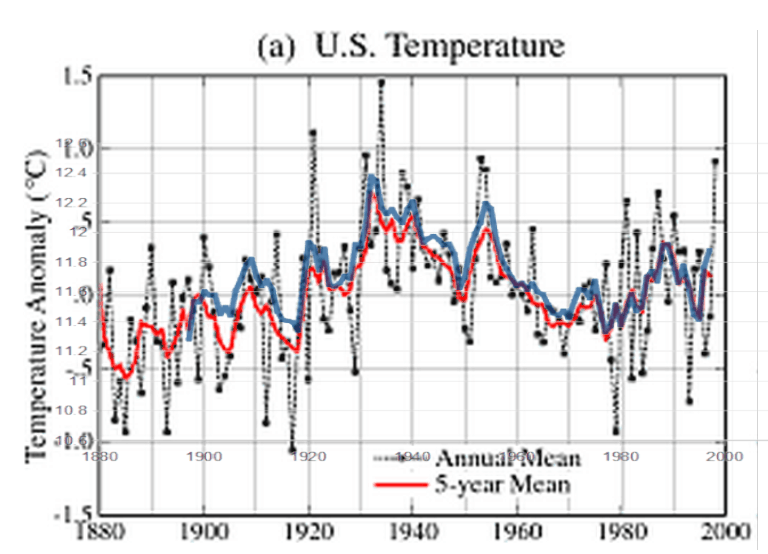
As I showed yesterday, my approach to raw data (blue below) is pretty close to Hansen 1999, except for the USHCN V1 adjustments – which were much smaller than the V2 adjustments.
No matter how you look at it, USHCN and NCDC are cooling the past – when they should actually be cooling the present due to UHI.

Thermometer technology must have really sucked back then.
You should see the technology they are fielding today; what do you suppose the half-life of a thermometer built back then is compared to the half-life of technology we are ‘fielding’ today to do basically the the same thing?
It was actually pretty good. I would expect they were all calibrated. I have a decades old Kodak thermometer that reads fine against a digital one. Modern digital ones claim ridiculous precision numbers. The real question is how accurate are they. I bet the best ones can only read accurate to a tenth of a degree over time. Forget what the readout says.
Perhaps you and Anthony did not get the memo. Climate Scientists are not supposed to even question another’s work. How do you think Mann got his Hockey Stick such immediate acceptance by the “2500 Worlds Finest Climate Scientists”, even though if flew in the face of thousands of studies which showed differently.
If you keep this up, we might see some real science being performed in the Climate Science arena. That would not be acceptable.
You should issue a correction. It’s a road well traveled by NOAA, NCDC, NASA,etc who have issued corrections over the years to the point where nobody believes anything they publish. Raw data is missing, but they go ahead and publish a monthly climate report to justify their existence. (Monthly climate report, a nice oxymoron).
They shouldn’t be expected to get the numbers right. They’re government employees after all.
You want me to issue a correction for USHCN fabricating temperatures?
sarcasm.
Consider the following question: what are the chances that you’ll ever see a USHCN adjustment with a spike of the same magnitude, but downward?
Right, that wasn’t difficult, was it? And the answer to that hypothetical question tells you all you ever need to know about these adjustments. Adjustments are undeniably necessary due to station re-siting, change of instruments, TOBS, etc, but the bottom line is that some adjustments are more equal than others.
Great point.
This wasn’t an adjustment at all. Since Steve used absolute temperatures instead of anomalies that are re-centered vertically around a zero line, the simple greater number of stations in the final average due to temporarily missing stations in the raw set results in a higher average of absolute values.
The good news is that now Steve’s software *has* been independently validated and can no longer be seen as a black box issue, something that mere public release of it was not enough for non-programmers to have confidence in. It also shows that skeptics outside of academia are using the self-correcting scientific method, admirably, in all its messy confusion.
-=NikFromNYC=-, Ph.D. in chemistry (Columbia/Harvard)
Creating adjusted data from no raw data is the ultimate adjustment.
It’s called a Mann Briffa adjustment
They are not creating adjusted data in this case, merely in-filling, temporarily. There is no bias here, and no resulting up-adjustment in their computed results *in* *this* *case*. Your claim of a nefarious motive in this case was regrettable, and hopefully now forgettable.
In other words, you’ve properly had your ass handed to you after calling me crazy for suggesting a late reporting artifact.
I love it when Nik exudes charm and class.
Nik,
“In other words, you’ve properly had your ass handed to you after calling me crazy for suggesting a late reporting artifact.”
Well, that is what leftards often think when they have absolutely no clue about what is happening.
Nik,
These are actual locations on the planet, where people live and breath and raise children. They take stations with no no data and give them data. That is called “bullshit”, not “in-filling”
Instead of In-filling think made-up or best guess in the absence of real data.
I just voted for the first time in my life in 2012, for Romney, here in the midst of the Beast, the Upper West Side of Manhattan, and my ballet was grabbed out of my hand en route to the input slot of the machine reader by an oh-so-aggressively-friendly poll monitor, who then turned it upright to validate my newfound Republicanism, before turning it downright again to “help“ me stick it into the slot. A gray-haired gal who I once hit on in Columbia’s library to the louder protest of a testy male student also scurried out of the pole “watcher” pool…earlier.
If I sound aggressive at times it’s because I often feel aggressively normal, taking to heart both the intense anti-lazy, anti-tribal-human-nature teachings of Einstein and Feynman combined with the best philosopher of all time, who exists in a late supplement to the Jewish Torah.
Often at night I splurge beyond my current means, on steak and wine:
http://s6.postimg.org/6e8v8bldd/image.jpg
This at times offers me perspective on jewelry design, and also climate skepticism, my maverick hobby, but definitely not always.
Stop being so tribal or you are just partisan hacks.
You have it 90% figured out, but zeal that leads to mistakes is unworthy of state of the art SCIENCE.
I have taken to task Watts (for propagandizing his Thermometer Stations Project ad infinitum minus the twenty minute task of plots of rural/urban difference) and Dr. Curry (for being, early on, a passive-aggressive *cunt* who Willis Eschenbach was alone in early criticizing), and I out and out early on suggested a ban on Lord Monckton, back when he was making rookie mistakes.
Tribalism isn’t usefully effective if be it too raw, too desperately bigoted.
Give Goddard as much as you can afford, but he is not our Lord.
He is a scientist, proper.
A bad-ass proper maverick, in the face of bizarre COLLECTIVISM.
Such doth the Sphere of the Real World Turn.
STOP thinking that Goddard is hurt by normal science kicking in.
He needs to merely slowwwwww downnnnnnn, to speed up.
Furthermore, in respect of the adjustments, “undeniably necessary” – is only so if they insist (as they do) on using the big dumb data dump of all sites, past, present, changed, unchanged, rural, urban, etc. What would be better would be to simply use the stations that have been continuously active in the same place, rural only. It would have the added advantage of saving taxpayers’ money not having to fund the adjustment jockeys. It’s supposed to be the global temperature that matters, right? But what are we gaining from the US having hundreds and hundreds of the bloody things, with adjustments exceeding the unadjusted range, but having only (literally) a handful of sites in a similar size land mass in East Africa?
Cause I don’t want to appear ignorant, I looked up TOBS on the internet. Now I just need to figure out which definition everyone is discussing:
(Noun). The name of a person that is self-obsessed, unnecessarily aggressive, ignorant and obscenely arrogant.
tig ol’ bitties (a.k.a Big ol’ titties)
a tweaker on a bike
Time Of Birth
Latest weather in TOB Airport, Tobruk, Tobruk, Libya
You’re close. It means Tweak OBServations. Or Trash OBServations.
Are you sure it’s not Tobruk, Libya? I think its Tobruk, Libya….
In the modern assessment of climate ‘TOBS’ usually means ‘Tons Of BS’ or ‘Talk Of BS’…etc. It refers to a method of adjusting the raw data to fit the prevailing theory.
I think we have a winner ……
😆
can someone explain to me how you derive an anomaly….
…when you don’t know what the temperature was?
And this crock excuse of adjusting past temps…
…well, if you’re working with anomalies, you don’t need to know the exact temp
so, you don’t go back and adjust them
The past temps, even if they read too high for the high temp, and too low for the low temp……
they did it consistently, just like their consistent adjustments
so they would show trends without being adjusted
They are saying they are working with anomalies and don’t need to know the exact temps….
…but need to go back and adjust past temps because they need to know exactly what the temp was……………..
For some banal reason quite a number of commenters on WUWT site want to say your method and/or result are errornious. IMHO this is to miss the point, your method is consistent with what you wish to show – namely that the adjustment are being made over a timescale.
Your graphs and released method have shown that –
1. Your methodology is sound.
2. You starkly (should I say alarmingly) show in you graph the amount of adjustment that has happened and continues.
Therefore it has merit and performs as intended.
Whether others wish to see this result is different matter.
Different methods expose different information. Skeptics who believe the science is settled around their understanding, are no better than the people on the other side.
Very true.
Viewing the same object (or data) from a different angle tend to show different attributes of the object. This of course is only true if enough of the object can be seen at a high enough resolution.
As soon as the word “adjustment” is stated, you are bringing subjectivity and biases into the equation. Especially given such a major interest in the outcome.
Maybe we should allow Red Sox fans to “adjust” the umpires’ decisions after the game is over. I am sure they would be totally fair and happy to have their results peer reviewed by other Red Sox fans. Especially the ones betting on the game!
Entirely correct!
How confident would our astronauts have been during their Moon landing if they were told that the maps were made up of some actual images with large areas of averaged infilled images? But they would have been told that areas of unknown infilled data was done with high confidence by the ground-base ‘scientists’.
That’s kind of what happened. The landing site originally proposed was a lot rougher than expected for Apollo 11. Aldrin had to manually fly beyond it to find a reasonably smooth place. The photos didn’t have enough resolution to show the boulders.
They should have let the ‘climate scientists’ of the day tweek the photo. Generate some averaged data, homogenize over the difficult bits, and viola! A nice smooth surface, no problem. If then the astronauts found it was rougher they were wrong!
Just posted this over at WUWT …
Truthseeker says:
Your comment is awaiting moderation.
May 10, 2014 at 5:14 pm
I have never seriously studied statistics, so I have no argue from authority to offer you, but I have realised that this post is just wrong on a number of counts.
Steve Goddard is looking at two data sets. One is the observed or raw data and one is the published or adjusted data. Both data sets are snapshots as far as Steve’s analysis goes as new values will be added as time passes. Therefore Steve’s approach is valid as it is comparing one data set to another at the one point in time. It is not doing a grid or station by station analysis.
The fact that stations are missing from either data set is part of the adjustments that have been done. If some stations are “late” for the raw data set, but are being given a value by the reported data set, then that is part of the adjustment. If these data points become available at a later point in time, then doing the analysis again with a different snapshot is valid, but it does not make the analysis that was done at that point in time any less valid.
Using anomalies or other data torture methods is a different analysis. Doing anything else to the data is just adding an unnecessary layer of manipulation that is not required and not really valid when you are looking at the data set to data set approach that Steve has done.
Another failed gatekeeping exercise by WUWT.
This does re-open a deeper problem that actually there is no scientifically “correct” way to average temperatures. The concept of temperature imposes a belief that energy distributes itself amongst the available degrees of freedom such that the average energy (i.e. average over a long time) is the same for all available degrees of freedom. However the instantaneous energy distribution is not the same for all degrees of freedom, you get something like a Maxwell–Boltzmann distribution (someone is going to correct me on the detail, but anyhow you get a particular distribution, with a particular shape).
Once you have things like day temperature, and night temperature, or winter/summer temperatures or polar temperatures and equatorial temperatures, it no longer satisfies the basic concept of a single temperature any more. There is no definition for what a global average temperature really should be.
http://www.uoguelph.ca/~rmckitri/research/globaltemp/GlobTemp.JNET.pdf
There’s an article that discusses the problem of coming up with average temperatures. I think they don’t handle it 100% correctly, because they presume a point temperature exists (no such thing does exist, all temperatures are statistical properties) but if you let them get away with that approximation and presume for example that a mercury bulb is close enough to a “point” in space on a global scale, then there is a very valid issue at work here.
Also, it’s fair to point out that temperature is defined in terms of thermodynamic equilibrium, but the surface of the Earth is never in thermodynamic equilibrium, which is why we get maximum and minimum temperatures every day. Thus we are facing additional measurement problems.
You left out the huge mammoth in the room, water. If you are using temperature to measure “energy” then you have to include the heat of vaporization or sublimation….
Sleepalot @ July 21, 2012 at 4:53 am @ WUWT pointed out the actual effects of water vapor on the temperature by comparing high vs low humidity. The humid Brazilian rain forest, Barcelos, Brazil, and the dry N. African Desert, Adrar, Algeria.
wattsupwiththat(DOT)com/2012/07/21/some-thoughts-on-radiative-transfer-and-ghgs/#comment-1038793
I took the thought a few steps further.
The effect of the addition of water vapor (~ 4%) is not to raise the temperature but to even the temperature out. The monthly high is 10C lower and the monthly low is ~ 10C higher when the GHG H2O is added to the atmosphere in this example. The average temperature is about 4C lower in Brazil despite the fact that Algeria is further north above the tropic of Cancer. Some of the difference is from the effect of clouds/albedo but the dramatic effect on the temperature extremes is also from the humidity.
I took a rough look at the data from Brazil. Twelve days were sunny. I had to toss the data for two days because it was bogus. The average humidity was 80% for those ten days. The high was 32 with a range of 1.7C and the low was 22.7C with a range of 2.8C. Given the small range in values over the month the data is probably a pretty good estimate for the effects of humidity only. You still get the day-night variation of ~ 10C with a high humidity vs a day-night variation of 35C without and the average temp is STILL going to be lower when the humidity is high and the effect of clouds is removed.
DATA from: classic(DOT)wunderground.com/history/station/82113/2012/5/22/MonthlyHistory.html
This data would indicate GHGs have two effects. One is to even out the temperature and the second is to act as a “coolant” at least if the GHG is H2O.
The latent heat of evaporation could be why the average is 4C lower when in Brazil vs Algeria. As one of the commenters at WUWT mentioned using temperature without humidity to estimate the global heat content is bad physics. Also Barcelos is much near the ocean than Adrar so there may be a ‘Lake effect’ with the large body of water moderating the temperature.
apollo(DOT)lsc.vsc.edu/classes/met130/notes/chapter2/lat_heat2.html
ALTITUDE:
Barcelos, Brazil elevation ~ 30 meters (100 ft)
Adrar, Algeria ~ Elevation: 280 metres (920 feet)
One would expect a drop in temperature of ~ 4C due to altitude for Adrar, Algeria so the difference between locations, taking into account altitude is ~ 8C higher in Adrar which is further north but with much lower humidity. – (wwwDOT)engineeringtoolbox.com/air-altitude-temperature-d_461.html
….
RACookPE1978 @ February 18, 2014 at 8:11 pm @ WUWT –
http://wattsupwiththat.com/2014/02/17/crises-in-climatology/#comment-1571641
was kind enough to
So lets add Solar energy into the picture.
Barcelos – 0.9750° S, “Direct Radiation Horizontal Surface” @ noon for 0S= 1150 watts/meter^2
Adrar – 27.8667° N, “Direct Radiation Horizontal Surface” @ noon for 30S= 970 watts/meter^2
Adrar, Algeria for September 2012:
monthly min 24C, monthly max 40C, monthly average 33C
Average humidity 22% (Humidity increased through the month)
classic(dot)wunderground.com/history/airport/DAUA/2012/9/29/MonthlyHistory.html
Barcelos, Brazil for September 2012:
monthly min 22C, monthly max 33C, monthly average 26C
Average humidity 81%
classicDot)wunderground.com/history/station/82113/2012/9/29/MonthlyHistory.html
There were 11 sunny days in
Barcelos…………… Adrar
min 22 °C………… min 24°C
max 34 °C……………max 40 °C
Avg 29 °C…………… Avg 33 °C
humidity 76%……….. 22 %
So Barcelos, with 180 watts/meter^2 extra solar energy is still ‘cooler’ than Adar by the same 4 °C.
SInce humidity in many parts of the world can vary widely from day to day and the amount also varies year to year, the entire ‘Average Earth Temperature’ exercise is a completely bogus Dog ‘n Pony show for the sheeple.
I do not doubt that water has a significant effect on Earth’s climate… possibly the second most significant effect, after the Sun. Nor would I argue that the latent heat should be ignored when looking at a macroscopic energy balance.
However, that’s not quite what I was getting at in terms of temperature. The actual definition of temperature in a thermodynamic sense does not lend itself to any sensible average temperature between a measurement on the North Pole and a measurement on the Equator. Think about what happens when you measure temperature with a mercury bulb thermometer. Inside the mercury are a billion or more atoms bouncing around an knocking into one another, each has its own unique velocity as energy rapidly sloshes around in that bulb. We essentially summarise a billion velocity measurements into one single temperature measurement… but how is that possible?
It only works because we presume that those mercury atoms settle down into a statistical distribution that remains stable on average. Each atom is not stable, but enough atoms together in a bunch take up a known volume. Then we ignore the individual velocity of each atom, and call it “thermodynamic equilibrium” and take a temperature reading. It just happens that within a small patch, if we give it time to settle, the energy spreads out in a consistent way and that behaviour is repeatable.
So now think about one mercury bulb in Antarctica, and another in the Sahara. What does it mean to take an average of those two readings? You cannot turn two values into one value without losing information unless you have some additional a-priori knowledge about where those original measurements came from. There is no thermodynamic theory to support the operation, it is one possible operation arbitrarily chosen from a large family of mathematical averaging operations… none of which are based in any real physics.
That’s why SG and AW can take the same input data and produce a different output curve.
Relating the water and the latent heat to the overall macroscopic energy distribution is yet another level of complexity on top of that, but we don’t even have a rational basis for a dry calculation anyhow. In a nutshell, we have no particular reason to believe that the Earth has a property which might meaningfully relate to temperature and which would also be measurable in a repeatable manner even should our climate never change at all.
If you want to dig into it, the ASSumption that the earth is in “thermodynamic equilibrium” is a really dumb ASSumption to begin with. The fact that the earth has ‘weather’ tells you up front the earth is not in “thermodynamic equilibrium” and can never reach “thermodynamic equilibrium” because of the uneven distribution of energy from the sun that drives the weather.
It is the same with the ASSumption that CO2 is evenly distributed in the atmosphere. It can not be evenly distributed because of the large number of sinks and sources that are constantly changing.
The entire hoax is based on those two ASSumptions which assumes an ‘equilibrium’ that does not and can not exist and therefore has no actual physics to back them up.
The fact that supposed scientists around the world actually fall for this hoax says a lot about the miserable state of the education systems or the general honesty and integrity of scientists or both.
Love it.
I remember a poster showing that local temps follow H2O not CO2 on Bart’s “Random Walk” thread.
It was totally ignored because it used real world “Facts” and nobody could argue with it.
Everyone knows we didn’t perfect thermometer reading until 2013.