
The White House used this graph to make it look like heavy rainfall events are increasing
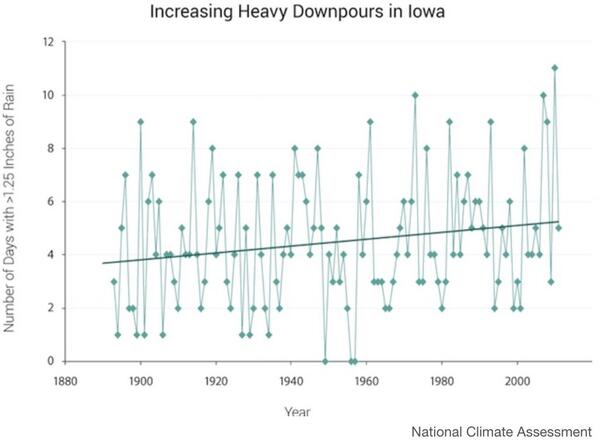
Here is the actual graph, without the last two years cut off. As usual, the White House is misleading the public. There is no trend.
The White House used this graph to make it look like heavy rainfall events are increasing
Here is the actual graph, without the last two years cut off. As usual, the White House is misleading the public. There is no trend.

Cherry picking data, again.
Hope and change and lies!
Wow! Now heavy downpours are the stuff of global warming …… errrrrrr……. climate change ………… errrrrrrrr ………. climate disruption? You really do need a dumbed down populace to sell that.
Notice the White House graph of 1.25″ of rainfall uses number of days while the HCN graph uses a frequency percentage rather than straight days. Now, 10 days translates to a frequency of .027 and 11 days is .030. Then notice the WH’s graph depicts 3 years with 10 or more days of 1.25″ rainfall. Yet, the HCN Station’s data doesn’t depict a single year with 10 days or even 9 (.02466) days for that matter with this much rainfall. Not only does the WH alter the units on the Y axis, they then increase the number of days to make their point. Can any discerning person believe a word from this morally corrupt regime!
Rain makes grain. Would you rather have Iowa in a drought?
The data in those two graphs is quite different, it’s not merely the last two years cut off. THe peaks are different and the lows are also different.
The fickle scientists convinced themselves so well that human caused global warming is true that they in fact created human caused global warming by creating bad graphs.
Its almost a bad novel now about how observer bias will make you into a screeching idiot who is crying wolf.
” they in fact created human caused global warming by creating bad graphs.”
A veritable psychopath’s wet dream; “Here, look at this data I just ‘took’ … what do you see?”
If only Zatoichi was around to sort out the cheaters the old fashioned way!
http://youtu.be/aqGd8Khg7ug
The BOM says heavy rainfall is due to natural variability!
http://www.bom.gov.au/state-of-the-climate/
“Heavy rainfall
Natural variability continues to play the dominant role in extreme rainfall in Australia. Observational data show that the area of the continent receiving very high rainfall totals (above the 90th percentile) on seasonal and annual timescales has increased since the mid-twentieth century, however few statistically significant trends in changing rainfall intensity have been found across the continent.
Recent studies examining heavy monthly to seasonal rainfall events that occurred in eastern Australia between 2010 and 2012 have shown that the magnitude of extreme rainfall is mostly explained by natural variability, with potentially a small additional contribution from global warming. Understanding changes to Australian rainfall intensity is an area of ongoing research.”
Gives new meaning to the term “swift justice.”
If AGW is so ironclad why is most of the information promulgated by its adherents presented deceptively? This is a rhetorical question. We all know that the “progressive” must lie to the rube for the rube’s own good.
I’m beginning to think that sociopaths and psychopaths dominate the democrat party, not that politics in general attracts those kinds of people given their desire of ‘control’ over others (after all, ‘man’ is the most challenging game on the planet).
They looked only at Iowa? And they complain when we look at “only” an entire continent.
Goose, Gander, Psychopaths, right?
What climatologists sound like:
[youtube=http://www.youtube.com/watch?v=tdiaWEURgGA&w=560&h=315]
He missed the ‘target area’ by a country mile; the ‘Moderate’ risk area for today shows to be in Minnesota and southward into Iowa at the present, not Dallas (Texas anyway) per:
non-static webpage: http://www.spc.noaa.gov/products/outlook/day1otlk.html
And, so far, kind of a wide area comprised of several loosely organized squall lines are moving through the I-35 corridor (+- 75 mi E-W) from well south of Dallas into Oklahoma. More showers extend from Waco and SE to the Gulf coast. Later today we may have some ‘fireworks’ as more active dynamics come into play though …
A real “Rain Man”.
Supposedly the gentleman is autistic; this may be therapeutic and geared towards a more normal existence in life …
A WH report approved by the choom-smoker-in-chief no doubt, well what can you expect? Science?
A fiction, not a good fiction but just plain fiction; a concoction, a conjure; pure synthesis w/o regard for fact(s), need(s), or suitability for any application or purpose whatsoever …