Disrupting the Borg is expensive and time consuming!
Google Search
-
Recent Posts
- Gaslighting 1924
- “Why Do You Resist?”
- Climate Attribution Model
- Fact Checking NASA
- Fact Checking Grok
- Fact Checking The New York Times
- New Visitech Features
- Ice-Free Arctic By 2014
- Debt-Free US Treasury Forecast
- Analyzing Big City Crime (Part 2)
- Analyzing Big City Crime
- UK Migration Caused By Global Warming
- Climate Attribution In Greece
- “Brown: ’50 days to save world'”
- The Catastrophic Influence of Bovine Methane Emissions on Extraterrestrial Climate Patterns
- Posting On X
- Seventeen Years Of Fun
- The Importance Of Good Tools
- Temperature Shifts At Blue Hill, MA
- CO2²
- Time Of Observation Bias
- Climate Scamming For Profit
- Climate Scamming For Profit
- Back To The Future
- “records going back to 1961”
Recent Comments
- Bob G on Gaslighting 1924
- Bob G on Gaslighting 1924
- conrad ziefle on Gaslighting 1924
- Bob G on Gaslighting 1924
- Bob G on Gaslighting 1924
- arn on Gaslighting 1924
- conrad ziefle on Gaslighting 1924
- Gordon Vigurs on Gaslighting 1924
- conrad ziefle on Gaslighting 1924
- Robertvd on Gaslighting 1924
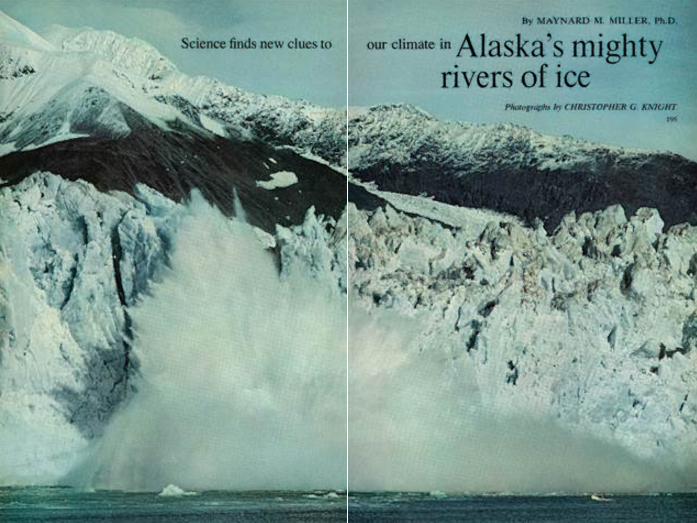
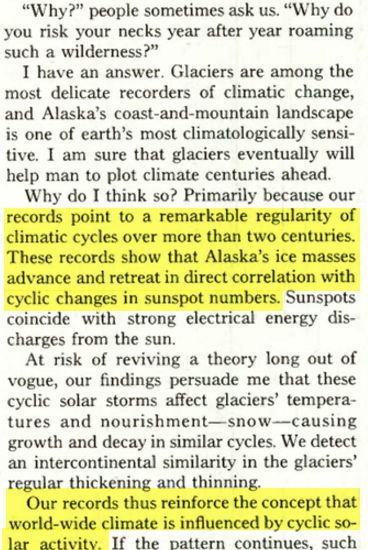
1967 National Geographic : Direct Correlation Between Sunspots And Climate
This entry was posted in Uncategorized. Bookmark the permalink.


Scientists used to believe that sunspots were correlated with climate — but then they found there was more funding for disbelieving.
sigh… Of course that is snark on my part, but how an earth can “scientists” claim that there is no correlation between solar activity and climate? Yes, I know, total solar output stays nearly constant, but the spectrum of solar output changes. “Climate scientists” tell us that solar output spectrum changes do not make a difference, then turn around and say that tiny changes in our atmospheric absorption spectrum drive the planetary climate! Madness!
Solar Radiation: Sources of Energy for the Earth’s Atmosphere
(wwwDOT)nasa.gov/mission_pages/sdo/science/Solar%20Irradiance.html
***************************
Solar Radiation – – Energy Flux – Solar Cycle Change – Deposited
TSI mostly Vis & IR – 1366 W/m2 – 1.2 W/m2 – 0.1% – Surface
MUV (200-300 nm).- – 15.4 W/m2 – 0.17 W/m2 – 1% – 15-50 km
FUV (126-200 nm) – – 50 mW/m2 – 15 mW/m2 – 30% – 30-120 km
EUV (0-125 nm) – – -10 mW/m2 – 10 mW/m2 – 100% – 80-250 km
***************************
Ultraviolet light creates and destroys the ozone layer depending on the wavelength so the changes listed in that chart matter. A shift in the ratio will shift the amount of ozone created vs that destroyed. Ozone production is driven by UV radiation of wavelengths less than 240 nm. Ozone is a highly unstable molecule so when it absorbs low energy UV (240–310 nm) it splits into an ordinary oxygen molecule and a free oxygen atom.
In the three decades prior to the 2009 solar minimum and the switch to a ‘quiet sun (1979 to 2009) the amount of ultraviolet (UV) radiation reaching Earth’s surface increased markedly. This energy would be absorbed by the oceans at depths up to 100 meters.
We were on the right track 50 years ago. Imagine how far we could have come in our understanding of climate if the grantologists had not taken over.
+1
In more ways than one.
I think it was Judith Curry who said that we have lost an entire generation of atmospheric scientists to this sad little hoax.
The graph was supposed to be above, was I missing an “a href…/a”? I used img src(?)
http://www.woodfortrees.org/graph/sidc-ssn/from:1850/plot/hadcrut4gl/scale:50
And now for some breaking news! The sun warms the earth.
“…strong electrical energy discharges from the sun.”
https://www.youtube.com/watch?v=5AUA7XS0TvA
Sunspot count down to 26, and those spots are about to rotate away in a couple days, meaning zero spots soon? http://spaceweather.com/
Probably not. But possibly.