
Nearly everything NASA says about climate is fraudulent, and their claims about sea level are no exception. Their sea level data agreed with the 1990 IPCC report until about 1920, but after 1920 NASA turned a measured reduction in sea level rise rates into an acceleration.
Sea level rise is caused primarily by two factors related to global warming: the added water from melting land ice and the expansion of sea water as it warms.
NASA : Climate Change: Vital Signs of the Planet: Sea Level
1990 IPCC : Chapter 9

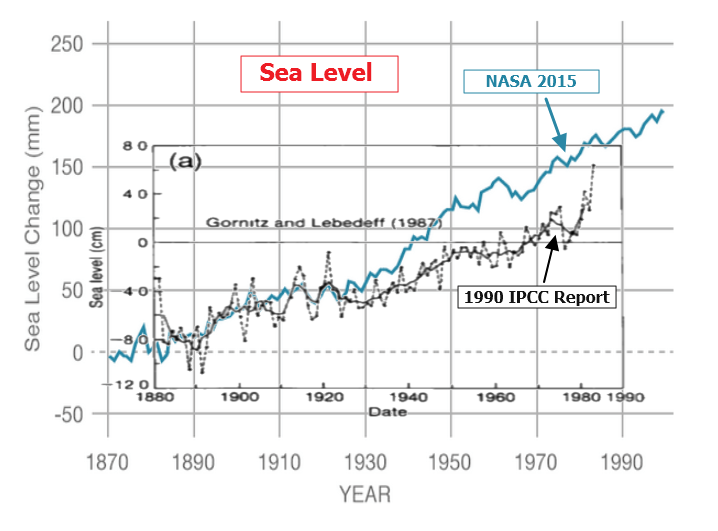
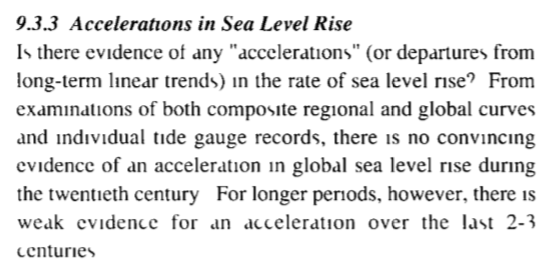
The 1990 IPCC report said that sea level was rising from 1.0-1.2 mm/year, and had not accelerated in the 20th century.
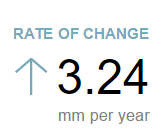
The criminals at NASA have tripled the rate of sea level rise to 3.24 mm/year.
Hopefully the next president will round up the government climate banditos, and send them riding off into the sunset
https://www.youtube.com/watch?v=PRx5r32hsF4

Steven, we have a new way to measure sea level now. In the middle instead of only at the edges. With satellites. You know. Like the ones you believe are the only accurate way to measure temperature: http://www.star.nesdis.noaa.gov/sod/lsa/SeaLevelRise/
Bit more cognitive dissonance there.
[SG : Only a complete moron or a criminal would switch to an uncalibrated measurement device, and then claim that different readings from that device were caused by a change in the object being measured. Is Martin a criminal, or just a moron?]
The satellite data for sea level has been co-opted by the scammers… and “adjusted™” to their needs and to dis-inform the public and the gullible politicians.
That is FRAUD.
And YOU support it.. because its all you have.
Further on that FRAUD.
READ and digest, little goreboy
http://wattsupwiththat.com/2014/07/16/latest-noaa-mean-sea-level-trend-data-through-2013-confirms-lack-of-sea-level-rise-acceleration-2/
I defy you to go to the REAL DATA and find one tide gauge that is accelerating
http://tidesandcurrents.noaa.gov/sltrends/sltrends.html
It is a MONUMENTAL LIE.. and YOU support it.. because its all you have.
Read my comment at 5:38 on the what’s up with that link in AndyG’s post above
Steve, In the interest of saving others some time, I hope you don’t mind…
——————————————————————————————
Steve Case July 16, 2014 at 5:38 am
“…. if you download their data
http://sealevel.colorado.edu/files/2014_rel4/sl_ns_global.txt
and apply some modest Excel skills [Text to columns & the slope function] you will find that a comparison of the first ten and a half years of data with the second ten and a half [1992.9595 to 2003.5744 and 2003.6015 to 2014.1893] tells you that the rate of sea level rise has slowed from 3.6 mm/yr to 2.9 mm/yr.
Really it was 3.6 mm/yr in 2004? I thought DHR said the highest point was March 2014? Who remembers that the rate was 3.6 mm/yr ten years ago? Nobody, because it wasn’t. If you check the old charts retained by the Internet Archives WayBack Machine
https://archive.org/web/
by putting in CU’s URL you can go back to 2004 release #1 and the rate was 2.8 not 3.6 mm/yr.
What that means is the historical data has been rewritten.”
Hey Smith, the link you provided shows no acceleration. It’s a straight line. Did you look at what you linked to, or do you not even understand what acceleration looks like on a chart with cartesian coordinates?
http://www.star.nesdis.noaa.gov/sod/lsa/SeaLevelRise/
Morgan, the trend line in that graph is computed with simple linear regression. https://en.wikipedia.org/wiki/Simple_linear_regression
Simple linear regression ALWAYS produces a straight line through ANY data.
Note that the current rate of sea level rise is 2.9 mm/year, which is much higher than the trend for last century. That indicates acceleration. This is all basic statistics, Morgan. You really have to at least understand basic statistics.
“Note that the current rate of sea level rise is 2.9 mm/year”
ANOTHER LIE.. but its all you have.
You are a liar. You took the sea level rise from satellite data after 1992 and spliced it onto tide gauge data before 1992. Two different measurement systems cannot be used in a longitudinal study. If you continue using tide gauge data after 1992 there is no change in rise whatsoever. http://tidesandcurrents.noaa.gov/sltrends/sltrends_station.shtml?stnid=1612340
No, Morgan, I did not. I showed you a graph from NOAA. You will find the global trend graph for gauges only in this paper:
See figure 3, graph (a): http://academics.eckerd.edu/instructor/hastindw/MS1410-001_FA08/handouts/2008SLRSustain.pdf
http://88.167.97.19/temp/Sea-Level_Acceleration_Based_on_U.S._Tide_Gauges_and_Extensions_of_Previous_Global-Gauge_Analyses_jcoastres-d-10-00157-1.pdf
that concludes (I’ve capitalised a few words to make the point clearer)
“Our analyses do not indicate acceleration in sea level in U.S. tide gauge records during the 20th century. Instead, for each time period we consider, the records show small DECELERATION that are consistent with a number of earlier studies of
worldwide-gauge records. The DECELERATIONS that we obtain are OPPOSITE IN SIGN and one to two orders of magnitude less than the +0.07 to +0.28 mm/y2 accelerations that are required to reach sea levels predicted for 2100 by Vermeer and Rahmsdorf (2009), Jevrejeva, Moore, and Grinsted (2010), and Grinsted, Moore, and Jevrejeva (2010). Bindoff et al. (2007) note an increase in worldwide temperature from 1906 to 2005 of 0.74uC. It is essential that investigations continue to address why this
worldwide-temperature increase has NOT produced acceleration of global sea level over the past 100 years, and indeed why global sea level has possibly DECELERATED for at least the last 80 years.”
Martin LIES yet again !!
The adjustments that AndyG55 mentioned amount almost a mm per year since 2004. Besides that, the satellite data shows no evidence of acceleration over the last 22 years.
Steve, the current rate is about 2.9 mm/year, which is much higher than the rate for laqst century. You have to take a longer term approach.
There was no satellite data to corrupt back then.
The LONG TERM approach would be NOT to change the measurement system to one that could be easily corrupted.
The LONG TERM approach shows categorically that there is absolutely no sea level rise acceleration.
NONE what so ever.
You have been invited to find one long term tide gauge that shows acceleration.
Put up or shut up , you ignorant little twerp.
Andy, See figure 3, graph (a): http://academics.eckerd.edu/instructor/hastindw/MS1410-001_FA08/handouts/2008SLRSustain.pdf
http://tidesandcurrents.noaa.gov/sltrends/sltrends_global.htm
There are hundreds of tide gauge stations there. Find ONE with an acceleration and I’ll give you $5
Morgan, you are simply misinterpreting the data. See figure 3, graph (a): http://academics.eckerd.edu/instructor/hastindw/MS1410-001_FA08/handouts/2008SLRSustain.pdf
Typical. He links to a fraudulent Church and White paper.
Again it absolute refusal to look at REAL DAT.. because KNOW it will destroy your deceitful brain-washed lies.
The LONG TERM approach shows categorically that there is absolutely no sea level rise acceleration.
NONE what so ever.
You have been invited to find one long term tide gauge that shows acceleration.
Put up or shut up. REAL DATA really SCARES you doesn’t it, slimy, deceitful, little goretroll.
You’re comparing satellite data to tide gauge data. They aren’t the same. Tide gauges haven’t been adjusted. Satellite data kept by Colorado University’s Sea Level Research Group is adjusted on a regular basis, and so far those adjustments amount to nearly a full millimeter per year. since 2004.
Besides that, here’s my post from a few days ago.
Martin Smith says:
November 28, 2015 at 4:53 pm
https://stevengoddard.wordpress.com/2015/11/25/biggest-fraud-in-history-perpetrated-by-tom-karl-and-gavin-schmidt/#comment-555379
I don’t know what you mean by catastrophic disaster, so I can’t answer your question directly.
What I believe is that there is already enough unavoidable warming in the pipeline so that we can’t avoid having to deal with serious problems of … sea level … that those problems will cause. If we don’t act to drastically reduce burning fossil fuels, these problems will only get worse.
So why not flesh out your concerns about sea level rise? I choose that one because I think it’s the scariest issue you guys have. The vision of inundated coastal cities does strike a nerve, so what are your projections? Numbers and dates would be good?
“… the current rate is about 2.9 mm/year, ….”
That’s less less than the thickness of two of these per yer:
http://ebid.s3.amazonaws.com/upload_big/5/1/9/1414976407-10779-42.jpg
Morgan, you have reduced yourself to saying simply that all climate scientists you disagree with are frauds, and all climate research that you disagree with is wrong. That is basically what all of you are saying, including Steven Goddard.
I don’t care what a paper by two clowns says when I can see the data myself. All tide gauges around the world show linear rise. Church and White average the non-accelerating lines together and get acceleration. By definition, they are frauds, because what they did was so glaringly false.
Don´t change stick in the middle of a game.
If You where interested in change of a measurement You should avoid change stick.
If You where honest You could at least show the old measures.
(1,7 mm/ a Year as before)
The satellites are calibrated. But just so we’re clear, you really are disowning satellites for measuring sea level, but you require satellites for measuring temperature.
And please stop altering my posts, Steven. It is deceitful. Please reply to my posts in the correct way.
Nobody is disowning satellites. You just can’t mix them with tide gauge data.
Morgan, the tide gauge data shows an acceleration. I pointed you to the paper that has the data and the graph. Here it is again. You can’t discredit science by claiming it is wrong: http://academics.eckerd.edu/instructor/hastindw/MS1410-001_FA08/handouts/2008SLRSustain.pdf
Yawn. A paper that talks about other cherry picked papers that use fudged data and cherry picked dates. Of course sea levels rose faster after the LIA ended.
As a Remote Sensing student, we were correctly taught that satellites must be calibrated using in situ measurements, for example tide gauges.
More cherry picking and fudged numbers from Marty, big surprise.
Horse manure. The tide gauges all show no acceleration. A hack science paper by two frauds working for government grant money show what they were paid to show.
Morgan, the tide gauge data shows an acceleration.
=============
Martin, you might be interested in this study of tide gauges…
…65% of tide gauges, the majority, show no sea level rise at all
http://pluto.mscc.huji.ac.il/~msdfels/wpapers/Tide%20gauge%20location.pdf
Let me give you an example. Say you’re driving in a car at 30 MPH according to the speedometer. You decide that’s not accurate enough so you stick a radar gun out the window, and it says 35. You say “Wow, I accelerated!!!!!!” even though the speedometer still says 30.
Church and White spliced satellite data onto tide gauge data in 1992, the broken cue stick that adds to the collection of fraudulent sporting goods.
Stop making accusations without proof, you LYING p.o.s.
And again, explain why the satellite data is NOT corrected for the know subsidence of its main reference point.
That point has been shown to be sinking at 2.2mm/year, meaning that the actual REAL satellite sea level trend is about 1.4mm/year, just about what the REAL DATA from the tide gauges is.
The stuff you point to is corrupted by this non-adjustment for a known factor, and adjusted upward for theoretical maybe factors.
With satellites…
Martin thinks satellites can hind cast.
Still stalking Steve, little Marty?
My, what a poor, sad, boring life you must lead.
“said that sea level was rising from 1.0-1.2 mm/year”
Pretty much what the tide gauges STILL say.
Their corruption of the satellite sea level data is tantamount to scientific, and maybe criminal FRAUD. !!
Topex before “adjustment™”
http://jonova.s3.amazonaws.com/graphs/sea-level/axel-morner/satellite-altimetry-se-level-topex-poseidon.gif
And after “adjustment™”
http://jonova.s3.amazonaws.com/graphs/sea-level/axel-morner/sea-level-rise-satellite-altimetry-after-adjustment-500.gif
THIS IS SCIENTIFIC FRAUD
Andy, you have committed the Steven Goddard Fallacy (SGF). You have shown evidence of an adjustment and then you have called it fraud. Evidence of adjustment is not evidence of fraud.
Really? Well let me take the tide gauge data and adjust it for you, right here:
_______________________________________________________________
Do you see that line? I adjusted it to a horizontal line. That’s called an adjustment.
That was really dumb, Morgan.
Martin, you have committed the brain-dead moron fallacy.. as always.
Evidence of unjustified adjustments to meet a cause..is evidence of FRAUD.
Evidence of intentionally switching to a corrupted data set from a long term data set, with the absolute intent of deceiving un-thinking fools like you.. IS FRAUD
More on the CORRUPTION of the satellite sea level data
http://hockeyschtick.blogspot.com.au/2013/10/satellite-sea-level-data-has-been.html
Thanks for linking to my stuff (-:
The satellite data references a place named Battery, NYC .
Go to this page ftp://cors.ngs.noaa.gov/cors/coord/coord_08/nad83_2011_geo.comp.txt for the latest computed results which include vertical movement for a selection of CORS sites
With that, and NOAA’s tide gauge data and/or satellite derived sea level data, one can tell what is really happening.
The latest subsidence numbers for the Battery, NYC come from this paper. Using global positioning system-derived crustal velocities to estimate rates of absolute sea level change from North American tide gauge records by Richard Snay et al. who calculate a long-term geological rate of 2.2 mm/yr. [Note carefully — the 2.2 mm/yr is the SUBSIDENCE rate — the land sinking]
So the satellite trend of 3.6mm/year MINUS the 2.2mm/year SINKAGE of the reference point..
Equals about 1.4mm/year.. almost EXACTLY what the tide data suggests.
REAL DATA HURTS you, doesn’t it, little goreworm.
For more REAL information, go to
http://wattsupwiththat.com/2014/01/27/what-to-do-about-the-flood-next-time/
Oh wait there. Martin says 2.9mm/year.
minus the sinkage of the reference point = 0.7mm/year.
That’s almost exactly what the most stable places in the world give.
http://s19.postimg.org/o9k545yr7/image.jpg
Some more
https://wattsupwiththat.files.wordpress.com/2014/01/tfnt_tides.jpeg
Note, there is absolutely NO ACCELERATION.
These points are of course where land is sinking.
Andy, you are showing graphs that have their trend lines computed with simple linear regression. And I believe the data used in those graphs doesn’t have land subsidence removed. In any case, you have to do the processing required on all the data, not just the few sites you want to cherry-pick.
Yet you are TOTALLY unable to find one site that shows any acceleration.
And you are correct, the 6 graphs above have not been adjusted for settlement and land movement, otherwise the trends would be about 2 to 2.5mm/year LESS than that given
The stable land tide data has values between about 0.5mm/year and 1.8mm/year.
You can find that REAL DATA from the link to the NOAA data.. if you weren’t so afraid of REAL DATA.
Land subsidence is exactly what the HAVEN’T accounted for in the fraudulent satellite sea level trend. They KNOW that their reference point is sinking at about 2.2mm/year, but they don’t take that into account. That is FRAUD
The REAL sea level trend from the satellite data is about 1.4mm/year.. same as the tude gauges.
Andy, See figure 3, graph (a): http://academics.eckerd.edu/instructor/hastindw/MS1410-001_FA08/handouts/2008SLRSustain.pdf
Or you could look at a peer reviewed paper..
http://88.167.97.19/temp/Sea-Level_Acceleration_Based_on_U.S._Tide_Gauges_and_Extensions_of_Previous_Global-Gauge_Analyses_jcoastres-d-10-00157-1.pdf
that concludes
“Our analyses do not indicate acceleration in sea level in U.S.
tide gauge records during the 20th century. Instead, for each
time period we consider, the records show small decelerations
that are consistent with a number of earlier studies of
worldwide-gauge records. The decelerations that we obtain
are opposite in sign and one to two orders of magnitude less
than the +0.07 to +0.28 mm/y2 accelerations that are required to
reach sea levels predicted for 2100 by Vermeer and Rahmsdorf
(2009), Jevrejeva, Moore, and Grinsted (2010), and Grinsted,
Moore, and Jevrejeva (2010). Bindoff et al. (2007) note an
increase in worldwide temperature from 1906 to 2005 of 0.74uC.
It is essential that investigations continue to address why this
worldwide-temperature increase has NOT produced acceleration
of global sea level over the past 100 years, and indeed why
global sea level has possibly decelerated for at least the last
80 years.”
Figure 3 graph a says nothing about acceleration. What do you think it says?
Yes, they have their tiny little insignificant bit of red line too steep, because that haven’t adjusted properly for the satellite reference point..
Is that what you were trying to show us?
I reformated that for you Andy
OH, GOODY!
Another study for my sea level fraud collection!
https://media2.stickersmalin.com/produit/100/stickers-devil-smile-R1-143760-2.png
Steve Case, you can’t be serious. The graph clearly shows an increasing trend. That is acceleration.
You mean the curved line they have put there to fool the gullible.
You must be joking Martin, and again exposing your absolute mathematical stupidity and ignorance.
I mean how stupid do they think people are.
They are obviously aiming the graph at people like martin, that they know are stupid..
Fig 3 b shows a clear step change in about 1930, then an even slope of about 1.7mm/year with cycles there after. They have also tacked satellite data , not properly adjusted for the subsidence of the reference point onto the end.
The curved line is either scientific incompetence, or scientific fraud.. people can choose which they think it is.
Anyway, I’ve fixed their graph for them and added some realistic trend lines.
(In Fig 3a, I would have liked to show the part from1880 to1925 gradually levelling out, but the simple graphic package I’m using doesn’t do that easily.
In Fig 3a, I’ve also adjusted their little tacked on satellite bit, with the proper adjustment for reference subsidence.
http://s19.postimg.org/iy32z5dir/Fixed2.jpg
Seems Martin didn’t understand that the reference point for the satellite data is sinking at 2.2mm/year,…
meaning that the REAL TREND in the satellite data is about 1.4mm/year. Pretty much what the REAL DATA from tide gauges says.
Anyone not taking the sinking of this reference point into account, (ie the paper he links), is either INCOMPETENT or committing FRAUD with the obvious intent to deceive.
Its just like the surface temperature data and UHI adjustments….
….they adjust them in the direction that suits the agenda, rather than the direct REAL SCIENCE dictates.
Andy, I was really surprised (though I should not be) at this.
So NASA is ‘adjusting’ the sea level to meet the predictions !!!
http://reactiongif.org/wp-content/uploads/GIF/2014/08/GIF-jaw-drop-shock-shocked-star-trek-surprised-GIF.gif
Thanks again, peeps!
Go to work. Those egg McMuffins need fipping.
flipping
The egg always ends up on his face !! 🙂
Thank you for giving us yet another opportunity to show just how ignorant the average alarmista is.
You are still batting zero on information and data provided.
But zero is all you have.
Martin Smit says: “Note that the current rate of sea level rise is 2.9 mm/year, which is much higher than the trend for last century. “
Well I sure in heck hope it is! Ice cores from the Freemont Glacier show it went from Little Ice Age cold to Modern Warming warm in the ten years around 1850 — Naturally.
Actually the ‘sea level rise’ has FALLEN about 4 to 6 feet.
DIRECT MEASUREMENT IN TECTONICALLY STABLE AREAS
Tectonically stable area refers to areas devoid of deformation such as all processes which modify the external form of the crust. For example unidirectional vertical movements, plate tectonics and also the rise and fall of the solid earth surface, especially in coastal areas, caused by external factors such as climate change (gio-isotasy, hydro-isotasy)
Mid to late Holocene sea-level reconstruction of Southeast Vietnam using beachrock and beach-ridge deposits
Translation the sea level was up to 1.5 meters higher than today in a tectonically stable area ~5000 years ago to 2000 years ago.
Late Quaternary highstand deposits of the southern Arabian Gulf: a record of sea-level and climate change
This study shows a sea level highstand ~1 to 2 meters above the present level about ~5500 years ago. Again in a tectonically stable area.
The Quaternary Geological History of the Santa Catarina Southeastern Region (Brazil)
This study shows a sea level highstand ~ 4 meters above the present level about ~5000 years ago. With sea level oscillating since then. Not only has the sea levels have dropped since the Holocene Optimum the evidence shows that “warmer paleotemperatures were favourable for great proliferation of mollusks in the area”
Santa Catarina Brazil is at latitude 27.2500°S and is tectonically stable as shown by other papers.
VALIDATION BY ALTERNATE STUDIES
GLACIAL ADVANCE
Ice free Arctic Ocean, an Early Holocene analogue
Temperature and precipitation history of the Arctic
A new approach for reconstructing glacier variability based on lake sediments recording input from more than one glacier January 2012
The highest glacier growth started 600 years ago prior to that most glaciers had melted away.
THIRD METHOD OF VALIDATION
Sea Level Changes Past Records and Future Expectations
Little Marty has run away from the REAL DATA , yet again.
But its good that he makes his erroneous comments, means we can tear his idiocy apart, for all the visitors to the site to see. 🙂
That is exactly what I am thinking.
What fun playing Wack -a -Troll with someone who is so completely unarmed.
All the visitors? Do you really think anyone who wants information about climate science visits this blog to get it? Visitors to this blog are either people like me, who enjoy improving our ability to find errors in logic and math in pseudoscientific writing, or they are people like you, who appear not to have the brains to pour sand out of a boot… with instructions on the heel.
It has become repetitive, though, because all of you, including Steven Goddard, commit the same error over and over again and again. You find evidence of a data adjustment by comparing old data to new data, and then you claim the difference is proof of fraud. Steven Goddard has done that in every blog post I have read of his in which he claims to have detected fraud. Every time.
No one uses this site as a reference. Even Anthony Watts and Judith Curry dismissed it as bogus.
May you live in interesting times, Andy.
I know how to pour sand from my boot, but you don’t know sick’em from come here.
MS: “Even Anthony Watts and Judith Curry dismissed it as bogus.”
Puleeeze. I know exactly the instance you’re referring to, and It’s not surprising you left off the fact they both turned right back around and made mea culpas after they realized Tony found was right.
ooops. In the post above, the word “what” should be between “realized” and “Tony”.
Martin-
Your response to an accusation of running from data is entirely devoid of any data. That’s not very informative.
If you want to debate straight logic, I’d be pleased to. I’ve made that request of you several times now. I’m sure Gail would be thrilled to trade scientific papers back and forth with you, but I don’t have that capacity. I’ve never claimed any particular expertise, nor do I share the strong beliefs that several on this site, including you, demonstrate. All I have are a few fundamental questions that I’ve never seen answered satisfactorily. I hope you can help me with them.
Let me start with the heart of your arguments, that the adjustments to the data are proper. You have been shown many times that the magnitude of the adjustments is greater than the margin of error. Logically, that condition invalidates either the adjustments, or the data. Can you explain why that isn’t the case? Can you explain why the reported margin of error was DECREASED, when the error was found to be greater than that initially claimed for the measurements? Alternately, can you show any evidence that Tony has lied about the magnitude of those adjustments, and that they’re all still within the original and current margins of error?
I’ll gladly read anything you can link me to, provided you can show me how to find it for free, and you can narrow it down to something actually relevant to the question. For example, simply linking to IPCC5 is of no use to anyone. That includes hundreds of pages that I’m sure even you would concede are irrelevant to this discussion. (the entirety of WGIII, for instance) Linking to IPCC5, WGI, Chapter 2, on the other hand could very well be relevant. Incidentally, I’ve read it, and I found no attempt to address the problem of adjustments greater than the error bars. But if you think I’ve missed something by all means, point it out.
I look forward to your response.
Martin say, “he’s here to find errors.” May I suggest if this is your true motive, you won’t find many here and when you do, it will be admitted and corrected.
You are wasting your genius here, you need to go back to ‘skepticalscience’ blog. Once you correct all of their sciency errors, errors of omission, fraudulent statements and data and so on, then and only then would I or anyone else take you seriously.
“who enjoy improving our ability to find errors in logic and math in pseudoscientific writing”
You have never found one REAL error, only in your fevered brain-washed imagination.
You are a scientific illiterate who has been PROVEN to have basically ZERO knowledge of anything to do with climate.
Adjustment of REAL DATA to meet a specific agenda IS TANTAMOUNT TO FRAUD…
No two ways about it, especially when that adjustment is pre-empted by comments in emails discussing the need for those adjustments.
That is why you run and hide from anything to do with REAL DATA..
Deep down, even you KNOW the adjustments are fraudulent.
Andy,
It is the fact that ALL the data, CO2, temperature, sea level and everything else is ‘adjusted’ to support the meme that is compelling evidence of FRAUD. THEN add the Climategate e-mails plus the IPCC’s mandate:
The IPCC’s ROLE
So there it is again. ONLY “human-induced climate change” is of interest and that is why you see very little work done on natural climate change. So it never was about understanding the climate. It was really about ‘options for mitigation and adaptation. ‘ and this is the change wanted by the Globalists like the UN, the World Bank, and the WTO.
And from the official UN Framework Convention on Climate Change
CLASSIC PROGRESSIVE manipulation by changing the meaning of a word. So people have been hoodwinked thoroughly into thinking the IPCC was actually looking at the climate when they never were.
Christiana Figueres, disciple of Al Gore, and Executive Secretary of the UN Framework Convention giving us one reason for the con.
Rosa Koire, a ‘flaming liberal’ puts it more bluntly Your government is a corporatocracy, a new authoritarian state in the process of consolidating your output into a more controllable, exploitable channel. and I certainly can not disagree with her.
The World Bank makes it very clear they see it as a money maker.
This is a fraud that produces nothing but poverty. It does not produce a single penny of wealth and instead acts as a short circuit across the advancement and wealth of an entire civilization funneling it into the pockets of the elite. It beats the heck out of AIG’s credit-default swap for sucking up other people’s money.
**********************************************************
AND HIDDEN AWAY SO NO ONE SEES THEY TELL THE TRUTH. They have no friggin idea of what the climate is going to do!!!
**********************************************************
The ClimAstrologists admit their models do not produce data, they only regurgitate the assertions put in. GIGO
On top of that the IPCC itself, has seen the light ,thrown up its hands, and given up on calculating a meaningful climate sensitivity – the AR5 SPM says ( hidden away in a footnote)
But paradoxically they still claim that we can dial up a desired temperature by controlling CO2 levels. This is cognitive dissonance so extreme as to be crazy…. OR A MAJOR CON JOB!
my guess is that MS is starting to “turn” LOL
Marty’s lies, love of “adjustments, and the fact that he thinks he is a “winner” online made me think of this great song…
https://www.youtube.com/watch?v=Fm7u25wRiV8
Saying that you are “out” in Hollywood, is nothing unusual !!
Does anyone have a reasonable estimate of error in satellite sea level figures? I seem to recall that the wavelength of the signals they are using is quite a bit longer than the figures they are reporting. If you have a 60 millimeter wavelength, it is not reasonable to report changes of a 20th of a wavelength per year — and that would true even if you knew the orbit of the satellite with zero error, which we do not.
By the way, in the very first comment in this thread, it is something of a straw man to imply that since you think that satellite temperature readings are more accurate than surface readings, then you ought to think that satellite sea level readings are more accurate than surface readings. Seriously, that is a very foolish argument, no cognitive dissonance involved. That is like saying, “I think that my doctor is better at surgery than my auto mechanic, therefore my doctor is better at car repair than my mechanic.”
Temperature vary less than levels!
Jason, why don’t you ask the scientists at NASA who are working on the project?
Martin, I do not trust them to answer truthfully. I think I am more likely to get accurate answers from people whose paychecks and continued employment are not contingent upon their public agreement with CAGW. I have seen one or two blog postings concerning the subject of satellite accuracy and sea level, but do not remember where I saw them and a quick google search did not turn them up for me. I am asking because so many of the crowd here keep track of such things. Seriously though… doesn’t the mismatch of wavelength and claimed rates of change make you go “hmmmmm”? This is not angular resolution, but doesn’t the Rayleigh Criterion apply to distance as well? And that still leaves orbital variations in question.
Why ever would anyone actually believe what a government bureaucrat says in this age of government lying?
SHIELDING THE GIANTS: USDA’s “Don’t Look, Don’t Know” Policy
A Rochester University/Strong Memorial Hospital doctor who was part of this** killed my mother. She and my father had ZERO idea she was being used by ‘The Butcher’ in any type of experimental studies and all of her medical was fully paid for. ** AMERICAN NUCLEAR GUINEA PIGS: THREE DECADES OF RADIATION EXPERIMENTS ON U.S. CITIZENS
The EPA and Rochester University is STILL using humans as experimental animals!
Teenager died in 1996 government-funded air pollution experiment at Univ. Rochester; University now using diabetics as air pollution guinea pigs
OH, and it was an overdose with lidocaine not the pollution that killed her. Given Strong Memorial’s very high mortality rate I am not surprise. Strong’s mortality rate was so high it was ‘featured’ on 60 Minutes Now I know why. (That hospital killed my best friend’s Mom and my boy friend’s Mom that same year too. All three had not reached retirement age.)
EPA’s illegal human experiments could break Nuremberg Code
Human testing lawsuit dismissed; Court lacks jurisdiction to hear case against EPA
Every time you dig, you find the US government fudging data and showing utter contempt for citizens. The list is too long to post and is found through out the FDA, USDA, EPA, IRS….
hee hee…
[youtube https://www.youtube.com/watch?v=8DEoOdcYKbc&w=640&h=360%5D
Thanks again, peeps.
Again, martin the goreboy avoids ANYTHING to do with REAL DATA.
REAL DATA scares the crap out of him.
Even with 2 mm, you are talking 8 inches in a hundred years. That is diddlysquat!
The North American plate is moving to the west-southwest at about 2.3 cm (~1 inch) per year driven by the spreading center that created the Atlantic Ocean, the Mid Atlantic Ridge. The small Juan De Fuca Plate, moving east-northeast at 4 cm (~1.6 inches) per year. The Juan de Fuca Plate is still actively subducting beneath N. America. Its motion is not smooth, but rather sticky; strain builds up until the fault breaks and a few meters of Juan De Fuca get slid under North America in a big earthquake.
British Columbia is part of rigid North America and moves with it. This results in the Puget Lowland being compressed and warped like an accordion with alternating uplifted and down warped terrain shortening the distance between Centralia, Washington, and the Canadia border.
This map measured over the puget lowland reveals a pattern of deep, fault bounded basins (cool colors) and uplifts (warm colors)
http://farm8.staticflickr.com/7034/6848950997_c7d6fbdec7.jpg
Some of the results of earth movement:
http://earthquake.usgs.gov/regional/nca/1906/18april/images/fenceoffset.gif
fence offset about 8.5 feet — California Earthquake of April 18, 1906
http://media2.fdncms.com/sfexaminer/imager/in-one-of-the-more-famous-photos-from-the/u/big/2909384/lomaprieta1.jpg
http://www.rstreet.org/wp-content/uploads/2015/03/456865315.jpg
https://images.rapgenius.com/b37e4c3c9fc044902f2ed7f680c0ee45.1000x664x1.jpg
Again, anyone with a passing knowledge of geology laughs at the Alarmists.
Gail, Key West is moving NNE faster than SLR too…
lack of coffee……NNW
Here is an interesting chart by Zhen Shao Huang, a high school student
Plate …………… Absolute Velocity (cm/yr)*
Antarctic ……………………. ~2.05
African ……………………… ~2.15
Arabian …………………….. ~4.65
Caribbean …………………. ~2.45
Cocos ………………………… ~8.55
Eurasian …………………….. ~0.95
Indian ………………………… ~6.00
Nazca ……………………….. ~7.55
North American ………….. ~1.15
Pacific ……………………….. ~8.10
Philippine …………………… ~6.35
South American …………. ~1.45
Sure makes the current sea level wiggles look like a wimp.
And then there is the EEmaine
figure 3 in their study
http://www.sott.net/image/s9/188218/large/hearty_and_neumann_2001_fig_34.jpg
Looks like that spike in sea level occurred about 2,000 to 3,000 years before the drop into full glacial inception. It also looked like it happened pretty darn fast. No human intervention needed either.
>>>>>>>>>>>>>
1 to 3 mm/year? 4 to 12 inches in a century?
http://www.webweaver.nu/clipart/img/people/men/rotlmao.gif
Geology again makes a laughing stock of the Alarmists.
GACK, I still can’t spell, thank you very much Progressive experimenters. (I was a victim of the See and Say ‘experiment’)
EEmaine = Eemian
Data from a school boy.!
Way beyond Martin’s pay grade.
He will ignore it.. or more likely , turn tail and run, again.
Andy,
Martin has been completely ignoring me and my info….. Should I scream sexist micro-aggression?
That’s what makes the sea level scam so funny, even at the “adjusted ” unrealistic level of 3.6mm/year…….
SCARY… NOT !!
Martin supports Islamism.. so of course he looks down and ignores female intelligence.
“fence offset about 8.5 feet — California Earthquake of April 18, 1906”
Holy Cow! What does that do to property boundaries? If you live in a duplex and it moves 8 feet, who owns what? Does the line still go down the middle? Or does eight feet of your living room now belong to the neighbor?
Since the duplex would probably be a pile of rubble, if I was still alive I would take the insurance money and run!
No way could you entice me to live in California.
Way back in the 1980s and 1990s when Florida was getting regular hurricanes, my job required me to speak several times daily with other techs out in California. I was told more than once, “You wouldn’t catch me living in Florida! You have hurricanes!” I always told them, “Yeah, and you have earthquakes. I can see hurricanes coming and be ready for them. Earthquakes? Not so much.”
You got it!
I rather deal with hurricanes and blizzards than earthquakes, volcanoes and tornadoes so I live on the mid atlantic coast, inland where we rarely see hurricanes and blizzards and tornadoes only rarely.
Gees, where I live, we just don’t get any of those “exciting events”
Best I can offer is the occasion very wet/windy day from an east coast low.. bringing minor flooding every 30-40 years or so.
Although , Newy did have an earthquake that did some major damage back in 1989.
Buildings had never been built with earthquakes in mind, so lots of damage.
http://www.australiangeographic.com.au/blogs/on-this-day/2011/12/on-this-day-newcastle-earthquake-strikes/
Hey Andy! You mean that the news reports of roving packs of dingoes eating babies is not true?!
I have heard that small edible objects can disappear on Fraser Island, which has a large dingo population.. but anyone who leaves a tent open in the Australian outback is just asking for trouble.
Andy, you Aussies have SNAKES
One step snakes and two step snakes.
I rather deal with my nice friendly copperheads and rattlers thank you very much.
Even though I back onto a reserve of sorts, I haven’t seen any snakes.
There is about 80m of cleared mown reserve before you get to the much overgrown gully.
The neighbours who back directly onto the scrub see the occasional brown snake in their back yards.
Actually Andy I like snakes.
I rescued a couple of black snakes (black rat snake –elaphe obsoleta) from the neighbors and tossed one in the grain room and the other under the house. They are great for keeping the rodent population down. Since the black snake shares the same taste in food as the copperhead (frogs, rodents, eggs of birds…) the copperhead, which is not such a mobile hunter cannot compete and hence will go elsewhere. I found black rat snakes climb treesand even into the hung cage with my chickens. It could not get out of the cage with an egg in its belly, so I caught it and moved it to the horse barn.
We have been here over twenty years and have not seen a copperhead since I installed my black snakes.
Probably not a good idea to install an Australian black snake ! 🙂
http://www.abc.net.au/news/image/5786916-3×2-940×627.jpg
http://www.abc.net.au/news/2014-10-02/snake-wrangler-catches-massive-red-bellied-black-snake-newcastle/5786950
That sucker looked like a one step or maybe a 1/2 step.
I have seen a water moccasin a lot bigger than that. It was on a road/path at Ft. Jackson SC and all I saw was the middle stretch across the road, no head or tail. I was on horseback and we didn’t stick around to see the head. Water moccasin are not only venomous but are nasty. The WILL chase you unprovoked despite what the ‘experts’ on the internet say. It was probably heading toward 6 ft. or more. RAH would have a better idea of how wide a military ‘path’ is.
Enjoy. 🙂
http://www.australiangeographic.com.au/topics/science-environment/2012/07/australias-10-most-dangerous-snakes/
Figure 3 graph a says nothing about acceleration. What do you think it says?
Martin Smith says:
December 1, 2015 at 1:54 pm
… you can’t be serious. The graph clearly shows an increasing trend. That is acceleration.
Doesn’t say how much. Should be in the form x.xxx mm/yr²
Then after you tell me how much, I’m going to want to know how well that squares with the predictions for sea level rise from your side of the coin. That’s usually by 2100.