
January 21, 1896 New South Wales reached 130 degrees. It was probably the hottest day in Australian history, during their hottest month on record.
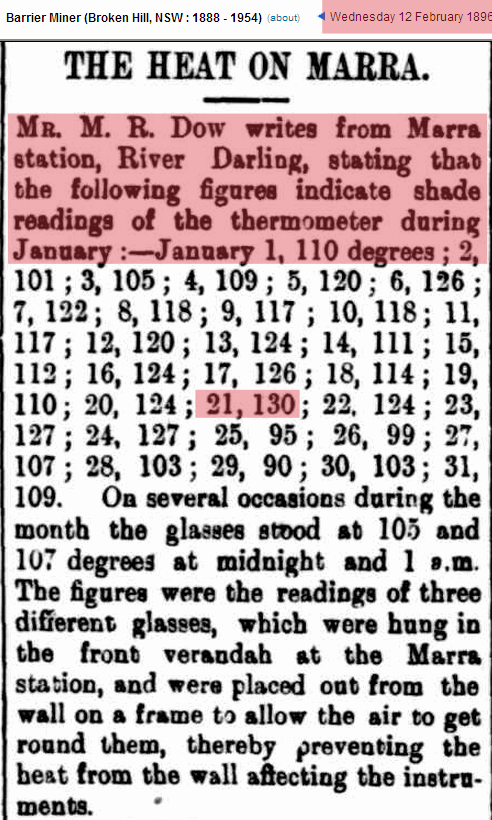
January 21, 1896 New South Wales reached 130 degrees. It was probably the hottest day in Australian history, during their hottest month on record.

That is taking New South Wales to the extreme….
can you be farther from Wales & still be on Planet?
Peter, is that a joke? One can be further from Wales ; heard of “New Zealand” – and on geography; both NZ & NSW have a far greater land mass & population than Wales…
i think that:had there been record-keeping, we would certainly know of previous, far hotter times…perhaps with very large beasts abundantly about…
Depends on what type of records you are talking about.
http://jonova.s3.amazonaws.com/graphs/lappi/65_Myr_Climate_Change_Rev.jpg
A lot of very warm temps were recorded between 1890 and 1910 in NSw particularly, often using proper screens.
BOM ignores them completely because to admit to them would make even more of a JOKE of the AGW scam.
typo..
in NSW and QLD particularly…….
Late 19th Century photographic evidence of the Stevenson Screen in Australian meteorology
Melbourne 1879 – from Museum Victoria.
http://i2.wp.com/www.warwickhughes.com/agri/melstscr1879.jpg
Hobart, St George’s Terrace, Battery Point, circa 1900 damaged – person is Leventhorpe Hall.
http://i1.wp.com/www.warwickhughes.com/agri/hobstevscr1900.jpg
Here is an extract from The West Australian Wednesday 25 October 1899 page 4 – The meteorological report for 1898, prepared by Mr. W. E. Cooke.
http://i2.wp.com/www.warwickhughes.com/agri/twa_25Oct99.gif
Text reads:
………………………………..
You can then go to the USA for a description of the maximum and minimum self-registering thermometers. Instructions were written and given out to the observers in 1882. There were two thermometers, one max and one min. This original system had two separate thermometers. One mercury for the high temperature and an alcohol thermometer for the minimum temperature. No mention is made of the switch to the Six min/max thermometer.
For the maximum thermometer the instructions state:
“…When a maximum thermometer is not read for several hours after the highest temperature has occurred and the air in the meantime has cooled down 15° or 20°, the highest temperature indicated by the top of the detached thread of mercury may be too low by half a degree from the contraction of the thread….”
That would indicate the max thermometer should be read just after the heat of the day and any adjustment for reading at the wrong time of day should RAISE the maximum temperature not lower it!
So much for Zeke Horsefeather’s and the rest of the ClimAstrologists TOBS bovine feces.
Meteorology: A Text-book on the Weather, the Causes of Its Changes, and Weather Forecasting by Willis Isbister Milham 1918 mentions the Six thermometer and says the accuracy was not good so the US weather service used the two thermometers mentioned above.
I thought it quite interesting that Willis Isbister Milham was talking about 20 years of hourly data in 1918.
On page 68 he says a thermometer in a Stevenson screen is correct to within a half degree. It is most in error on still days, hot or cold. “In both cases the indications of the sheltered thermometers are too conservative.”
on Page 70 he states
A paper in The American Meteorological Journal, Volume 8 from 1891 also mentions the Richard Freres thermograph and the ‘regulation Stevenson Screen’ in use in Spain.
And a bit more information validating Willis Isbister Milham statement in the textbook that a thermometer in a Stevenson screen is correct to within a half degree. It is most in error on still days, hot or cold. “In both cases the indications of the sheltered thermometers are too conservative.”
Thank you, Gail. Very interesting stuff.
Pass the info on please. I try to hand others useful ammo.
In 1896 the heat was causing people to faint, become demented and was even blamed for driving people mad. “Several women fainted in the streets. A little girl, while walking along Surrey Hills, suddenly became demented through the heat.” In Bendigo “a young man named Edward Swift, hairdresser, was so overcome by the heat that he was unable to work, and in despair shot himself, in the breast. It is a hopeless case.” Longreach “police authorities at Longreach received information that a man who was insane was about fourteen miles out of the town.” “The bodies of people who die of sunstroke decompose very quickly”. An axe wielding man in Bourke cut down three telegraph poles before he was “secured” by police. Presumably the real cause of the madness was something else, but the heat was the last straw. “Birregurra was stirred from its wanted sleepiness on Saturday evening last by the appearance in the streets of a mad man who caused no small consternation.” It could be that nuttiness was equally common on other months, or other years. But at the time, people blamed the heat.
With this and people dropping dead in the streets from Perth through Adelaide to Sydney, the heat wave was described as being universal from west to east . It went north into Queensland and south through Victoria.…twice, by which time Australians considered themselves to be “Under Fire”.
Later in 1896, heat waves also occurred in India, Burma, Borneo, America. (It was bad in New York. Listen here.) There was heat in England, Germany and Spain. 1896 was an example of extreme weather.
http://joannenova.com.au/2012/11/extreme-heat-in-1896-panic-stricken-people-fled-the-outback-on-special-trains-as-hundreds-die/
You just made a great case explaining the global warming ‘scientist’ phenomenon!! They are all demented from the roasting hot atmosphere.
So once again we have been duped and no one has done or said anything about it (30% ice graphs) http://ocean.dmi.dk/arctic/icecover.uk.php
The thing that bothers me about the 15% chart is that it still shows a baseline and a one standard deviation bar. For years, we were told that the 30% chart was more reliable because the coastal areas were questionable and therefore masked out. One presumes (yes, dangerous to presume) that the reason why the 15% charts are now being shown is that newer technologies now allow a better estimation of the previously disputed coast. If that is so, then where did the long term baseline come from? Did the chart makers just assume that the earlier and more questionable 15% counts would average out to be a correct baseline even though the individual days were not reliable?
I may be remembering incorrectly, but didn’t the 30% concentration chart also have the 1979-2000 mean line plus the grey one standard deviation area?
It isn’t on today’s update.
Also note the fact that the 22-JAN entry seems to be identical to the 21-JAN number. Given the fact that for the 30% chart there were no data points between 8-JAN and 21-JAN, that begs the question of whether today’s data point is simply a fill-in using yesterday’s data.
Also why ONE std. Why not the industry standard of plus or minus two or two and a half? Is it to make the variation more ALARMING?
From WIKI
https://upload.wikimedia.org/wikipedia/commons/thumb/a/a9/Empirical_Rule.PNG/450px-Empirical_Rule.PNG
Did you all see the long article on Drudge yesterday explaining why all raw surface temperature data must be altered to get the true picture of what is going on? Their premise was it would be foolish to take any temperature reading at face value without their expert alteration. They also threw out all Satellite data. It was an incredible piece of non-scientific propaganda. They also took the required sideways jab @ the Real Science blog. This had truly regressed into a complete criminal enterprise.
During Jan 1896, Bourke in NSW had 22 consecutive days of +40.0C. Only 1939 comes close to that.
The monthly mean was 43.4. Ten times before 1939 they had a monthly mean over 40. Only 4 times over 38 since 1950 until it closed in 1997.
Then in 1889, they had 18 days over 40 in Jan and another 14 days in a row over 40 the next Feb. The mean for both were just under 40 while the previous Dec had a mean of 40.2 and the November 38.9. There were 3 stretches of a week or more of over 40 in those two months. Then it hit 46.7°C in March after the ridiculously hot summer.
I live in south East Queensland and have lived in western Qld and the tropics at ~12 degrees south.
But I have never experienced heat like one finds in inland NSW – even when we lived in Charleville a trip to Bourke a few hundred kilometres south showed this.
Very true Rosco ; I’ve driven from the North East Coast across NSW to South Australia in the middle of Summer – “hottest I’d experienced anywhere in Australia” or in any other Country…
Outback NSW is very arid & flat with few rivers and little going for it… whereas Queensland has the monsoon rains, with more rivers and humidity to moderate temperatures, for the most part.
Reblogged this on Climatism.