
Gavin thinks he can massively tamper with data, and no one will notice.
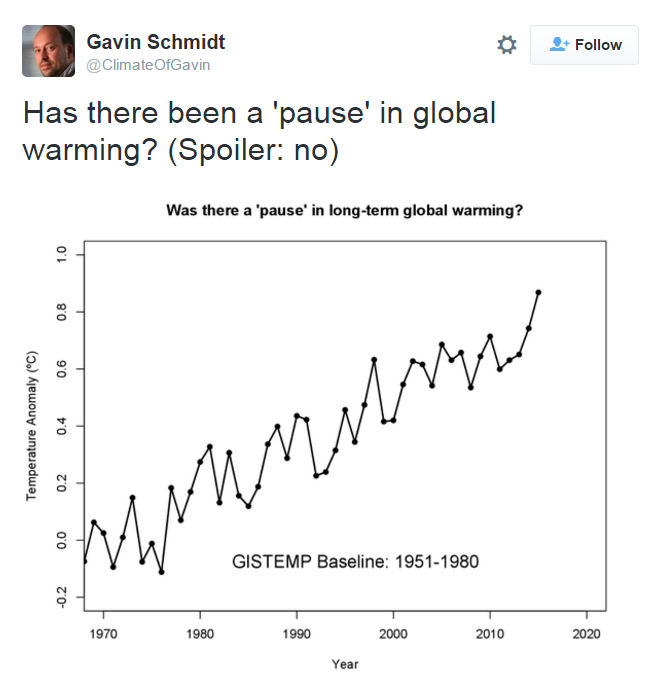
He has doubled global warming by simply altering his own data over the past 15 years.
2016: Fig.A.gif 2001: Fig.A.ps
He also ignores satellite data which shows that his temperature data is complete garbage, and that temperatures have not risen this century.
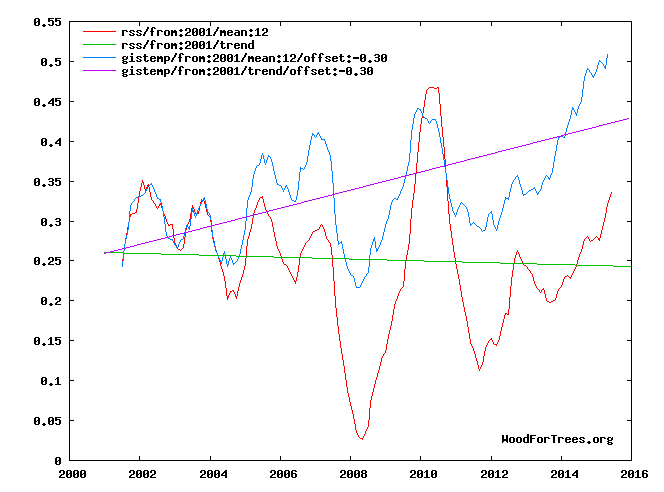
Wood for Trees: Interactive Graphs
The fact that the US space agency is ignoring satellite data, is a pretty strong indication that the agency has collapsed into a hopelessly corrupt and decadent state.

Just like clockwork (predictable)
http://www.foxnews.com/science/2016/01/20/2015-was-hottest-year-ever-with-records-set-around-globe.html
We know that around HALF of USA data is “ESTIMATED”
What the **** do they use for data in Africa , South America etc?
http://www.ncdc.noaa.gov/sotc/service/global/map-land-sfc-mntp/201512.gif
Betting that those limited data points in those African countries is highly UHI affected as well.
And that data over Russia, how real and unaffected is that, any idea ?
This will give you a feel for whats going on:
http://www.colderside.com/Colderside/HadCRUT4.html
At least HadCRUT4 doesn’t interpolate as does GISS. So in theory, GISS could take a Sahara temperature reading, and one in Death Valley, and read the Atlantic temperature over the interval as 45C (113F).
So, approximately 50% NH coverage.. 22% SH coverage in Had4
Anyone know what the approximate coverage of the satellites is ?
About 90% maybe?
NASA says The satellites, on the other hand, sweep over almost the entire globe as they take their measurements, covering about 95 percent of the Earth’s surface. Oceans and continents, forests and factories are all incorporated into the satellite figures.
Seems Marty the Troll was wrong about the surface was supposed to warm faster….
Talk about confirmation bias. Note the phrasing: “Scientists are working to understand why the lower atmosphere isn’t heating up as fast as some global warming models predict.” The implication is that somehow the atmosphere is not acting right. The much more reasonable approach would be “Scientists are working to understand why the global warming models did not correctly predict the lower atmosphere lack of heating.”
Nice catch Jason and you are correct. The thought isn’t ‘Well that kills that theory’ but ‘How can we save the theory’
The answer to why lower atmosphere is not warming as much as the earth surface is reported, seems obviously because the earth surface measurements are fudged. If all the adjustments were NOT done, then there would be no surface warming at all, and this would then agree with the lower atmosphere. But I suppose that would not support efforts to control everyone for “their own good”.
“And that data over Russia, how real and unaffected is that, any idea ?”
Russia routinely accuses western scientists of misrepresenting Russian temperature data. Just one example, of many:
http://blogs.telegraph.co.uk/news/jamesdelingpole/100020126/climategate-goes-serial-now-the-russians-confirm-that-uk-climate-scientists-manipulated-data-to-exaggerate-global-warming/
This is a bit apocryphal, but the fall of the USSR may be one reason for reported warming in Siberia. It seems that allocations of fuel oil and coal were made to remote villages based at least in part on reported temperatures. Colder villages got more fuel, warmer villages got less. Every village was under a temptation to exaggerate the cold so that they would get larger allocations. After the USSR dissolved, it was no longer advantageous to misreport temperatures and the entire region “warmed up”.
If anyone has either verification or refutation of that story, please comment.
My friend’s Russian wife says it sounds right. She doesn’t know about it specifically, but she says it perfectly matches the way they do things.
As I recall, the western U.S. was rather cool during December.
Japan, Turkey, Romania,Bulgaria, Albaina, the Ukraine and Greece are getting plastered again. South Korea’s getting hit with a severe cold wave. Moscow has already DOUBLED normal January snowfall and it snowed in Saudi Arabia.
Here in North America, a northern Ontario bridge splits due to extreme cold and has been closed indefinitely, police said.
Adjusting temp data insinuates that your predecessors were too stupid to read a thermometer.
These were the guys who landed a man on the moon with a slide rule and a pencil.
And if this is the biggest threat to mankind, why dont we have standardized weather stations being installed everywhere? Instead they are being removed. That speaks volumes. “lack of transparency is a huge advantage”
Yes, Hansen and Wirth screamed bloody murder in Congress about Global Warming in 1988. Billions of dollars later the surface stations in the USA are STILL CRAP!
Surface station data has huge error.
https://i0.wp.com/www.surfacestations.org/Figure1_USHCN_Pie.jpg
Because the data is contaminated by local heat sources.
https://i1.wp.com/www.surfacestations.org/images/OrlandCA_USHCN_Site_small.jpg
https://i2.wp.com/www.surfacestations.org/images/MarysvilleCA_USHCN_Site_small.jpg
And remember the US system is the best in the world so the rest is worse than CRAP.
Someone went looking for weather stations in Ethiopia.
http://weather.gladstonefamily.net/site/HAAB
So much information.. than is totally imprecise.
If you go down the bottom of the page, you can click on any of the “neighbouring sites”
The ones they can actually locate, are at airports. !!
Such accuracy… NOT !!!
If someone really wanted to express honestly the essence of CAGW it would be thus:
“Parts of the globe that are being progressively covered by larger and larger areas of concrete and asphalt, while being simultaneously heated by huge quantities of burning jet fuel, are becoming hotter and hotter at an accelerating rate!”
About the surface data…
Any REAL scientist should know exactly where their data is coming from.
They should know if that data is reliable or not……. But they have NO IDEA.
NOAA et al should have accurate location data, history, and pictures of every site they take data from.
It should never have been up to Anthony Watts to have to do the surface station audit in the USA.
NOAA should have had all that info on hand.. but often they have no idea where the stations actually are and what condition they are in. Its a FARCE !!!
The surface data is a MONUMENTALLY FLAWED, MEANINGLESS, WHITE ELEPHANT.
Even worse than not knowing where the data came from, is adjusting data when you don’t know where it came from. In the case of the CRU, they’ve admitted to deleting some of the original measurements. And they can’t piece the originals back together, because they’ve also admitted to deleting the original adjustment algorithms. That means the more recently published numbers are adjustments stacked on top of earlier, unknown adjustments. Once you go down that road, as they explicitly state they have, the numbers say whatever you want them to say.
Or take BEST and the ‘scalpel’ They DON’T look at the actual hard copy to see the notes that would tell them if there was a change in location or equipment. Instead they rely on a F…king computer program. Talk about LAZY!
Frank Lanser is actually getting the original data and doing the analysis and it shows what a crappy mess the ClimAstrologists have made of the task.
http://www.hidethedecline.eu/
Reblogged this on Climatism.
Why the hell is NASA GISS headed up by a clown that has absolutely NO science education whatsoever? Gavin is a math major. We already know that 1 + 1 = 2, Gavin.
GISS needed a math major to diddle the temperature record so it came out ‘right’ and always showed warming.
I think that is exactly the reason. Martin claimed that every adjustment is explained. This is simply not true of adjustments large and small. This Bill Illis post explains the small but continues changes to which no explanation have been given… http://wattsupwiththat.com/2015/03/06/can-adjustments-right-a-wrong/#comment-1877173
from link…
———————————————————————————————————————
“Here are the changes made to GISS temperatures on just one day this February. Yellow is the new temperature assumption and strikeout is the previous number. Almost every single monthly temperature record from 1880 to 1950 was adjusted down by 0.01C.
I mean every freaking month is history suddenly got 0.01C colder. What the heck changed that made the records in 1880 0.01C colder. Did the old thermometer readers screw up that bad.”
http://s2.postimg.org/eclux0yl5/GISS_Global_Adjustments_Feb_14_2015.png
“GISS’ data comes from the NCDC so the NCDC carried out the same adjustments. They have been doing this every month since about 1999. So 16 years times 12 months/year times -0.01C of adjustments each month equals -1.92C of fake adjustments.
Lots of opportunity to create a fake warming signal. In fact, by now it is clear that 1880 was so cold that all of the crops failed and all of the animals froze and all of the human race starved to death or froze to death and we went extinct. 135 years ago today.”
————————————————————————————————————————
Lower comments from Gunga Din, below Bill’s comment ( excepting of course Nick Stokes non explanation) explain exactly how anyone can verify this.
Nasa claims that 2015 was the warmest on record…..
http://www.nu.nl/wetenschap/4201085/2015-warmste-jaar-ooit-gemeten.html
According to me it is still 1998
http://www.woodfortrees.org/graph/rss/from:1980/to:2016/plot/rss/from:1998/to:2016/trend
Easily. 1998 was by far the warmest year on record.
August 1998…
https://stevengoddard.files.wordpress.com/2014/09/ch_tlt_1998_08_anom_v03_3-1.png
August 2014
https://stevengoddard.files.wordpress.com/2014/09/ch_tlt_2014_08_anom_v03_3-3.png
We have had three large El Niño’s in the record since 1997. They are 1998, 2010, 2015-16. They more then balance out, and it will take another strong La Niña to balance out natural conditions. actually, a strong La Nina plus a negative AMO and PDO would balance out 1998. I think that by the time this happens (and I think it will) we will have had 22 to 25 years of cooling since 1997.
Tony, perhaps you would consider doing annual RSS plots for 1998 vs 2015?
I think that by the time this happens (and I think it will) we will have had 22 to 25 years of cooling since 1997.
Henry says
this is indeed exactly what i had calculated from my own results……
NASA is a very useful organization. I think Muslim outreach is very important.
https://www.judicialwatch.org/blog/2010/02/nasa-focus-muslim-outreach/
Question: RSS vs GISS shows a widening discrepancy. How much of that discrepancy can be accounted for by ‘adjustments’ to the raw data? And can that be quantified? Where is the raw temperature data and wouldn’t it be nice to be able to generate that same plot on WoodforTrees. My guess is that the discrepancy would disappear and the surface data would show the same lack of warming for the last two decades.
minarchist,
Do a bit more reading here. ‘Adjustments’ are a main topic of conversation.
https://stevengoddard.wordpress.com/data-tampering-at-ushcngiss/
I visit this site every day. USHCN is just US. I am trying to understand what is being done by NASA GISS worldwide in aggregate.
I am afraid it is sort of scattered since different people are working on different pieces. Not surprizing since it is all volunteer and the ClimAstrologists are going to stonewall.
The Original Temperature Project:
http://hidethedecline.eu/pages/posts/the-atmospheres-ability-to-accumulate-co2-declined-since-1978-241.php
The Air Vent
https://noconsensus.wordpress.com/111-2/
Not A Lot of People Know That: ‘Global Temperature Updates’
https://notalotofpeopleknowthat.wordpress.com/category/global-temperature-updates/
E.M. Smith
https://chiefio.wordpress.com/2010/01/08/ghcn-gistemp-interactions-the-bolivia-effect/
Verity
https://diggingintheclay.wordpress.com/2010/02/25/of-missing-temperatures-and-filled-in-data-part-1/
https://diggingintheclay.wordpress.com/2010/03/02/of-missing-temperatures-and-filled-in-data-part-2/
And of course JoNova’s
and ClimateAudit (Steve McIntyre)
If this character, Gavin Schmidt, has a leftist agenda.
Gavin S makes money out of “global” warming
I make no money from telling you there is no longer any global warming,
if you look at it on the long (average) term
https://i0.wp.com/oi62.tinypic.com/33kd6k2.jpg
mind you, people having to shove snow late in spring will soon begin to doubt the3 dat that earth is “still” warming…..
mind you, I think people having to shove snow late in spring will soon begin to doubt the data pointing to the illusion that earth is “still” warming…
this comment from Gail is interesting.
https://stevengoddard.wordpress.com/2016/01/19/endless-stupidity-at-the-new-york-times/#comment-568630
wish Gavin Schmidt would read it.
Snow reflects deflects sunlight off from the earth setting us up for the ice age trap….
this an e-mail from the 350 people
\
Dear friend,
It’s official: this week NASA confirmed that 2015 was the hottest year ever recorded. And it’s not just warmer weather that people have been feeling. The impacts of a climate being cooked by a reckless fossil fuel industry are being felt right around the world. From devastating flooding to seemingly endless drought, the message each disaster sends is clear — the time for procrastination is long gone, and the need for action has never been more urgent.
With a global climate deal in Paris done, the world has a choice: This could be a time we look back on as the moment the curtain came down on the fossil fuel age, and we began to build the 100% clean energy future that we need. Or it could be the aftermath of another failed global agreement — a missed opportunity, sabotaged by the fossil fuel industry and their political allies.
To make sure that the Paris deal results in real climate action, people are beginning to organise a historic wave of nonviolent actions around the world in May of this year. This wave of actions is called Break Free from Fossil Fuels, and it’s how the people are going to make sure that this moment is remembered as a turning point.
Actions are being planned at locations in 12 countries, and plans are coming together quickly — click here to be a part of it from the very beginning.
The Paris agreement leaves a lot of work to be done: the timeline for action is far too long, and there is no plan for how countries will reduce their emissions at the scale and rate necessary. There is a gap between the target that governments have set themselves and what their commitments will lead to. It is up to us to do the work that will close that gap.
There is no way to reach the 1.5 degree target that governments aspire to while continuing to dig coal, oil and gas out of the ground. But governments around the world are still continuing to approve new fossil fuel projects, which will commit us to years more warming.
Break Free from Fossil Fuels is different from anything we’ve been a part of before: dozens of major actions around the globe, non-violently escalating the fight against the worst fossil fuel projects on earth, coordinated to show that we are united against the fossil fuel industry’s power.
We’ve marched, we’ve signed petitions, and we’ve demonstrated for climate action. But this is the critical moment, and climate action is even more urgent than ever before. That’s why in May 2016 we will be joining with partners around the world to take things to the next level. We will directly confront those who are responsible for climate change, put our bodies in the way of business as usual, and take bold action in support of a 100% renewable energy future.
It’s up to us to close the gap between rhetoric and reality.
We’re ready. Are you? Click here to find out more and sign up to be a part of this historic moment.
Onward,
Will on behalf of the Break Free coordinating team
“We, the cattle ranchers of Oregon stand shoulder to shoulder with our friends in 350. As people who work with, and in, the beautiful world of Nature on a daily basis, we feel that of all groups, our understanding of the importance of conservation and protection of the environment is second to none. In pursuit of those ideas we have decided to undertake a non-violent occupation of buildings situated on the Malheur National Wildlife Refuge. We realize that our actions may be misunderstood or misrepresented by supporters of the fossil fuel industry and their shills, but we are willing to risk our life, our property and our sacred honor in pursuit not merely of CO2 containment, but to protect our lovely Mother Earth and all the life which lives upon it. Onward to more environment now!”
As a press release it still needs a little work, but I think it would be interesting to see how the 350 crowd would respond to such news… 🙂
I am sure George Soros and his Open Society Foundations are busy right now organizing naive high school and college students to be bussed to the protests. As we saw with other Astroturf ‘protests’ like Occupy and the September 2014 People’s Climate Justice March it was all about free transpo to the big party. Most hadn’t a clue about what they were protesting when asked.
Back in 1984/5 when I was looking for a job, the Boston Globe had ads for paid nuclear protesters — $10/hour to protest Seabrook Nuclear Plant. Back then a Lab tech in that area got ~$5/hr and as a degreed Chemist/QC engineer I got $9.50 an hour.
ASTROTURF!
https://www.youtube.com/watch?v=R46X3J7ZFuk
The knowledge of students at the US #1 University.
https://www.youtube.com/watch?v=BUybMMYmpxo
‘Paid volunteers’ for the NYC climate march
‘The People’s Climate March’ – just another corporate multi-million-dollar fundraiser by 350.org and Avaaz
From Counterpunch, WEEKEND EDITION SEPTEMBER 19-21, 2014, How the People’s Climate March Became a Corporate PR Campaign—Business as Usual in Manhattan
http://blog.heartland.org/2014/09/alex-epstein-loves-fossil-fuels-mixing-it-up-with-climate-marchers-in-nyc/