
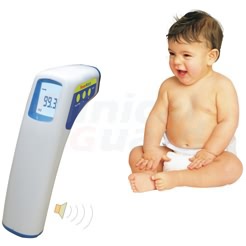
Modern doctors, modern astronomers and modern climate scientists use modern technology. They measure temperatures remotely by monitoring electromagnetic radiation. This is done by UAH and RSS.
Government climate scientists at NOAA and NASA prefer ancient technology
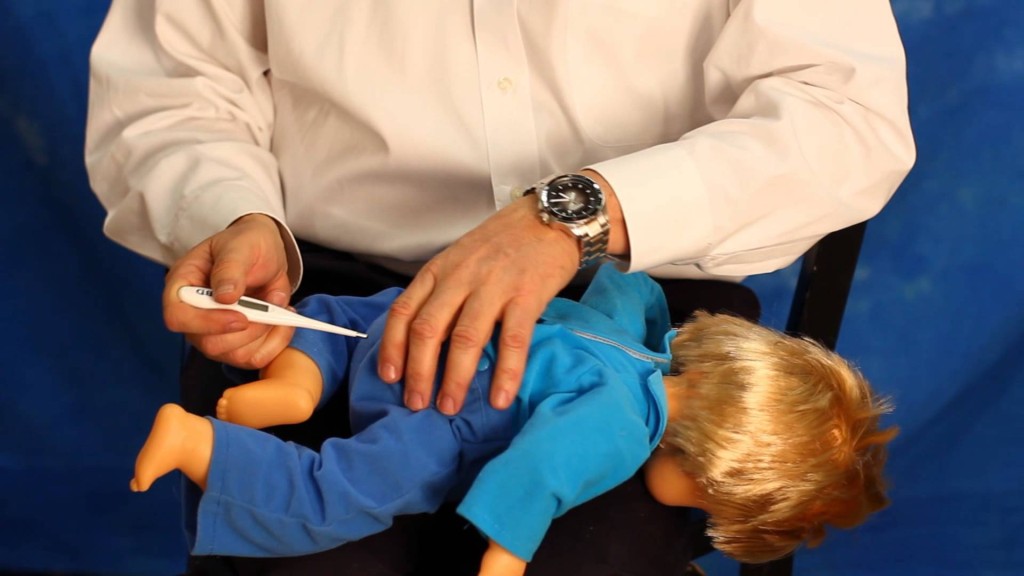
And then they simply make up almost half of the data.
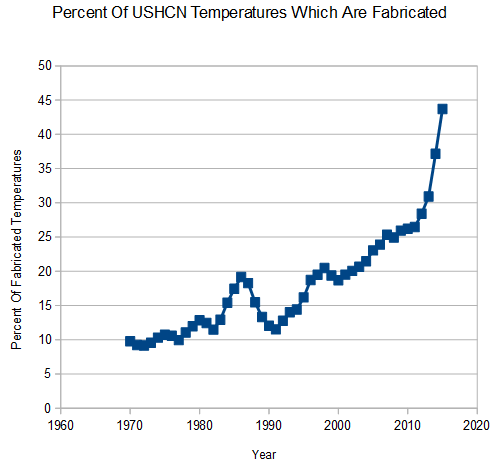
The entire global warming scam depends on NASA and NOAA’s garbage data.

Ouch, Steven, you have been duped again. Here is why:
UAH TLT Series Not Trustworthy
http://rabett.blogspot.no/2015/12/uah-tlt-series-not-trustworthy.html
Martin believes that satellites and balloons are lying, but massively tampered and imaginary surface temperatures are telling the truth.
“He is also arguing against a data set which I did not reference.”
🙂
But you aren’t in this discussion, Jason, so whatever you referenced is not relevant.
“Shut up,” he argued. 😀
“But you aren’t in this discussion, Jason”
Martin proclaims, “I AM MASTER OF THE INTERWBS! I CONTROL WHO SPEAKS AND WHO IS HEARD! SO IT IS WRITTEN, SO SHALL IT BE!!”
Besides… I didn’t say anything.
🙂
Steven, you just told a fib. I don’t believe the satellites are lying. I believe what Richard Eric Swanson wrote. Others can read it and decide for themselves. Regarding your remarks about “massively tampered and imaginary surface temperatures,” the satellite data you claim are more accurate are, in fact, “massively tampered and imaginary surface temperatures.” You continue to ignore that fact.
Do you see any UAH data in my post? Your straw man arguments are endless.
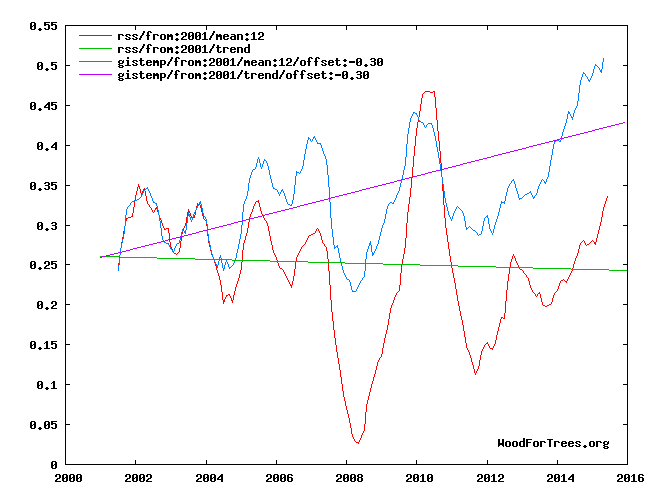
ok! I guess you are admitting the UAH data can’t be trusted. They do diverge from the RSS data. But the RSS data, as well as the UAH data, are for the troposphere, not the surface, so, your comparison with datasets recording increases in surface temperature would qualify as fraud, yes?
To record surface temperature at location X, you don’t need to send up a balloon.
[SG : Stop spamming. I am sick of your bullshit]
You didn’t address this, however: The problem with your cherished RSS data is exactly the same as what you are complaining about with the thermometer data. First,
“Twelve years ago, my curiosity led me to perform an analysis of the UAH TLT data, the results of which I published in a peer reviewed journal in 2003 (5). I found an apparent discrepancy at high latitudes of the Southern Hemisphere, which I suggested might be due to the effects of sea-ice. After my report, the group at Remote Sensing Systems (RSS) decided to exclude any coverage to the south of latitude 70S from their version of the TLT, their reasoning being that the high elevations over the Antarctic was distorting the measurements. RSS also excludes data from other regions with high elevations, such as the Andes and the Himalayas. ”
And, again, the RSS data in addition to the problem exposed in the quote above, is also “massively tampered.” You always ignore these facts when you claim the thermometers are wrong and the satellites (which don’t even measure temperature) are right.
Amazing how Marty clings to the UNTrustworthy surface station data that has huge amount of data made up out of thin air.
https://stevengoddard.files.wordpress.com/2015/01/ncdcafricafaking2.gif
https://i0.wp.com/infobeautiful2.s3.amazonaws.com/true_size_of_africa.png
(black diamond is stations used.)
1975 far north ground stations with over 600 individual temperature series and more than 540 combined series with records of more than 20 years.
https://diggingintheclay.files.wordpress.com/2010/04/canadastations1975.png
Dropped to less than 30 locations reporting stations by 2009
https://diggingintheclay.files.wordpress.com/2010/04/canada-bypopulation.png
Getting rid of stations, especially rural norther stations allows wholesale data tempering.
https://diggingintheclay.files.wordpress.com/2010/04/canadadt.png
“You always ignore these facts when you claim the thermometers are wrong and the satellites (which don’t even measure temperature) are right.”
Please explain for all of us exactly how thermometers measure temperature and satellites don’t. Be specific. (This should be good.)
.S, the trophspere is supposed to (accodiv to CAGW theory) warm at 1.2 times the rate of the surface.
There is also a lot more uncertainty in all the global temperature data sets than most sources acknowledge. I suspect the accuracy for significant confidence is on the order of plus or minus 0.3C to 0.5C in recent years and much larger the farther back you go. Thus any recent decadal or longer trend must be larger than this amount to possibly be significant. And trends using data back into the 1800’s probably need to exceed 1.0C to be significant because of huge uncertainties in the oldest data.
Even the NASA and NOAA data only show a rise of 0.2C this century which is in the noise range of the uncertainty and therefore meaningless. Their evident tampering is simply increasing the uncertainty and decreasing the accuracy of their estimates.
No, you don’t get the way modern preconeptual science works. They adjust the 100 year old measurements by 2C, then claim +-0.1C precision, since they’ve already fixed all the errors. The fact that the actual measurements lie well outside both the original margin of error, and the new one, is accepted as proof that the adjustments were correct, because the data now matches the conclusion. Since cartoonists are seen by some as the most reliable sources of scientific knowledge, I’ve found you a proper explanation, in cartoon form:
http://www.theskepticalreview.com/images/preconceptual.gif
Ted, yes I’ve noticed that Marty, Larry, and GJD are expert preconceptual scientists and their remarks here bolster that impression. Preconceptual climate science is now even peer reviewed, since all the reviewers are also preconceptual scientists it seems (and they can’t afford not to be unless they want to lose their job and/or contracts).
Wholly Shit.. I just can’t stop laughing.. great imagery Mr Goddard..!!
The Anal Thermometer perfectly depicts what Hoaxers are doing to us, all of us..
Thanks for the great laugh today, needed it..
Amazing how Marty clings to the UNTrustworthy surface station data that has huge error.
http://www.surfacestations.org/Figure1_USHCN_Pie.jpg
http://www.surfacestations.org/images/OrlandCA_USHCN_Site_small.jpg
http://www.surfacestations.org/images/MarysvilleCA_USHCN_Site_small.jpg
And what about RSS?
Doesn’t measure temps. Untrustworthy, says Mears. We don’t live in TLT, so dismissed. Where as there has never been anything as precise as GISS LOTI. Tuned, and retuned every year to match the best models.
Look, you need to be selective to retain one’s views unscathed.
Something is melting lots of ice at the moment. Are we entering a REVERSE-LIA due to extra CO2?
Only a complete moron would believe that ice is melting at -30C
Icebergs melt, otherwise they would pile up and stop all marine traffic!
Little kid. Your dad is going to get real pissed when he finds out you’ve been posting from his computer.
Tell me CommonFuture Fool, How much of those icebergs you are so concerned with is under water?
You still haven’t answered that very simple question.
Why do ice cubes disappear in a frost free freezer? Answer: Sublimation.
http://water.usgs.gov/edu/watercyclesublimation.html
Present Arctic Temperature. For the clueless who can not read kelvin the blue line id freezing.
http://ocean.dmi.dk/arctic/plots/meanTarchive/meanT_2016.png
Increased calving is a major cause of ice sheet mass-loss. It’s safe to assume that all of the calved ice-bergs will melt.
Calving is a sign of glacier growth, if they (glaciers) don’t move forward bits don’t fall off them when they poke out past the edge of the land.
SNOWBALL EARTH!!!!
http://i.space.com/images/i/000/032/063/i02/snowball-earth-mit.jpg
http://thumbs.dreamstime.com/x/hopeless-woman-expressing-fear-what-terror-close-up-frustrated-young-beaten-girl-holding-her-hands-mouth-61622184.jpg
You really are a
https://babell1013.files.wordpress.com/2014/05/donkey-female-rear.jpg
Here is a plot of the changes GISS made to their data between December 2014 and September 2015:
http://oi64.tinypic.com/2eokwub.jpg
Science advances all the time. We know a lot more today about measuring temperatures in the 1880s than we did last year. We found that the way thermometers were read in 1882 was very different from the way they were read in 1885, causing us to adjust the data by almost 0.3C, relative to each other. Without this ever increasing knowledge, we could never maintain the advertised 0.01C accuracy.
Hey Ted! You know, I understand that most CAGW enthusiasts really do not know very much about the official “adjustments” and have that ignorance as a mitigation of their ethical responsibility in spreading falsehood and fright — but what about the alarmists who actually visit sceptic sites and read comments like yours? How on earth can an alarmist be aware of things like the 1882 – 1885 difference you mentioned and, not reconsider their support for such travesties?
I truly do not get it… Willful blindness may be a description, but it sure is not an explanation. What drives such folk?
What drives such folk?
Loyalty to the CAUSE™!
They have high hopes that they will be in the Master Class once the UN Totalitarians gain control.
Unfortunately they have not bothered to read history. The usual reward is a bullet to the back of the head. “Willi” Münzenberg, a leading propagandist for Stalin, and responsible for formulating the Soviet Propaganda that is now called Political Correctness knew this. When he was recalled to the Soviet Union he ran instead. French hunters discovered Münzenberg’s partially decomposed corpse at the foot of an oak tree. Sources state that the cause of death was a garrote.
The Soviet Intelligentsia also found this out the hard way. link
“Insanity: doing the same thing over and over again and expecting different results.” – Albert Einstein
By that definition the rank and file socialists are insane since ‘socialism’ has been failing for a thousand years or more.
Jason-
I assume Martin and cfgjd both nodded their heads in agreement with my comment above. A ridiculous explanation like that makes perfect sense to them. Martin convinced me that their concept of logic is so far removed from ours that there’s no possibility of useful dialogue. What we see as sarcasm, they see as logic, and the other way around. I believe that our concept of logic is more proper. Unfortunately, they also believe theirs is more proper. Unless one side (or both) compromises on their basic human nature, which I doubt is even possible, there can be no reconciliation. Even worse, this problem is wide spread, throughout every aspect of society. We’re drifting toward very dark times, when one side will try to “fix” the problem by exterminating the other. Sadly, that appears to be the natural cycle of humanity, repeated too many times to list.
Never let your blood boil before checking the sarcasm multiplier.
Unlike humans plants don’t lie. Here is what the plants say for the decades during the 20th century in the USA. (bottom graph.)
Movement of the Koppen Boundary
http://www.sturmsoft.com/climate/suckling_mitchell_2000_fig2_3.gif
NOAA has taken this cyclical record and squashed and twisted it into a somewhat straight line to match the Mauna Loa CO2 data. They did this by carefully using adjustments that match the Mauna Loa CO2 data.
An R^2 = 1 is a perfect correlation and this plot of CO2 vs adjustment over time is pretty darn close to perfect!
https://stevengoddard.files.wordpress.com/2014/10/screenhunter_3233-oct-01-22-59.gif
The adjustment to match CO2 looks just like Mikey Mann’s Hokey Schtick. WHAT A COINCIDENCE… NOT!
https://stevengoddard.files.wordpress.com/2014/10/screenhunter_3232-oct-01-22-58.gif
Martin, a nice hockey stick, right?
The temperature data from UAH and the RSS data sets, and that from weather balloon Radiosondes, all agree closely. But morons believe they are all wrong and the very limited coverage of surface temperature stations are the only truly accurate temperatures taken.
https://www.youtube.com/watch?v=NzlG28B-R8Y
the problem with surface stations is that, except my own, there there is no data set that is properly balanced,
meaning:
equal stations NH and SH balanced to zero latitude
equal stations east and west, balanced to zero longitude (there is a way around this problem)
70/30 stations @sea and inland
all continents included
Most surface stations data sets are biased towards NH, giving us the false indication that it is warming. The truth is that, according to my measurements, earth is in fact cooling.
It seems only RSS is giving us a reasonable indication of what is happening, and it must be because the satellite data are properly balanced,
even though they do not cover the whole of earth.
let me re-phrase that
It seems only RSS is giving us a reasonable indication of what is happening, and it must be because the satellite data are [more] properly balanced,
even though they do not cover the whole of earth.
Grounding line retreat increases calving and ice-loss through acceleration of the ice-stream.
huhhh?
say what, why, who are you talking to?
Henry, CommonFuture Fool gjd is talking to himself. The rest of us are laughing at his simple minded propaganda tricks designed to further acceptance of UN totalitarian rule.
is this http://www.commonfuture-paris2015.org/
his website?
gjd is a typo. It is CF git. One of the CommonFuture gits.
https://coloradowellington.files.wordpress.com/2016/01/people-against-imperialist-running-dogs.png
Henry, it is not his per say, it is where he gets his information from. That is why he never posts links except he slipped and did so once.
cfgsdjueyerye
Do you not understand that temperatures all around the Arctic were just as high in the 1930’s and 40’s as the last few years?
Or that they were higher in the MWP (check out 1000 yr old forests reappearing from under retreating glaciers in Alaska)
You are like a little kid who has just worked out it is warmer in June than in January!
could not have said it better….+1
but … but …
it was the warmest Festivus EVER!
my Festivus Pole is really cold right now … I mean before that
i am guessing
you mean Vesuvius?
A good illustration but rectal temperatures are closer to core body temperatures and therefore like satellite measurements, i.e, reflective of ‘true’ temperatures whereas forehead readings are more likely to be affected by ambient conditions. The instrument grades in the example above are however appropriate. The handheld ones with the tiny digital readout are not accurate.