
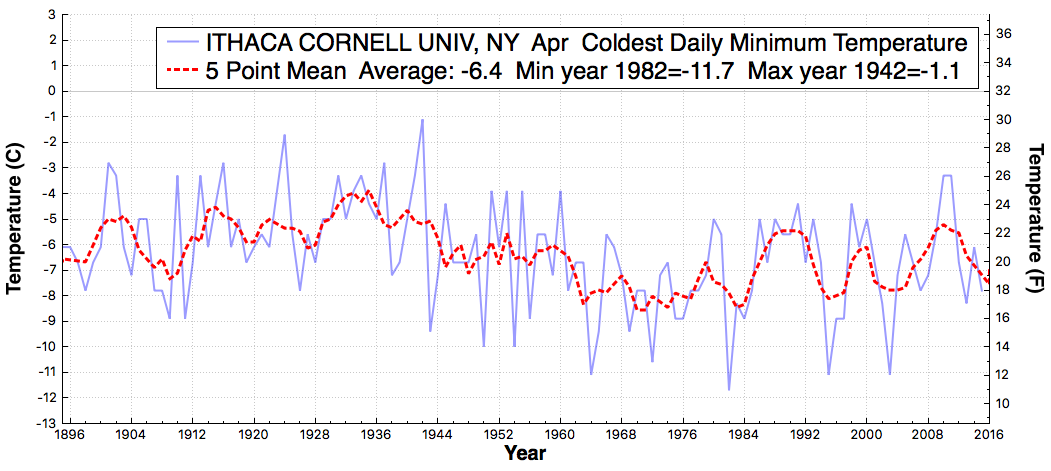
My life began in Ithaca, New York, though Hillary Clinton says I didn’t have any rights until nine months later. Ithaca’s coldest April temperature on record was 11F in 1982.
They obliterated that record this morning, during the hottest year ever.
My life began in Ithaca, New York, though Hillary Clinton says I didn’t have any rights until nine months later. Ithaca’s coldest April temperature on record was 11F in 1982.
They obliterated that record this morning, during the hottest year ever.

Thanks, Steven, for having the courage to speak frankly about deception disguised as “consensus science.”
This is, in my opinion, confirmation that the US National Academy of Sciences has control of US policy through annual review of the budgets of federal research agencies, exactly as Eisenhower warned might happen in his farewell address to the nation on 17 JAN 1961
https://m.youtube.com/watch?v=GOLld5PR4ts
https://www.youtube.com/watch?v=anwy2MPT5RE
Brilliant!
We had 9 here in Saratoga, previous record for this date was 12 in 1972 during the 70’s cooling that never happened.
Guys, get it right, low temperatures are weather, high temperatures are climate.
Got it? Good! Now I won’t have to endure any more silly posts.
I’m sure 97% of climate scientists would agree.
That’s right. Sunday in southeast Wisconsin stared out at 29, that was weather,rose to 70 around 2 pm, that was climate change, and dropped back down to 30s that night, back to weather
It’s always the same. For someone that started following this stuff a few years ago the amount of junk science hyping any recent calamity as the result of human caused climate change is just mind boggling. Really the only way to figure out who to listen to is getting to know the players. One wouldn’t know that the US as a whole has actually had pretty good weather compared to many times in the past. One wouldn’t know that Atlantic hurricane incidence is way down and we set a new record for the number of years the US has gone without a hit by a Major hurricane. One wouldn’t know that despite our ever increasing ability to “see” and identify more tornadoes because of ever improving radar technology and expanding coverage that the tornado count for the last 4 years has been well below average. The beat goes on as AGW moves from one place to another following wherever there happens to be a weather calamity or disaster or even just relatively unusual weather that is occurring at a given time. And when there isn’t anything that will get them headlines in the weather then we get the recycled news about melting ice or raising sea level rate that is going to come and kill us all. I swear the alarmists are no different than my dog barking at blowing leaves when one of the neighbors cats aren’t around to get wound up about.
That’s exactly what I tell people these days.
The “Hottest year ever” theme is gonna be tough to maintain without some hottest day-of-month temperature records.
Post “adjustment”, it’s certain that the “climatologists” will massage and tweak the averages in one direction only. The direction that guarantees more grant cash from DC.
The value of the “adjusted” temperature data records is rapidly approaching the value of an Obama promise. i.e. Eventually those “adjusted” temperature records won’t even be worth an Obama promise.
Worcester, MA had a HIGH temperature of 22 yesterday and broke their record by a wide margin. Worcester has also already had 10.0″ of snow so far this April (from 2 snowstorms) while Boston has had 6.6″.
An even colder and more widespread Arctic outbreak scheduled for this weekend. Could even snow down to DC, with widespread killing frosts, even in the Deep South. Looks like very large losses for many fruit trees, even worse than the freeze in 2007.
Of course, all totally consistent with catastrophic warming (right!).
Hello Steve. Where can one find a link to the application that plots the temperature graphs you often post depicting historical temp data for an individual weather station location? Thanks. 🙂
https://stevengoddard.wordpress.com/2016/03/27/pulling-back-the-curtain-version-1-6/
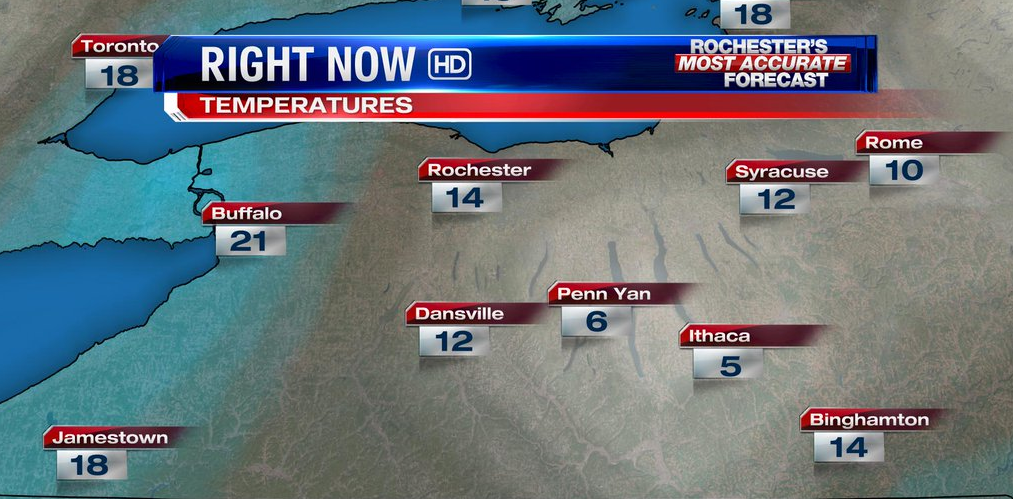
NOAA is showing Ithaca at -1F now fro April 5 2016
Thank you. Best Wishes for Continued Success.
Despite the cooler than normal temps here in central Indiana it has not stopped my grilling season from starting now that the winds have finally settled down some. During the warmer months I do a lot of grilling. Friday had my girls over for shish kabobs. Sirloin, red onion, portabella mushrooms, green peppers, cherry tomatoes. Today (Tuesday) simple ground sirloin cheeseburgers. Things take a little longer in the cooler weather and much longer when it’s really cold. My IR grill seems to work better than my old standard grill did in this kind of weather.
I have dozens of Tulips, hundreds of daffodils, a dozen different colors of crocuses, all gloriously blooming, my Mirabelle plum tree is blossoming for the first time in five years My peach tree has huge pink and maroon blossoms, my ?Queen Ann s Cherry is fully blossoming for the first time EVER? ?
And it is?SNOWING F____ING SIDEWAYS!!!!!
Winds out of the NW at 40-50 mph, gusts to 60 mph, near white-out blizzard conditions. Temp has dropped from 47 to 32, just while we ate dinner . Now they?have dropped the weather forecasted-low temp for tonight, from saying 29 yesterday, to 27 this morning, to now they are saying 25 degrees .?
UPDATE: The day after… the blossoms and buds are all blown away or brown, there will be no honey or pollen for the bees, and no plums or cherries for Frank 🙁
Repeat after me: Warming is GOOD!!! Freezing SUCKS!!! Freezing KILLS!!!
Warming (and CO2) gives LIFE!
Where are you?
Southern Ohio, BELOW the Mason Dixon Line….
Glad the next storm is hitting the east on Friday and Saturday because if it was hitting on a weekday odds are I would be heading for it.
In Norfolk County, Ontario the record of -10C held since 1881 was shatterd with -12C on the morning of April 5, 2016.
These are like snowflakes that individually are not convincing, but when you gather enough of them together, you can get an avalanche. So which snowflake is the most convincing? Not any of them mean that much by themselves. But there are just so many such snowflakes! It takes a special kind of willful ignorance to ignore the whole bunch.
I have good data from Ithaca from 1982.
The trend over the past 3 decades there is as follows:
Maxima: + 0.13K/ decade
Means: -0.33K/decade
Minima: -0.26K/decade
So, we can see that average temperature in Ithaca has already dropped one whole degree K since 1982…
Now I note from my results of Kennedy airport, that minima there have also been dropping, namely at -0.15K/decade since 1982.
Now, I am intrigued as to know why this is happening. Clearly, in Ithaca, it is not maxima pushing the means down. It looks like minima are leading downwards, pushing down the average temperature.
That would suggest deforestation at a considerable scale in that area.
tell me if I am wrong?
Can you share your data? It can be compared to the official records.
Ithaca U station is missing a lot of data for 1995.
I have stopped giving sources of data to people
unless I trust them
average for 1999 for Ithaca
means: 10.9
maxima: 15.2 (AVERAGE OF 365 DAYS)
minima: 5.3 (AVERAGE OF 365 DAYS)
in DegreesC or K
sorry, you asked for 1995
average for 1995 for Ithaca
means: 9.7
maxima: 14.2 (AVERAGE OF 365 DAYS)
minima: 4.4 (AVERAGE OF 365 DAYS)
in DegreesC or K
That should be, “the data Pulling back the curtain uses is missing data”. It shows up using NOAA
http://w2.weather.gov/climate/xmacis.php?wfo=bgm
That would suggest deforestation at a considerable scale in Ithaca,
tell me if I am wrong?
nobody knows?
Wednesday afternoon I was called at 16:15 for a load of 42,000 lb. of Nestles product in a 53′ refer trailer bound for the WalMart Distribution Center (DC) in Johnstown, NY that had supposed to have departed at 15:00. After driving all night I stopped at the Oneida service area off I-90 near Westmoreland, NY just 58 miles from the place I was to deliver. Temps were cool but not cold and road conditions excellent. Delivery was scheduled for 18:30 Thursday.
I arrived at the DC at 17:45 and went through their routine. Backing in the assigned door #119, chalking the trailer tires on one side, unhooking and pulling the tractor from under the trailer. It was 22:30 when they called me to come in a pay their $50.00 lumper fee and get the signed bills and hook up and leave. Temp was in the 40s and it wasn’t bad at all.
The pick up of my back haul was at a freezer warehouse in Scranton, PA so I drove NY 33A down to it’s junction to I-88 and took that down to the junction with I-81. Stopped at the PA welcome center and took my 10 hour break. Cold and when I departed the Welcome center the first flakes of snow were coming down but it didn’t last.
I arrived at the warehouse at 12:15 but was not loaded with the 38,000 lb + of Italian ice and frozen pretzels bound for three different locations in Indiana until 22:40.
Started getting into snow that stuck about half way across PA on I-80 and by he time I reached the junction with I-76 in Ohio it was really coming down with a 30 mph wind out of the NW gusting to 40 or so at times. By the time I was west of Akron on I-76 conditions were blizzard like. Visibility very poor at times. Once I hit I-71 going south the temp was 24 deg F and it was still coming down hard and blowing. At times I was at 35 mph with my flashers on. Now heavily loaded big trucks do pretty well in the snow in every way except of course stopping. The driver really has to be on his or hers toes and just ease the rig down the steeper hills because you get to much momentum your just not going to in control. I-71is three lanes along that stretch of road but most of the time only the tire tracks were usable and one had to pick their spot to pass other vehicles.
I made the decision to get off on US 30 at Mansfield, OH instead of taking I-71 down to Columbus, OH to catch I-70. It was a good decision. Once I got out of Mansfield heading west conditions gradually improved and after stopping and fueling both the truck and the refer unit at Upper Sandusky it was full daylight and the road conditions were good enough I could hammer down and go 68 mph. So I did the 638 miles from the warehouse on the north side of Scranton, PA to the yard on the south side of Anderson, IN in 11 hours and 4 minutes driving time. Not bad considering about 100 miles of that was hard winter driving. A couple of white knuckle seconds when the wind started pushing me on slick spots but all in all not a bad trip considering the first three numbers of the refer trailer I was pulling were 666.