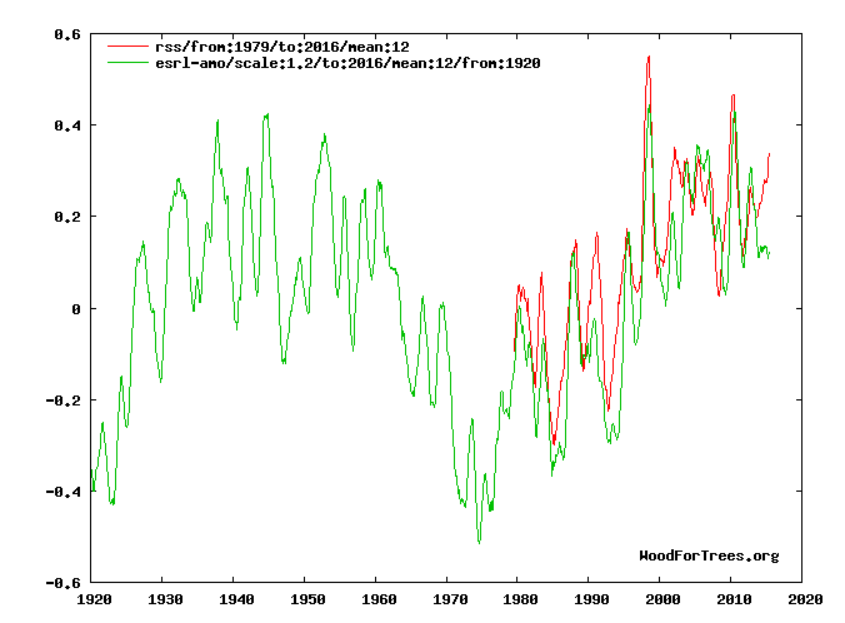
In my previous post, I showed how the AMO (Atlantic Multidecadal Oscillation) correlates with global temperatures.
Wood for Trees: Interactive Graphs
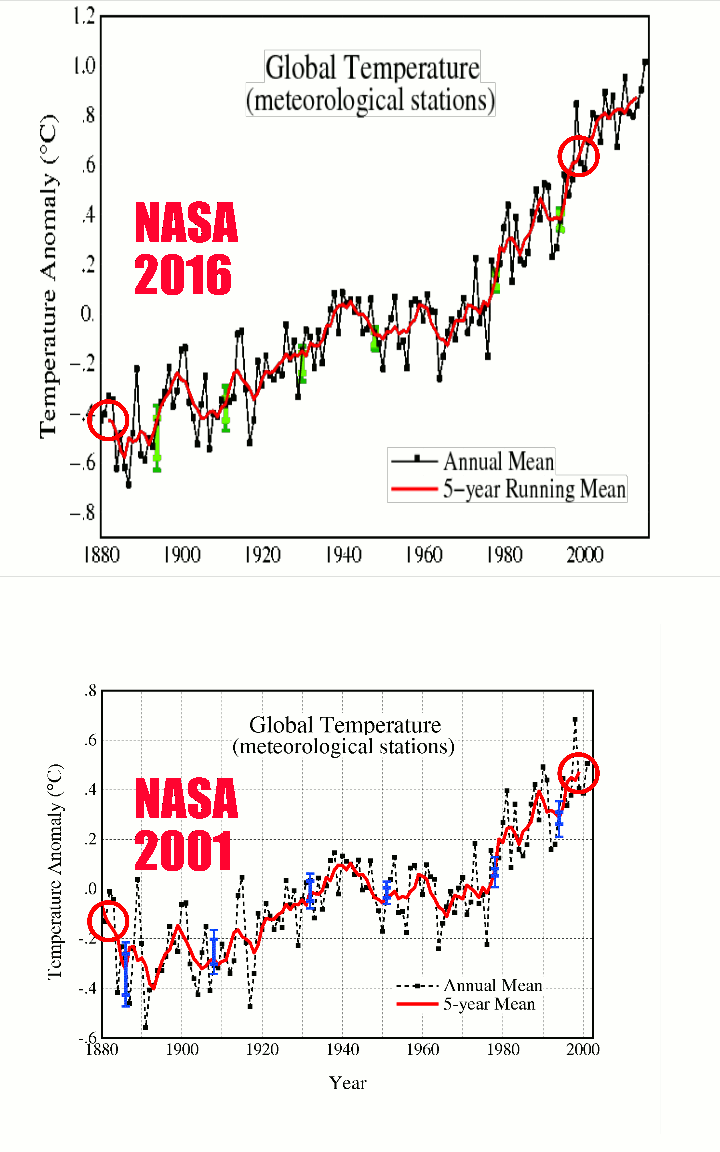
Satellite temperatures only go back to 1979. It would be nice to make correlations going back further, but the fraudsters at NASA are constantly tampering with the surface temperature record and have turned it into an meaningless political document.
2001 version : Fig.A.ps current version: Fig.A.gif
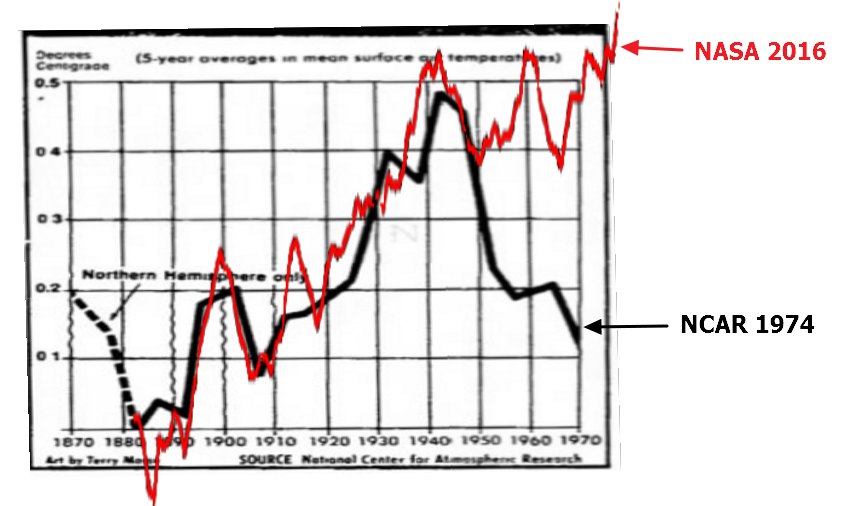
NASA has completely erased the 1940-1970 global cooling, which was reported by NCAR and the National Academy of Sciences at the time, and was very well documented.
Hiding The Decline Smoking Gun | Real Science
Briffa’s trees also showed the 1940-1970’s cooling, before the climategate team hid the decline.
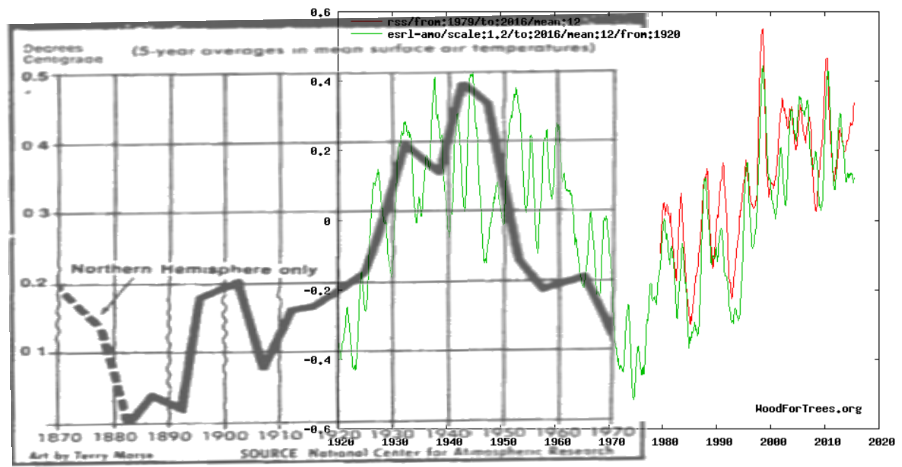
NASA temperatures are garbage, but what we can do is use the 1974 NCAR graph for the period prior to 1970. Then it becomes clear that the 1940’s were just as warm as the recent peak around ten years ago, and that there has been no warming for the past 85 years.
The AMO is current dropping, and it seems likely that we are headed into another long cooling period.


