
NCDC shows the US warming at 0.14F per decade.
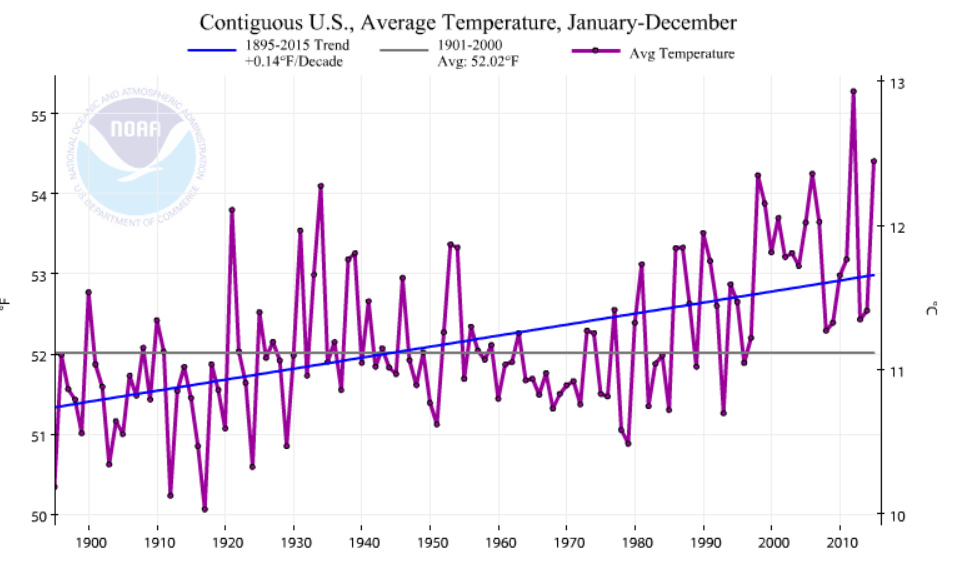
Climate at a Glance | National Centers for Environmental Information (NCEI)
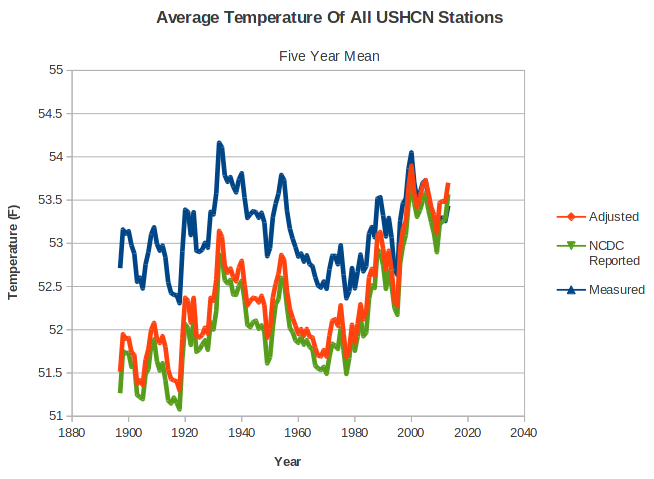
This is just what climate scientists expect. However, it is not what NCDC’s temperature database actually shows. NCDC gets their US temperatures from the USHCN temperature records, which show no warming for 90 years as seen in the blue line below. The red line shows the average adjusted temperature, and the green line shows the five year mean of the NCDC graph above, which is slightly different due to gridding.
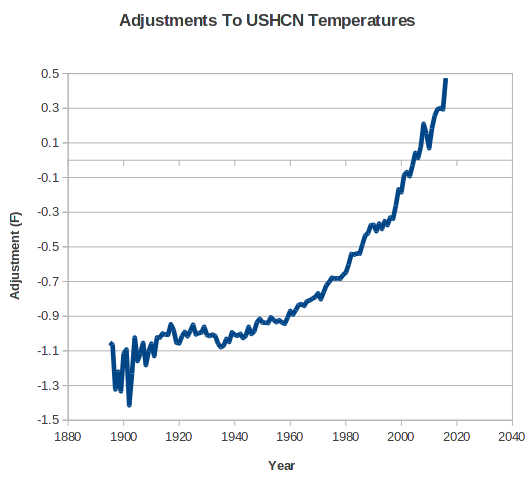
The adjustments being made to the data are massive, as seen in the graph below. All reported warming since 1920 is due to adjustments.
If NCDC doesn’t have data for a particular station, they simply make it up. Almost half of their data is now fake, which allows them to generate any shaped graph they want. So they generate a fake temperature record which is exactly what the scientists expect.
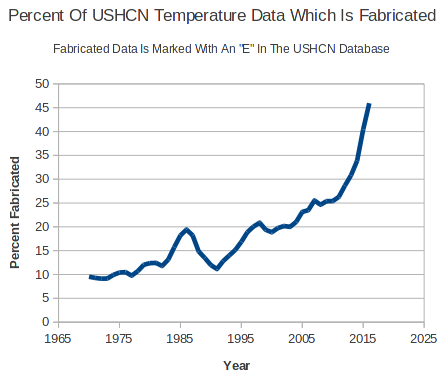
Climate scientists in turn feed this garbage data in to their climate models and produce garbage in/garbage out science.
