Climate Central just ran this piece, which the Washington Post picked up on. They claimed the US was “overwhelmingly hot” in 2016, and temperatures have risen 1,5°F since the 19th century.
The U.S. Has Been Overwhelmingly Hot This Year | Climate Central
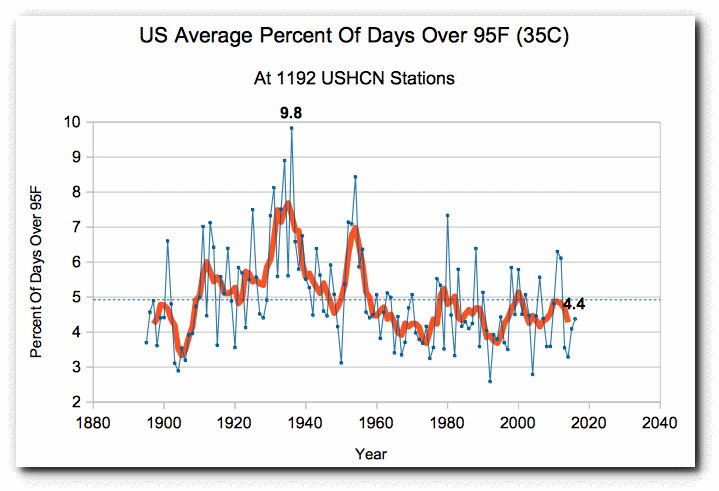
The first problem with their analysis is that the US had very little hot weather in 2016. The percentage of hot days was below average, and ranked 80th since 1895. Only 4.4% of days were over 95°F, compared with the long term average of 4.9%. Climate Central is conflating mild temperatures with hot ones.
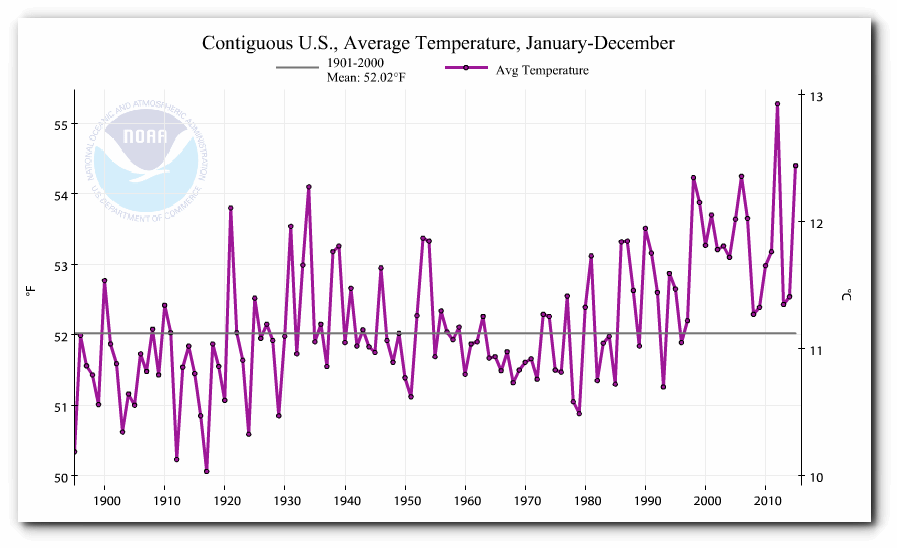
They also claim US temperatures rose 1.5°F since the 19th century, which is what NOAA shows.
Climate at a Glance | National Centers for Environmental Information (NCEI)
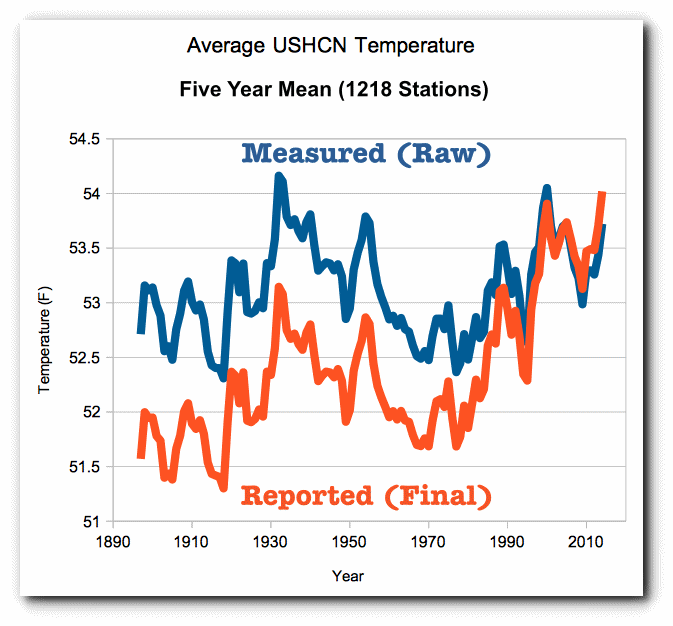
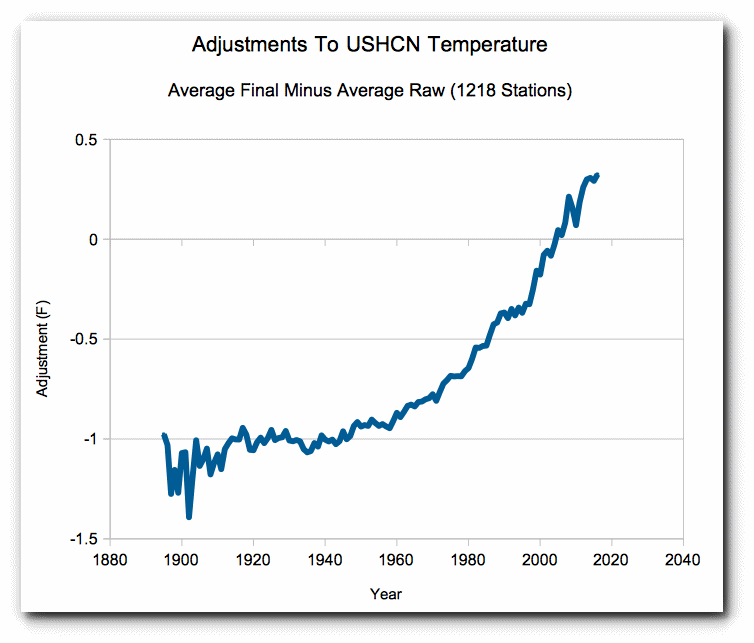
The problem with the NOAA graph is that it is fake data. NOAA creates the warming trend by altering the data. The NOAA raw data shows no warming over the past century
The adjustments being made are almost exactly 1.5°F, which is the claimed warming in the article.
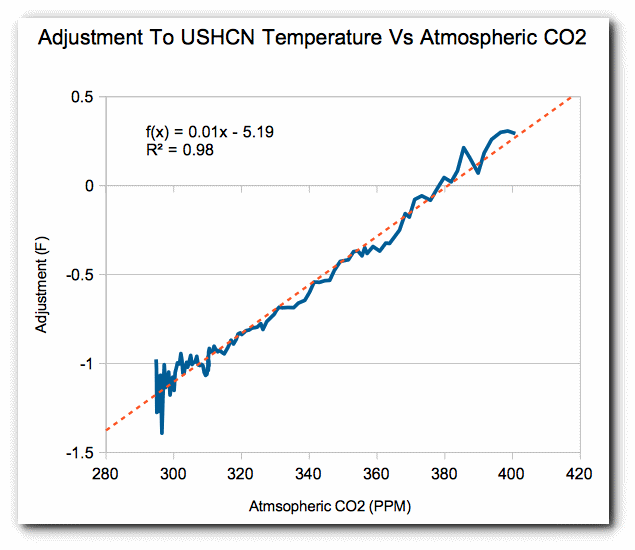
The adjustments correlate almost perfectly with atmospheric CO2. NOAA is adjusting the data to match global warming theory. This is known as PBEM (Policy Based Evidence Making.)
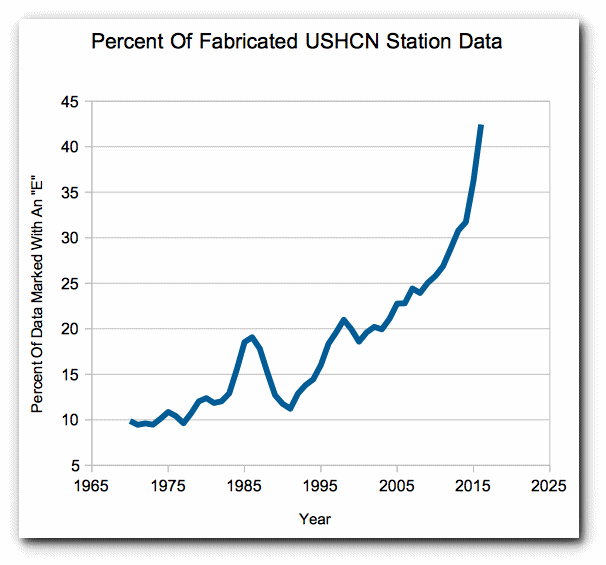
The hockey stick of adjustments since 1970 is due almost entirely to NOAA fabricating missing station data. In 2016, more than 42% of their monthly station data was missing, so they simply made it up. This is easy to identify because they mark fabricated temperatures with an “E” in their database.
When presented with my claims of fraud, NOAA typically tries to arm wave it away with these two complaints.
- They use gridded data and I am using un-gridded data.
- They “have to” adjust the data because of Time Of Observation Bias and station moves.
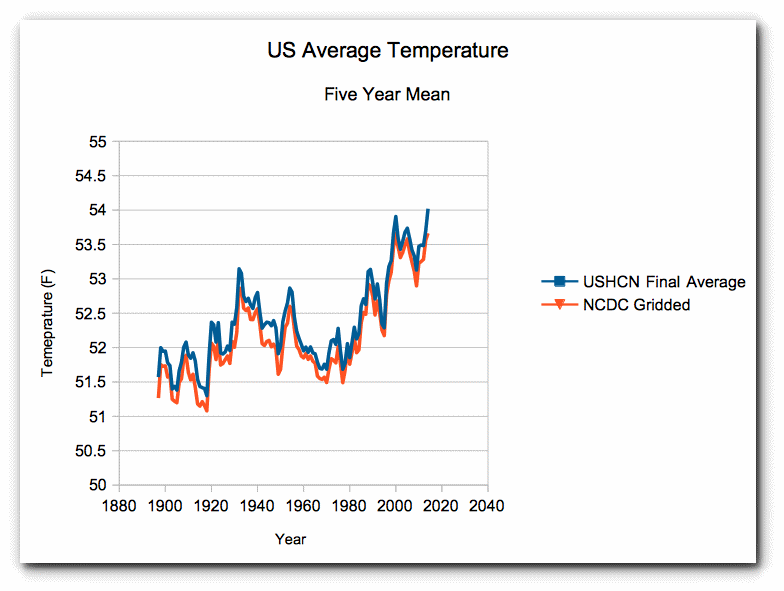
Both claims are easily debunked. The only effect that gridding has is to lower temperatures slightly. The trend of gridded data is almost identical to the trend of un-gridded data.
Time of Observation Bias (TOBS) is a real problem, but is very small. TOBS is based on the idea that if you reset a min/max thermometer too close to the afternoon maximum, you will double count warm temperatures (and vice-versa if thermometer is reset in the morning.) Their claim is that during the hot 1930’s most stations reset their thermometers in the afternoon.
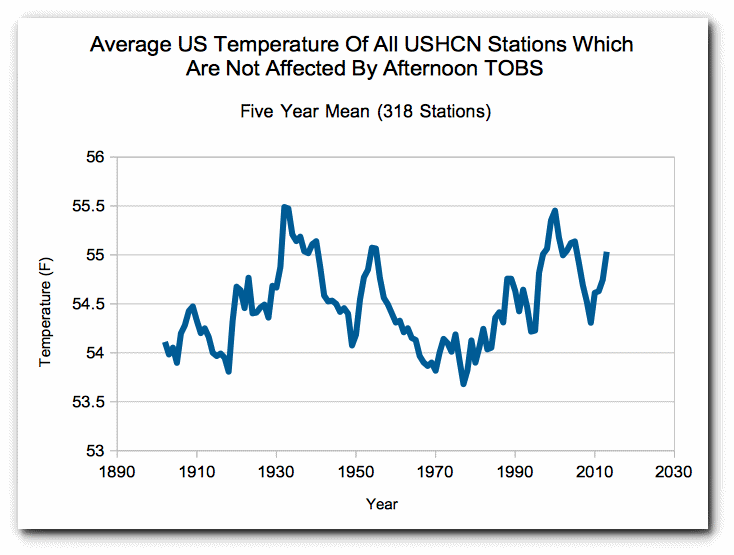
This is easy to test by using only the stations which did not reset their thermometers in the afternoon during the 1930’s. The pattern is almost identical to that of all stations. No warming over the past century. Note that the graph below tends to show too much warming due to morning TOBS.
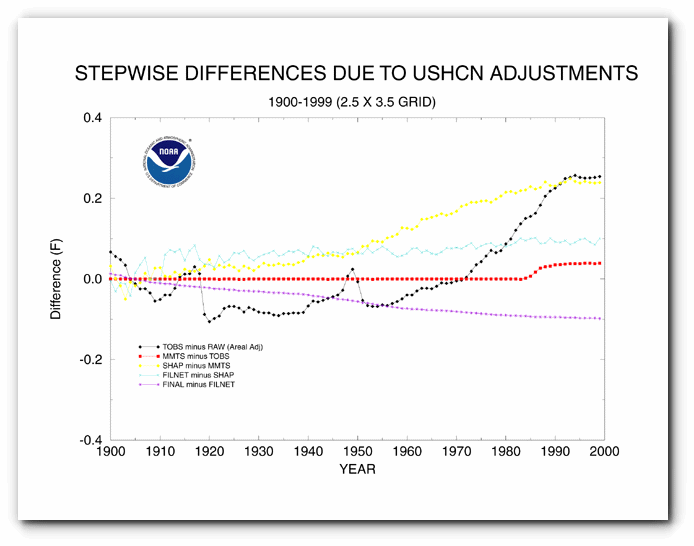
NOAA’s own documents show that the TOBS adjustment is small (0.3°F) and goes flat after 1990.
https://www.ncdc.noaa.gov/img/climate/research/ushcn/ts.ushcn_anom25_diffs_pg.gif
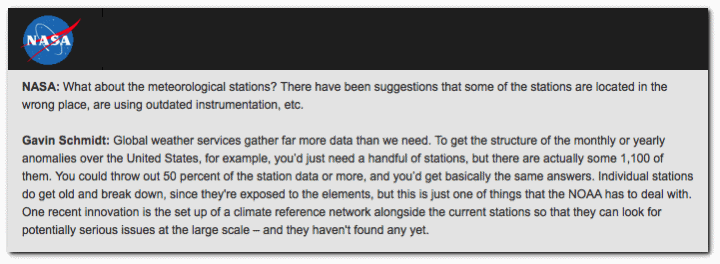
Gavin Schmidt at NASA explains very clearly why the US temperature record does not need to be adjusted.
You could throw out 50 percent of the station data or more, and you’d get basically the same answers.
One recent innovation is the set up of a climate reference network alongside the current stations so that they can look for potentially serious issues at the large scale – and they haven’t found any yet.
NASA – NASA Climatologist Gavin Schmidt Discusses the Surface Temperature Record
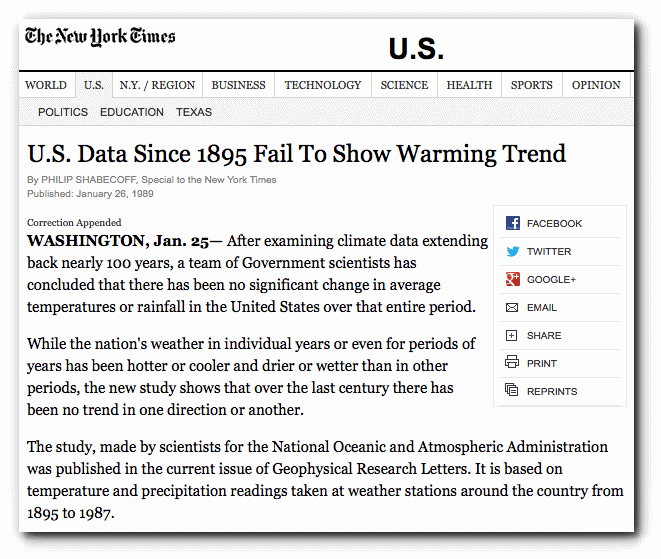
NOAA has always known that the US is not warming.
U.S. Data Since 1895 Fail To Show Warming Trend – NYTimes.com
All of the claims in the Climate Central article are bogus. The US is not warming and 2016 was not a hot year in the US. It was a very mild year.

