95% Confidence That NASA Temperature Records Are Fraudulent

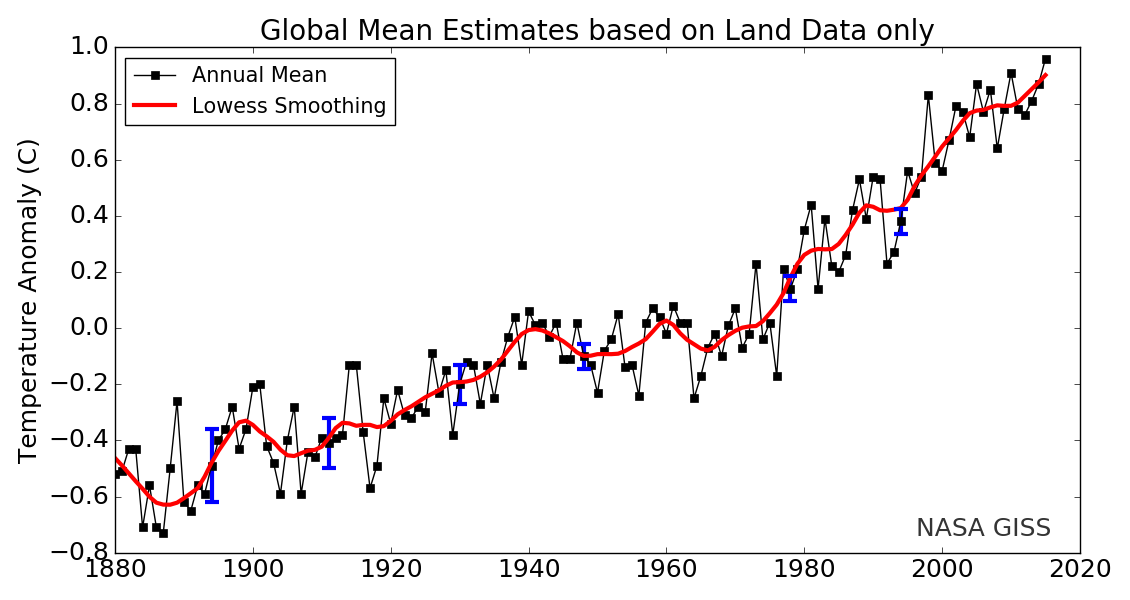
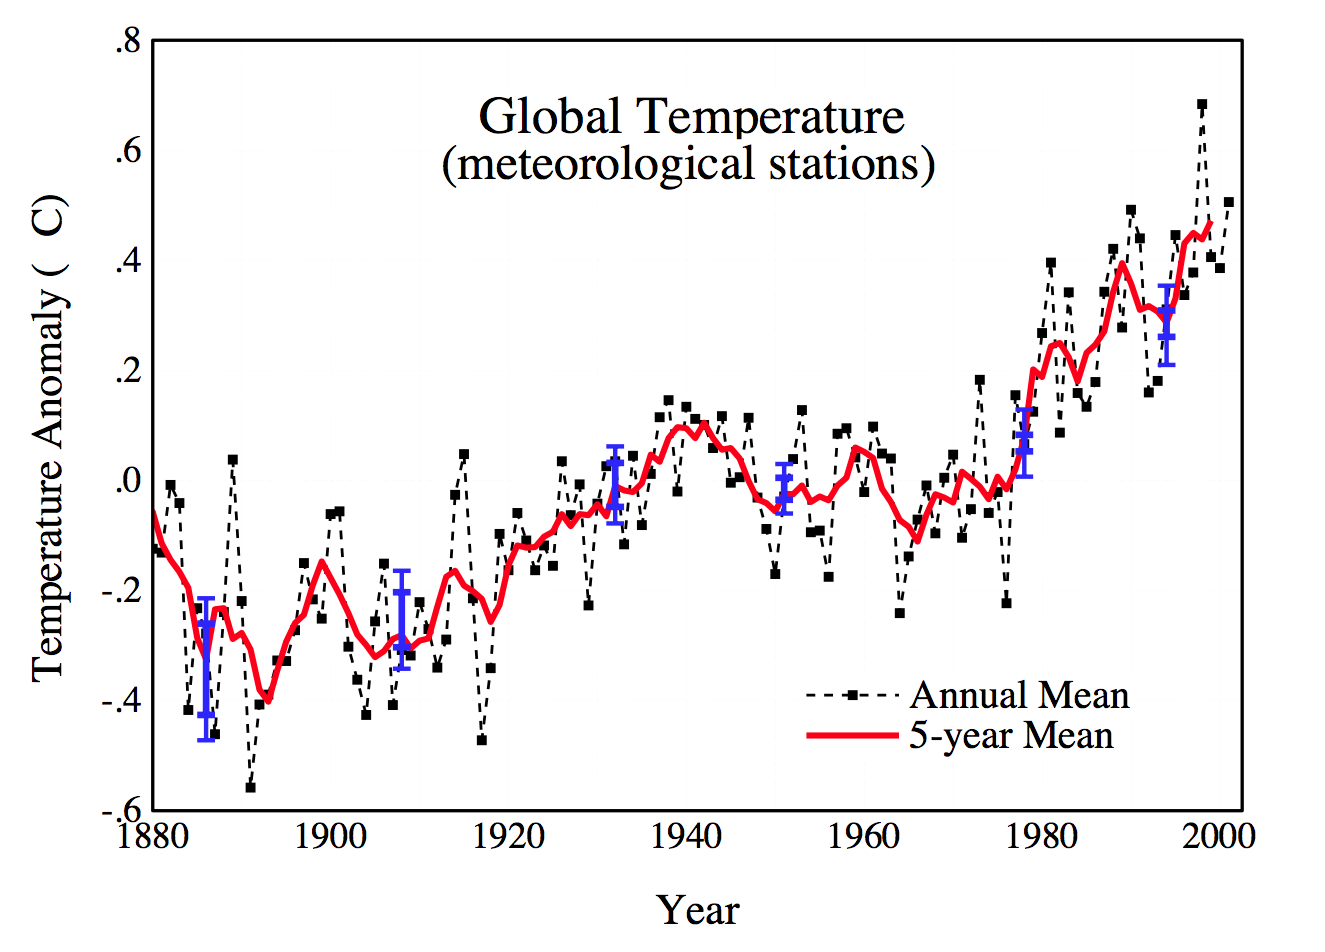
In 2001, NASA graphs showed 0.5C warming from 1880 to 1998. Now they show 1.1C warming during that same period. The image below overlays the two NASA graphs, with the colors shifted in the 2001 version for clarity.

Gavin Schmidt has more than doubled warming by altering the data. Even worse, Gavin has altered the data far outside his own 95% confidence bounds. The 2001 confidence bounds are shown as the red vertical bars, and the 2016 confidence bounds are shown as the blue vertical bars.  This is a smoking gun that Gavin’s data is fake, and his confidence intervals are meaningless.

2001 version                 2016 version

2016 version

2001 version

But Gavin’s fraud is worse than it seems. He uses an optical illusion to minimize the appearance of tampering. By adjusting pre-197o temperatures down, and post-1970 temperatures up, the magnitude of the tampering is harder to see. In order to better visualize the fraud, I normalized the graphs to the five year mean of the most recent common years.

Global warming is the biggest scam in science history.

This entry was posted in Uncategorized. Bookmark the permalink.

17 Responses to 95% Confidence That NASA Temperature Records Are Fraudulent

  1. Jason Calley says:

    The fact that the “adjustments” fall outside the error bars is (as you say) a smoking gun. One might expect a few points (maybe one data point out of 20) to fall outside the error bars, but even that assumes that the “adjustments” are documented, massive, and justifiable. What massive store of new information has NASA come across that justifies changing calculated temperatures from 100 years ago? In what way has our understanding of thermometers changed such that we now know that the average thermometer of 1880 was reading a half degree too hot? In what way has our understanding of thermometers changed such that we now know that the average thermometer of 1995 was reading a tenth degree too cold?

    Bah! The changes NASA have made are too large, too undocumented, too unjustified, and too monotonic. Why have they done it? The obvious reason is that they made the changes because doing so was far, far too lucrative.

  2. LOL in Oregon says:

    But, but, but,
    the satellites show that the “record high” is only a touch above 19 years ago in 1997!
    What happened to all the heat? Why hasn’t it gone up faster?
    Aren’t we burning enough $$$ to make it warm?

  3. Reasonable Skeptic says:

    I recall bringing up the error bar issue a number of months ago, perhaps late last summer (2016). Pretty sure it was here actually.

    This is exactly what I wanted to see. There is no way that science can claim to be remotely correct if they modified the data well beyond the original error bars.

    Not only that , but the original data is well outside their current error bar as well which only proves that, assuming they are right now, the other scientists were total incompetent boobs. Of course the incompetent boobs of yesteryear are the same people that are bang on now.

  4. Rud Istvan says:

    Compelling and simple. Well done.

  5. Shooter says:

    Hey Tony, you see that 90 second video NASA released on how CO2 is the ‘thermostat’ of the Earth? Might be relevant here.

    Also relevant is how on Climate 4 You, all of the NASA/NOAA graphs have hockey sticks.

  6. Pingback: 95% Confidence That NASA Temperature Records Are Fraudulent — The Rudy Heller Climate Science Blog | libertariantranslator

  7. aeroguy48 says:

    Didn’t Gavin Schmidt announce he was going to retire the 20th?

  8. ScottM says:

    “In order to better visualize the fraud, I normalized the graphs to the five year mean of the most recent common years.”

    Why would you do that, Tony?

    The GISS base period is 1951-1980. The two graphs should agree most closely in that period. Wouldn’t trying to force agreement in the last years of the earlier graph inject an artificial bias in your analysis? The variances you are talking about differ most in the earlier years, so wouldn’t that bias exaggerate the difference?

    • AndyG55 says:

      “The two graphs should agree most closely in that period.”

      The operative word is “should”

      Thing is that GISS have cooled everything before about 1980 and warmed everything after. If they do that, they change the mean of the 1951-1980 period anyway.

      Where-ever you slide the graphs to makes no difference to illustrating the MALFEFICENCE and LYING DECEIT of the NOAA/GISS climate adjusters.

      • ScottM says:

        The reason the operative word is “should” is that such is the normative methodology for such a comparison of anomalies. Tony is violating the norm. In doing so, he forces the two records to diverge *during their common base period*. Thus the difference is contracted for years after the base period at the expense of the years before the base period.

        • Gator says:

          And now we see the problem with anomalies.

        • AndyG55 says:

          They would diverge anyway. the slopes are different

          or are just as stupid as you seem to be?

          The 2001 version has been adjusted downwards

          ..and only some serious AGW maleficence could hide that fact.

          END OF STORY.

    • David A says:

      I thought Tony was pretty clear on why…
      “Gavin’s fraud is worse than it seems. He uses an optical illusion to minimize the appearance of tampering. By adjusting pre-197o temperatures down, and post-1970 temperatures up, the magnitude of the tampering is harder to see. In order to better visualize the fraud, I normalized the graphs to the five year mean of the most recent common years.”

      • ScottM says:

        What Tony calls an “optical illusion” is Tony’s own deceptive practice. Tony is actually increasing the apparent magnitude of the pre-1970 adjustment. All anomalies in both versions are relative to the base period, therefore the magnitude of adjustment for any given year is the difference between that year’s anomaly in the new version and that year’s anomaly in the old version. But by changing the base period, in effect, to 1995-2000, he is actually subtracting the average 1995-2000 anomaly from each record, and that 5-year average anomaly is larger in the new record. So Tony is cooling the past in both records, but cooling it *more* for the new record.

        That would be fine, if we were just comparing trends: The vertical shift has no effect on trends. The trend is larger in the new record. But Tony is not comparing the trends. He is comparing error bars in pre-1960 years. And his method of doing so is to zero the post-1995 error magnitude and transfer the balance to the earlier years. Presto! The overlap of the error bars disappears. This is a very biased methodology. Hey, why not just take 2 degrees off of the newer record and then overlay the two graphs? That would make the alleged fraud look worse still, and is no more dishonest than picking some 5 year period that is 15 years after the end of the base period!

        • Gail Combs says:

          Oh good grief. Tony is looking at a graph from 2001 and a graph from 2016.

          “…normalized the graphs to the five year mean of the most recent common years.”

          Meaning he over laid the 2016 graph so it matches years 1996 to 2001 on the 2001 graph. This makes sense if you ASSume the most recent data is the most precise and accurate thanks to the most up to date instruments.

          You are suggesting using the SAME METHOD used to mask the manipulation while Tony is highlighting it.

          There is ZERO reason for the 2001 and 2016 graphs to diverge AT ALL!

          Another way to look at it:
          2016 graph
          1880 = minus 0.6
          1998 = plus 0.8

          2001 graph
          1880 = minus 0.1
          1998 = plus 0.7

          SO NASA changed the slope from 0.8 degrees over ~110 years to 1.4 degrees over ~110 years by increasing 1998 by ONLY 0.1 and DECREASING 1880 by 0.5. Not only that the years around 1980 match where BOTH graphs are at zero anomaly.

          So Tony’s matching the years 1994 to 2001 hasn’t made a darn bit of difference in the visuals

          (I chose 1998 since it is easy to ID the Super El Nino in both graphs)

  9. pmc47025 says:

    ScottM, alias for JohnB?

Leave a Reply

Your email address will not be published. Required fields are marked *