
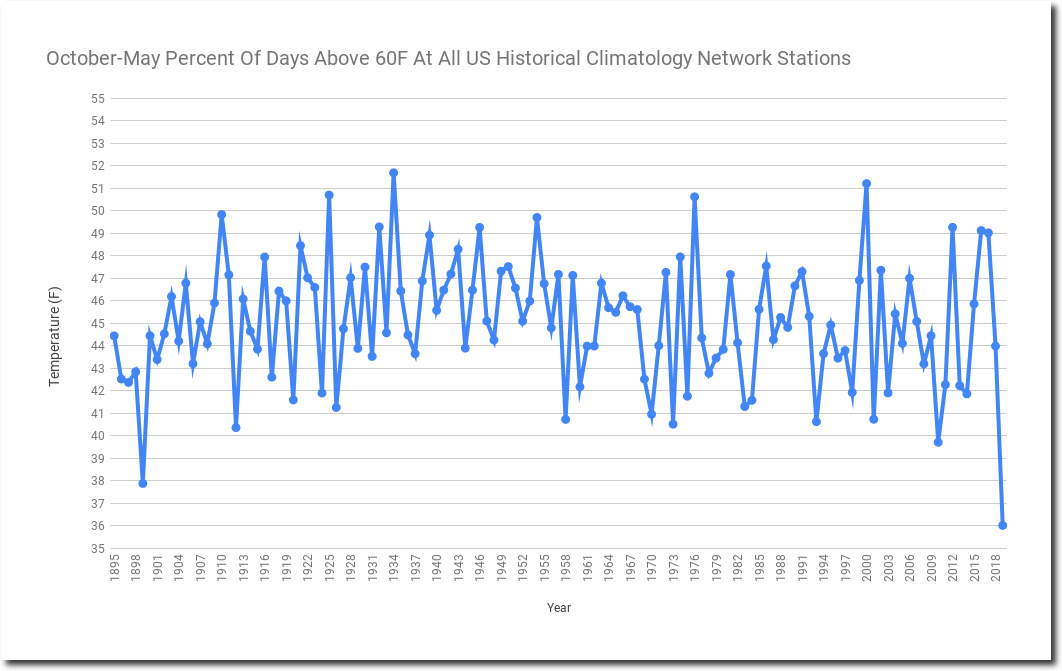
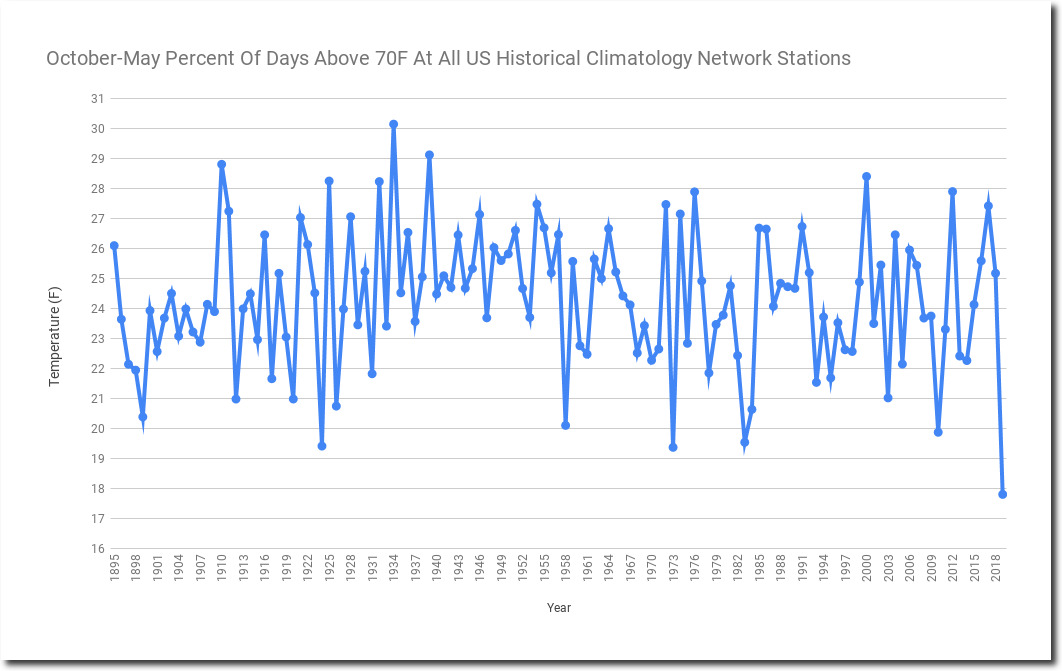
The last seven months was the coolest and wettest October-May on record in the US. The percent of days above 60F and 70F was the lowest, with 1933-1934 being the highest. Compare with 1934, which was the warmest and driest.
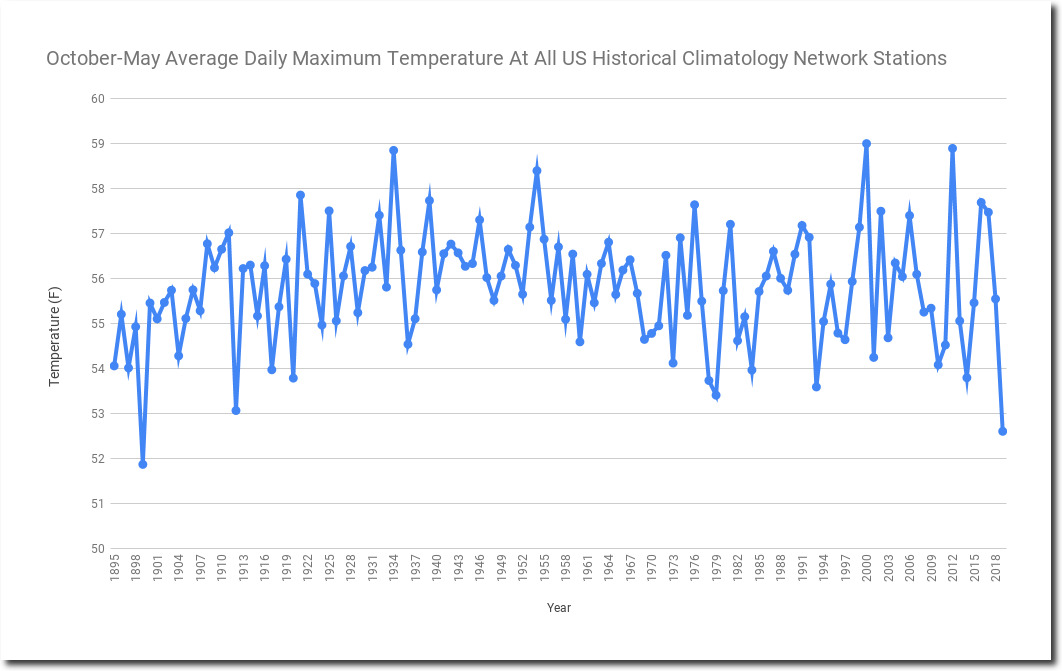
Average maximum temperature was second lowest after 1899.
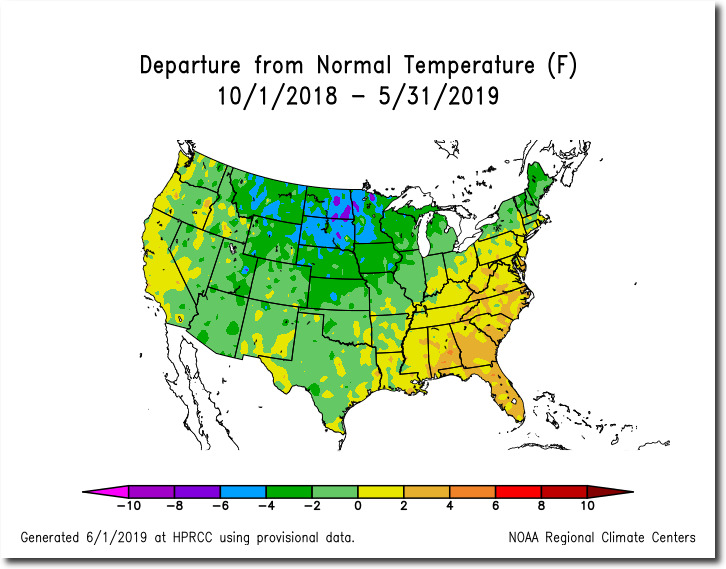
Nearly three fourths of the US was below normal temperature.
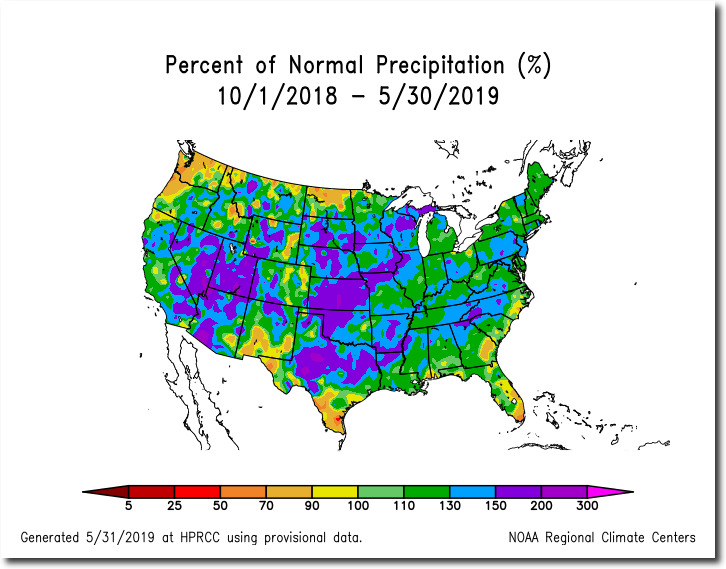
It was the wettest October-May on record, with almost the entire country above normal precipitation.
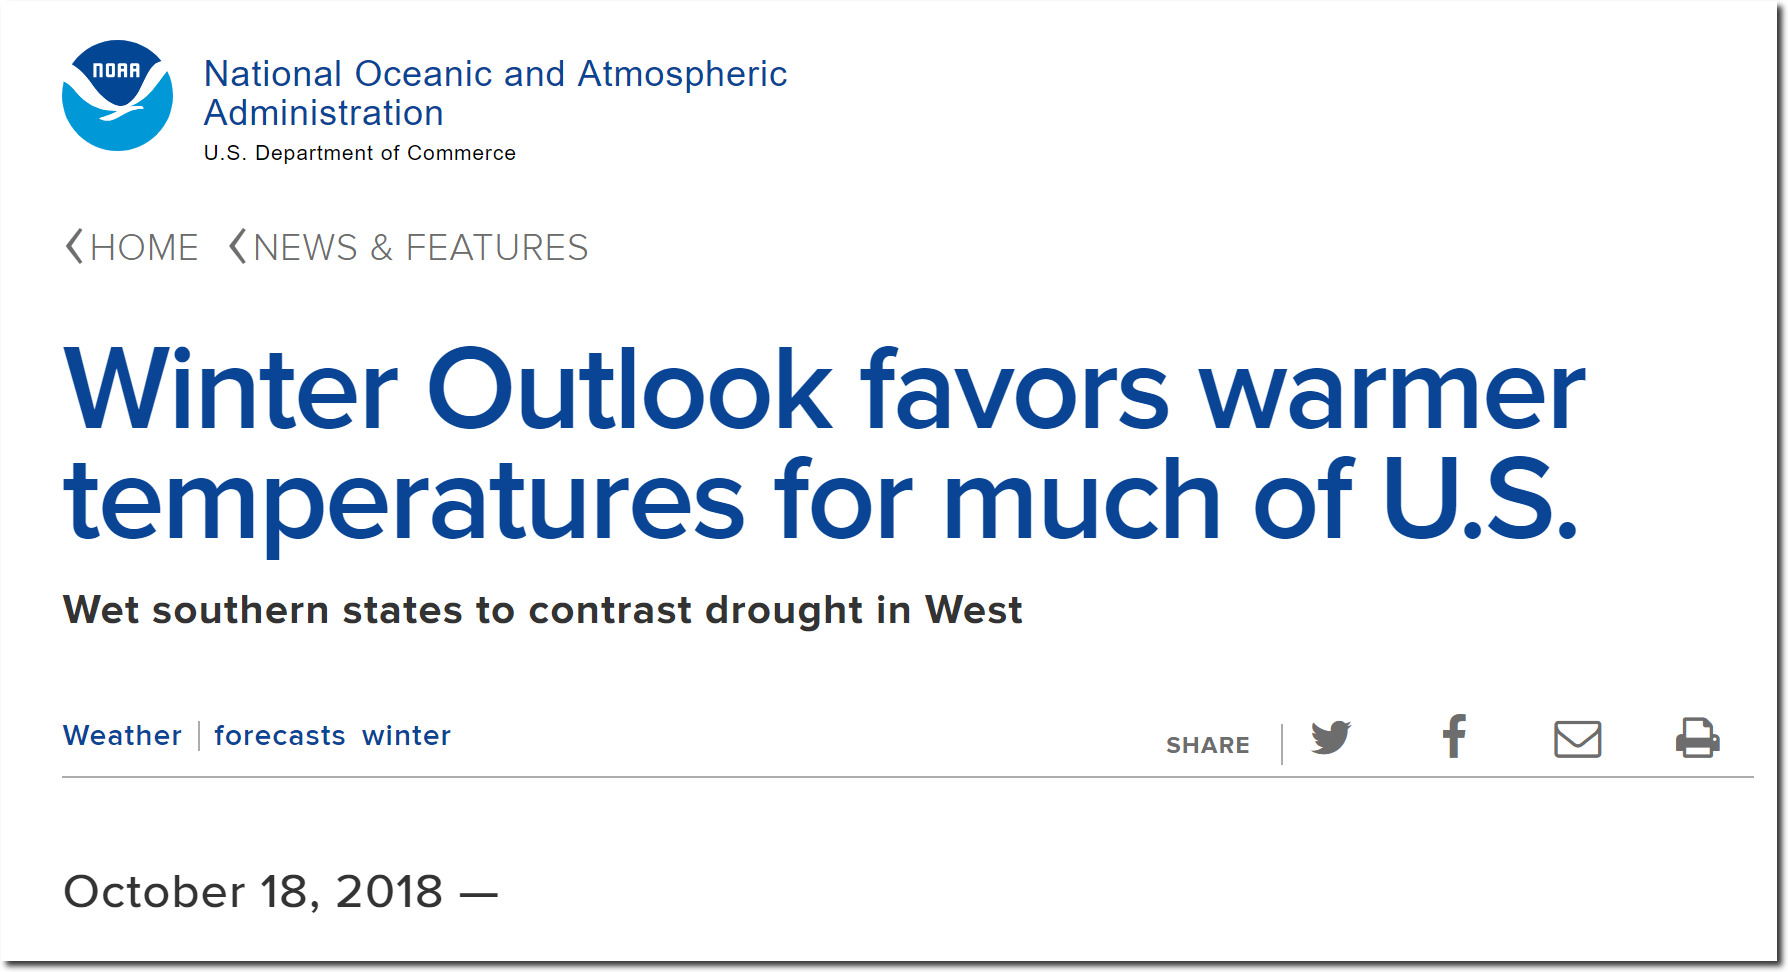
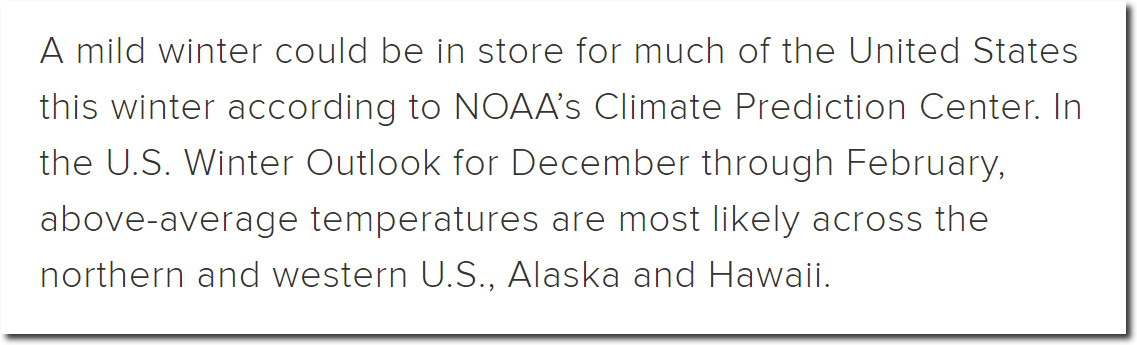
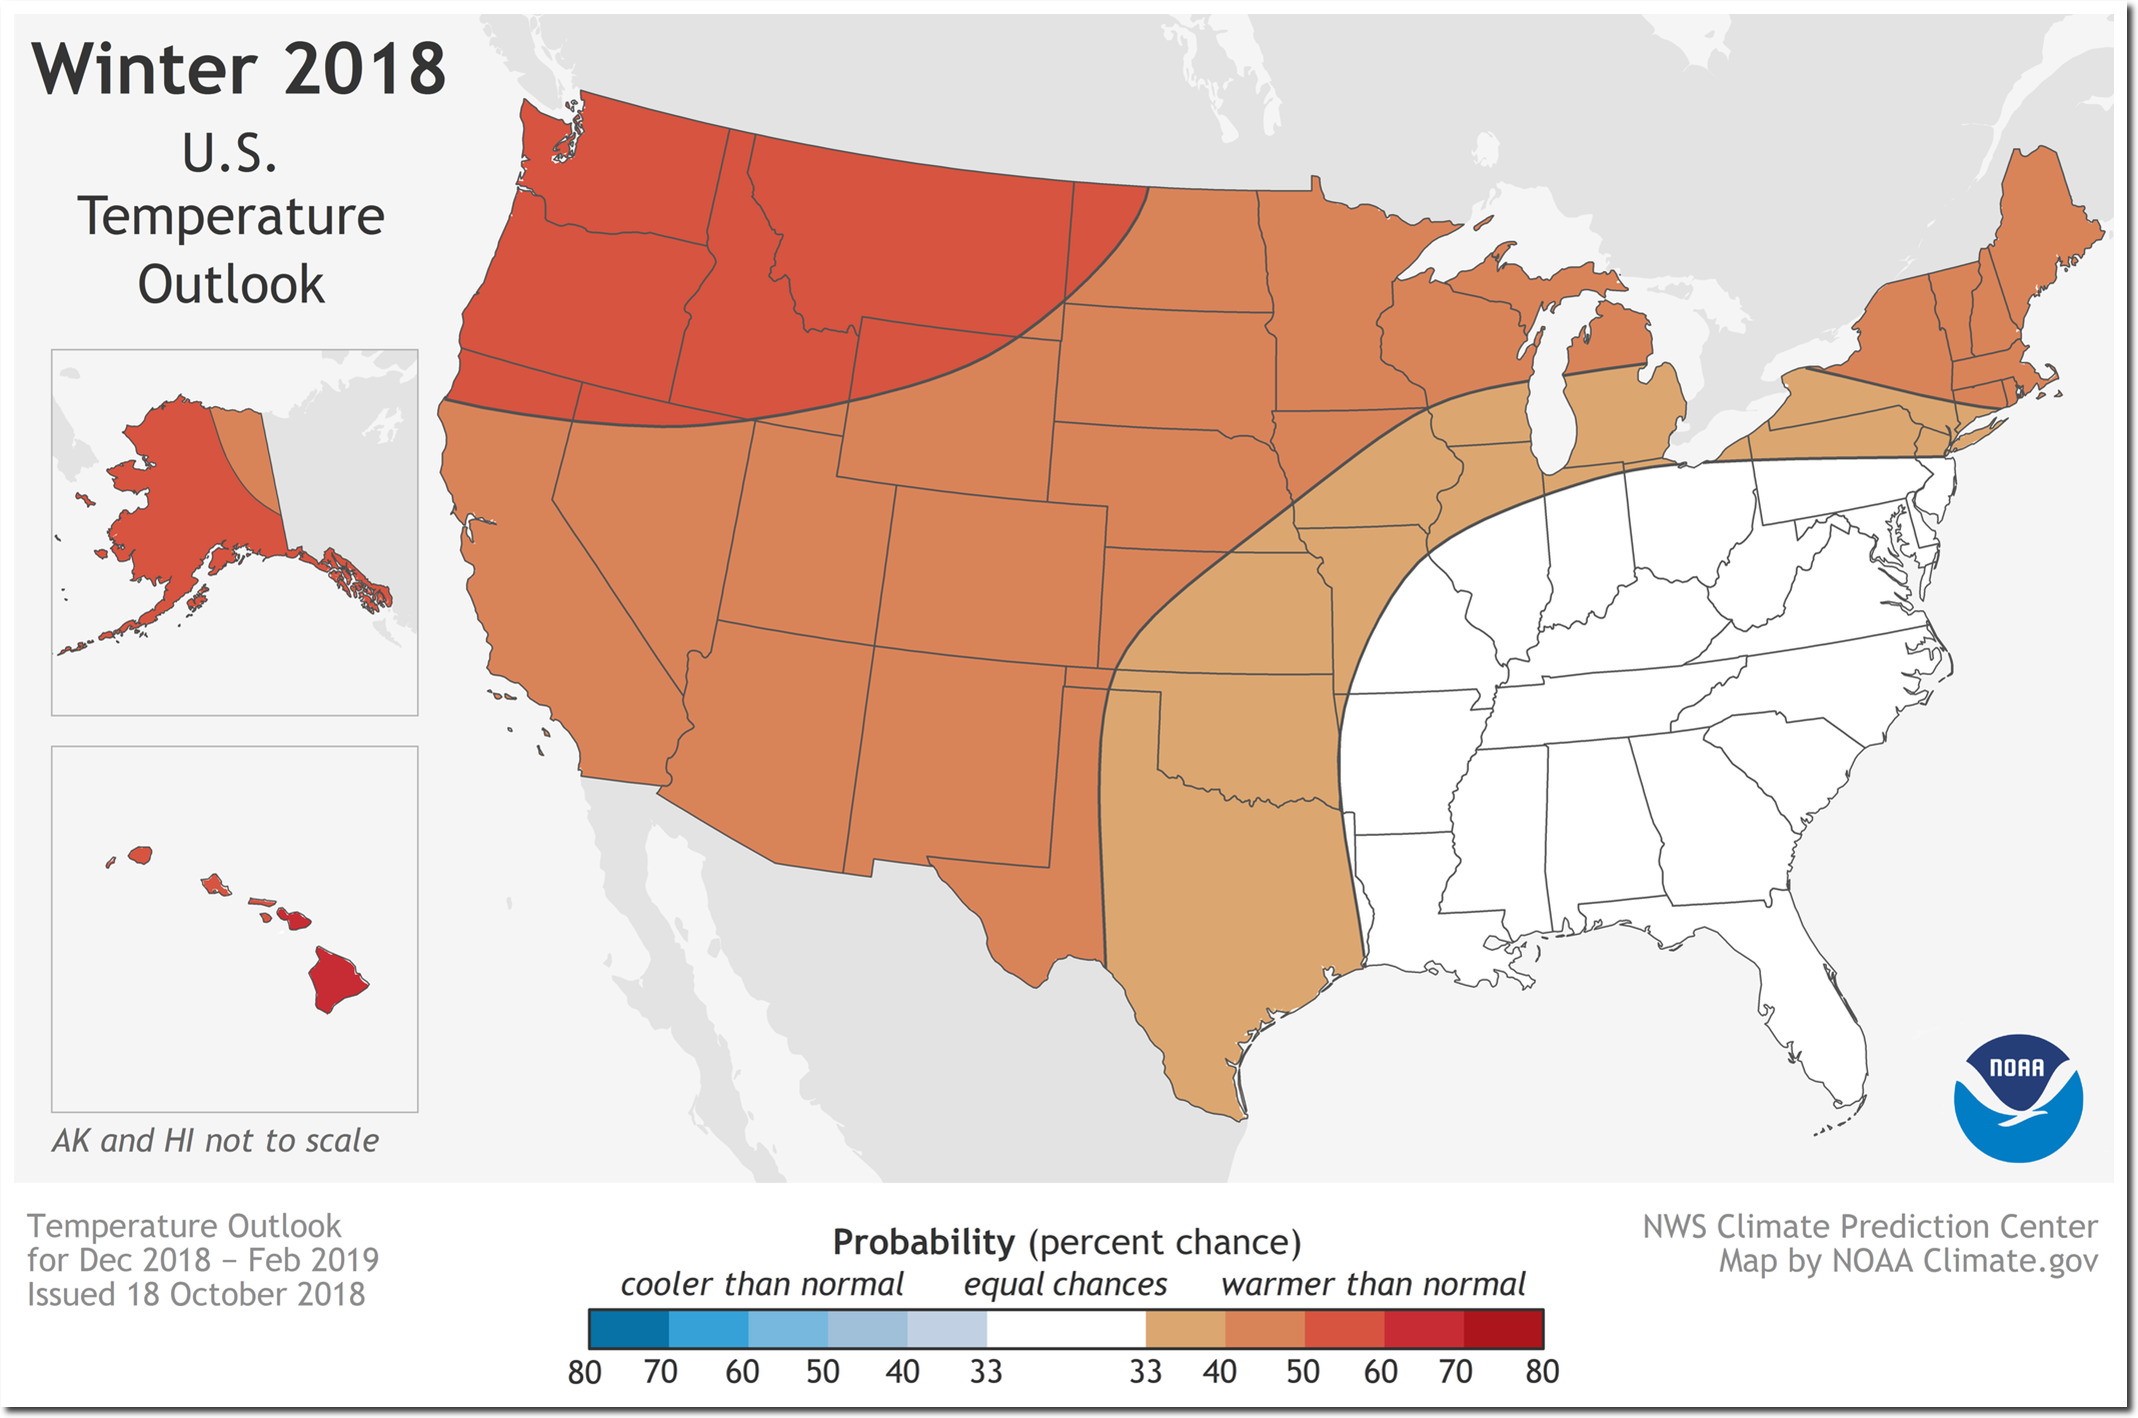
NOAA predicted a warm winter with drought in the west, and got everything exactly backwards. Three month forecasting with climate models doesn’t work, but experts say they are superb at forecasting 100 years out – when no one will remember.
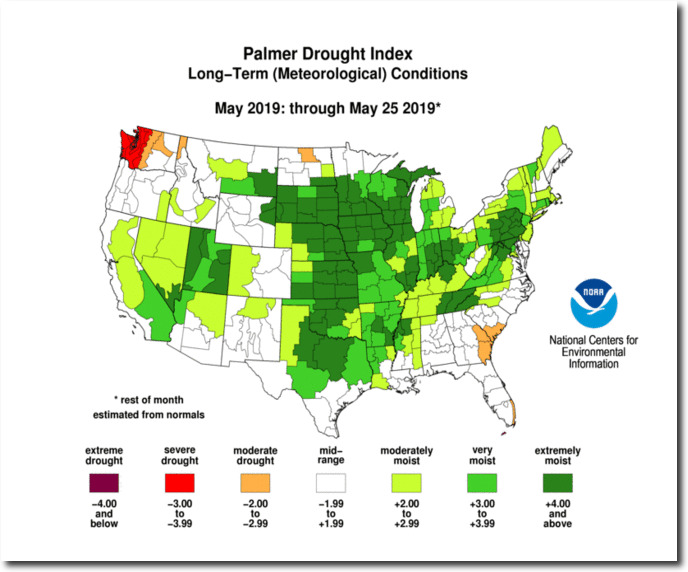
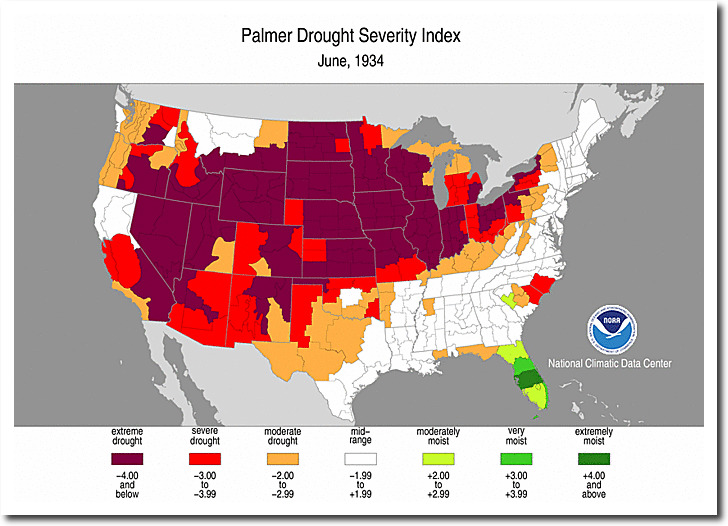
Drought levels are at historic lows, compared to record warm 1934 when drought was at historic highs.
Warm winters tend to be dry, and cold winters tend to be wet. Unless you are a climate expert, and claim the exact opposite.
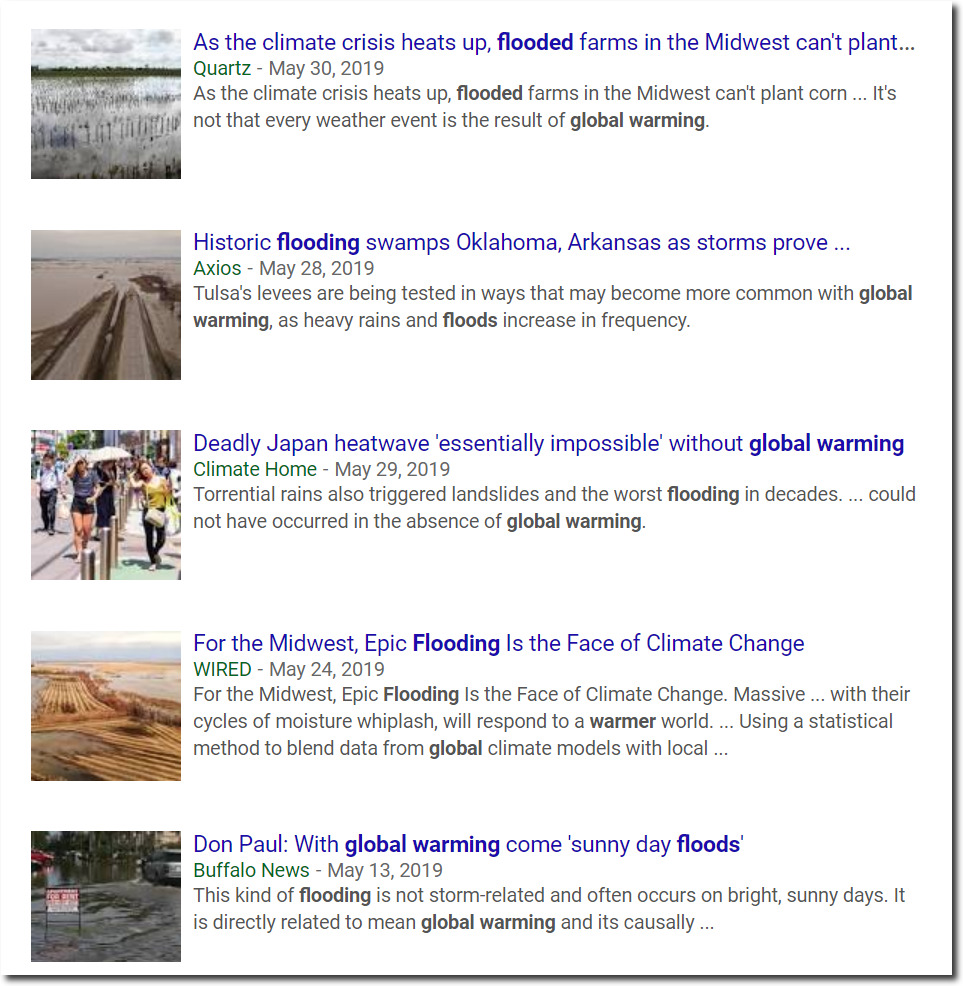
Climate experts say that the wet weather is caused by heat, but in 1988, NASA’s James Hansen predicted a huge increase in heat and drought. Apparently he believed that heat and drought go together.
If you liked last summer’s record temperatures, you’re going to love the 1990s, says James Hansen, the NASA scientist who, during congressional hearings on the Midwestern drought, linked greenhouse warming to the heat wave. Last summer was a preview of the average summer 10 years from now, and the hottest summers during the ’90s will be even hotter and drier than the one we just struggled through, he says.
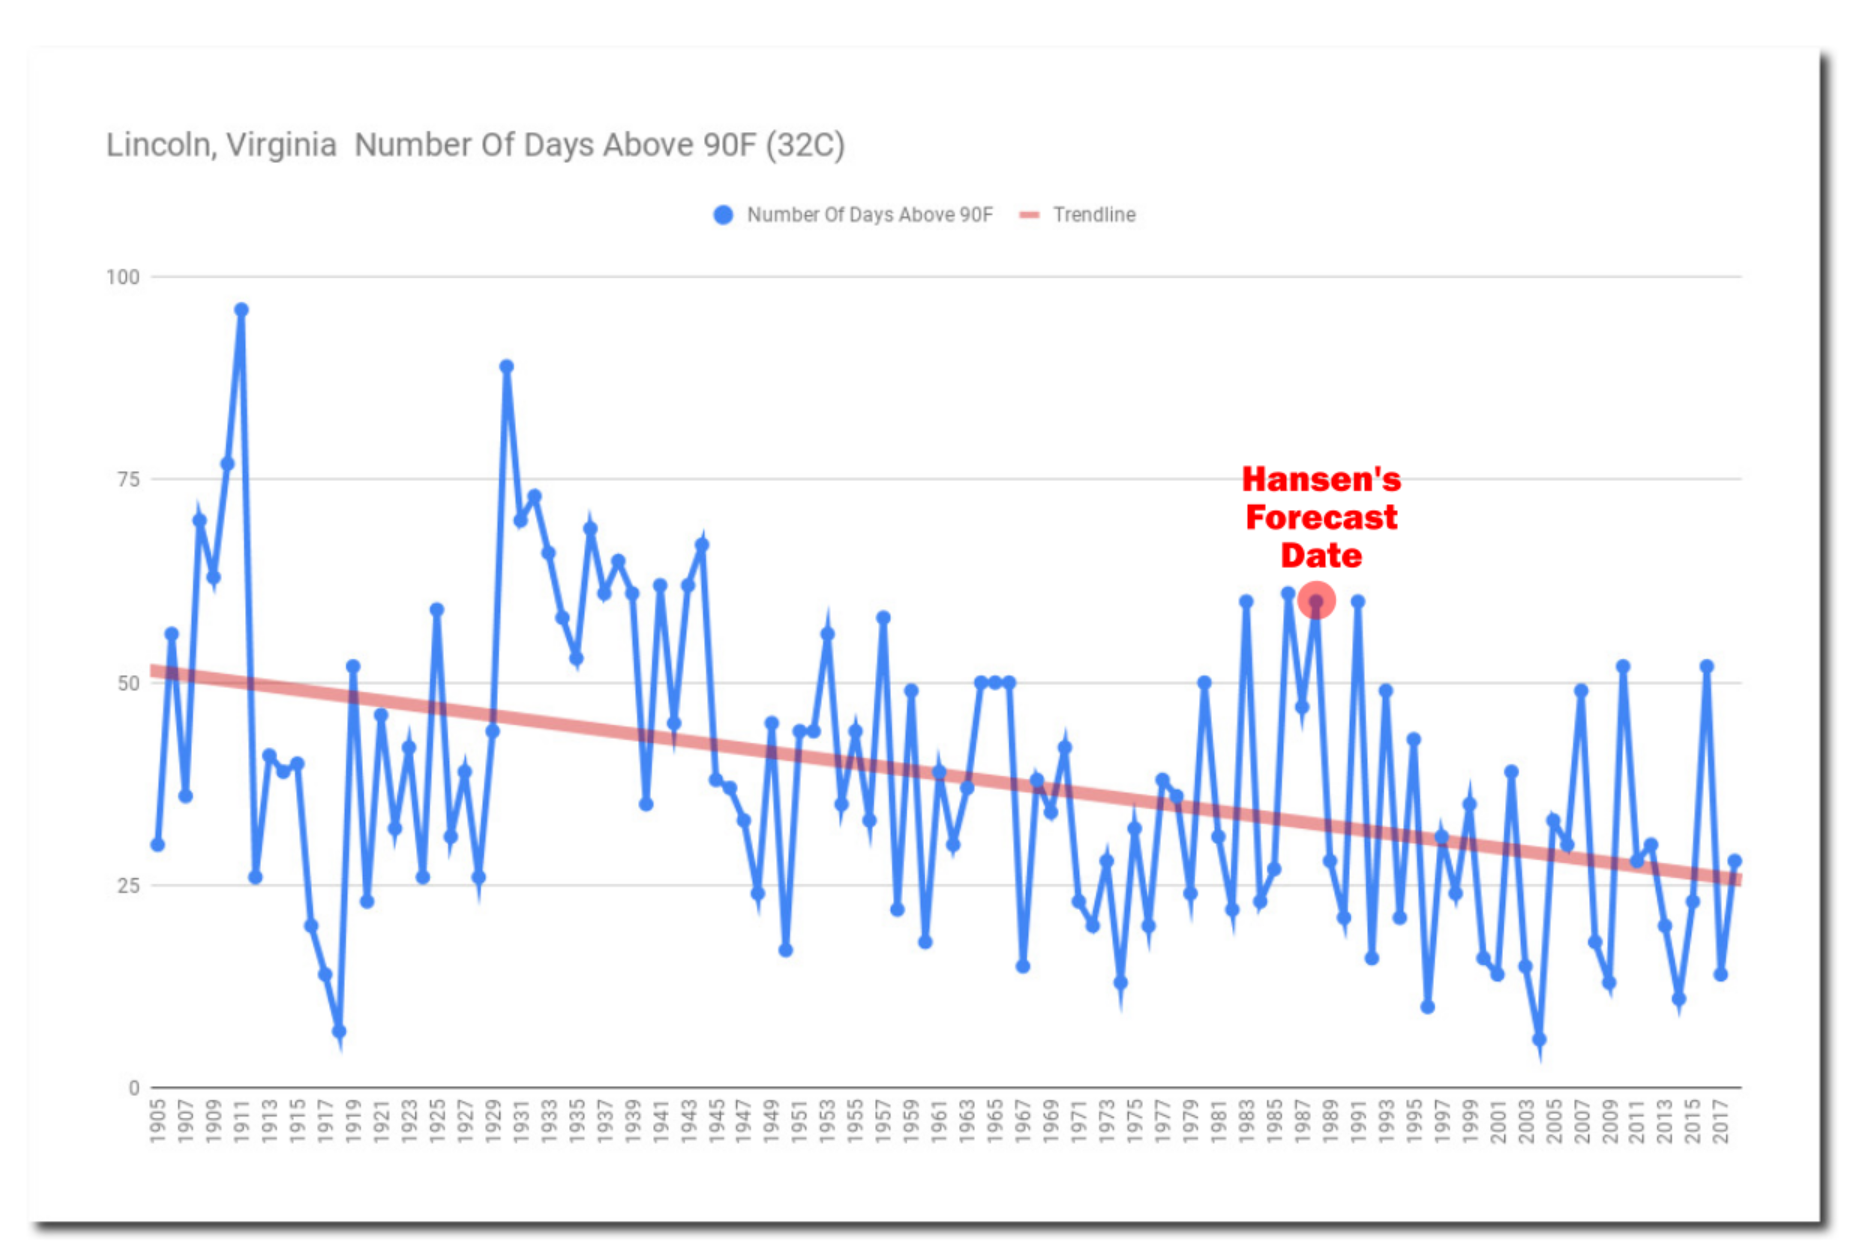
If we do nothing to cut down on pumping carbon dioxide into the atmosphere, temperatures in 2050 will be 6 to 7 degrees higher than they are today. Washington, D.C., for instance, would go from its current 35 days a year over 90 degrees to 85 days a year.
– James Hansen 1988
12 Dec 1988, Page 34 – Lansing State Journal
He got all of his forecasts exactly backwards.The number of hot days in the DC area peaked in 1911, and have been declining ever since.
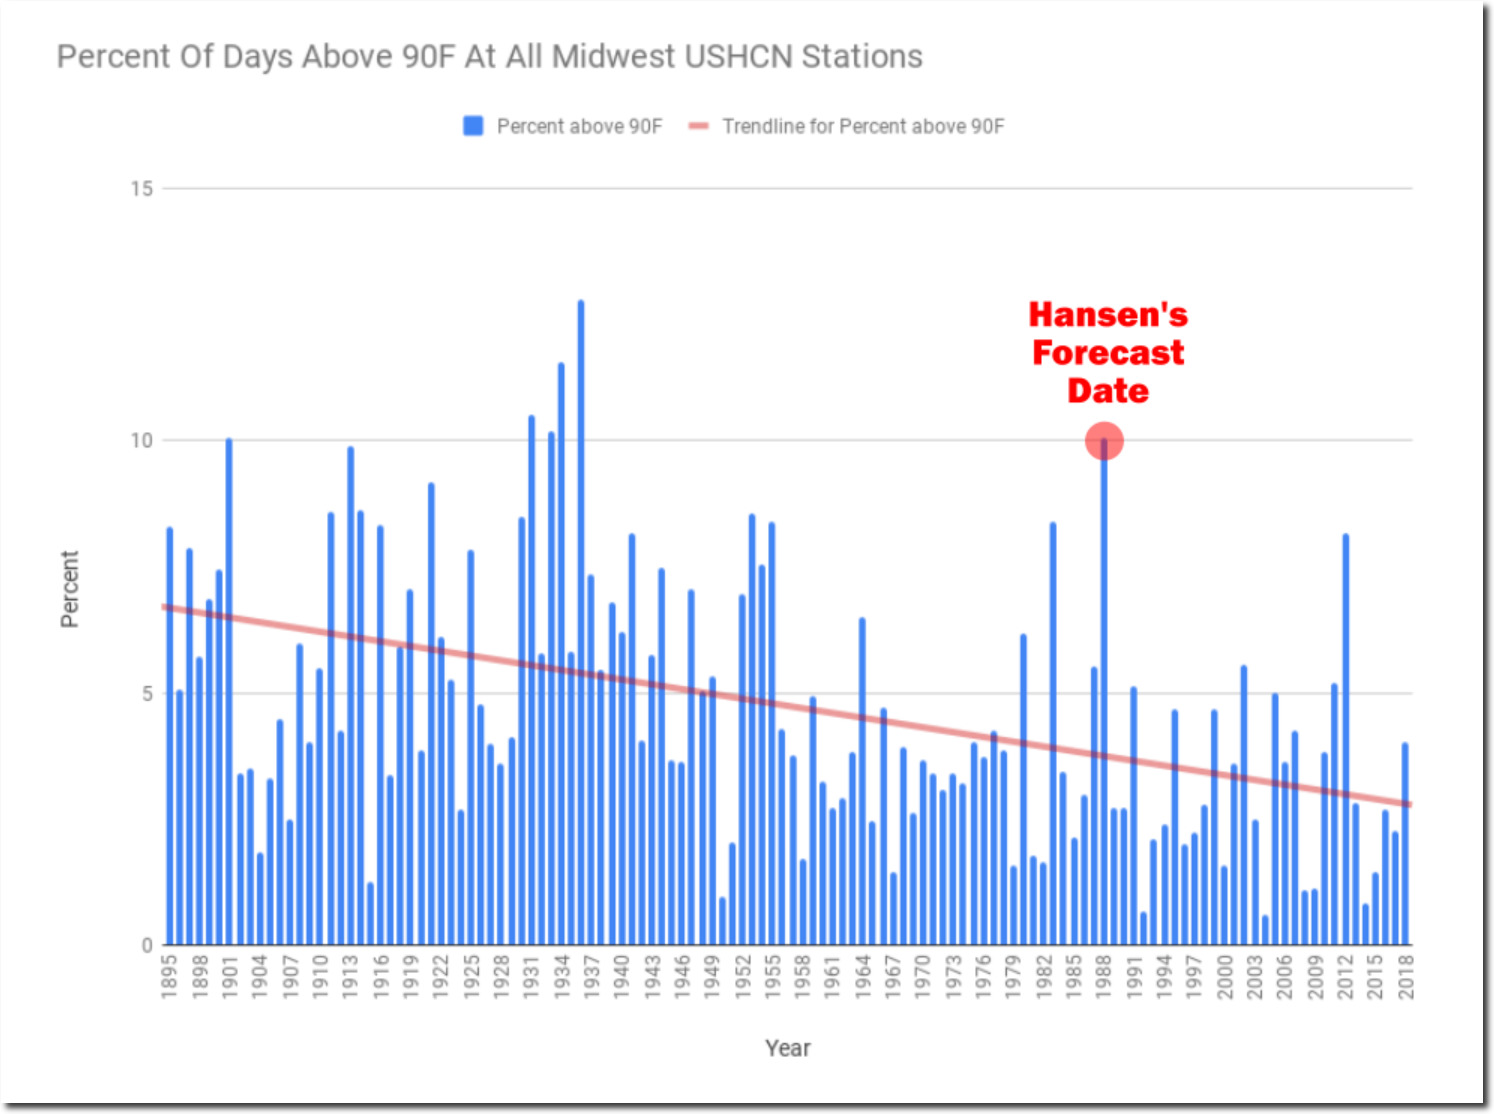
The number of hot days in the Midwest peaked in 1936, and have been declining ever since.
The Midwest is getting wetter. The last really dry year in the Midwest was 1988, and recent years have been record wet.
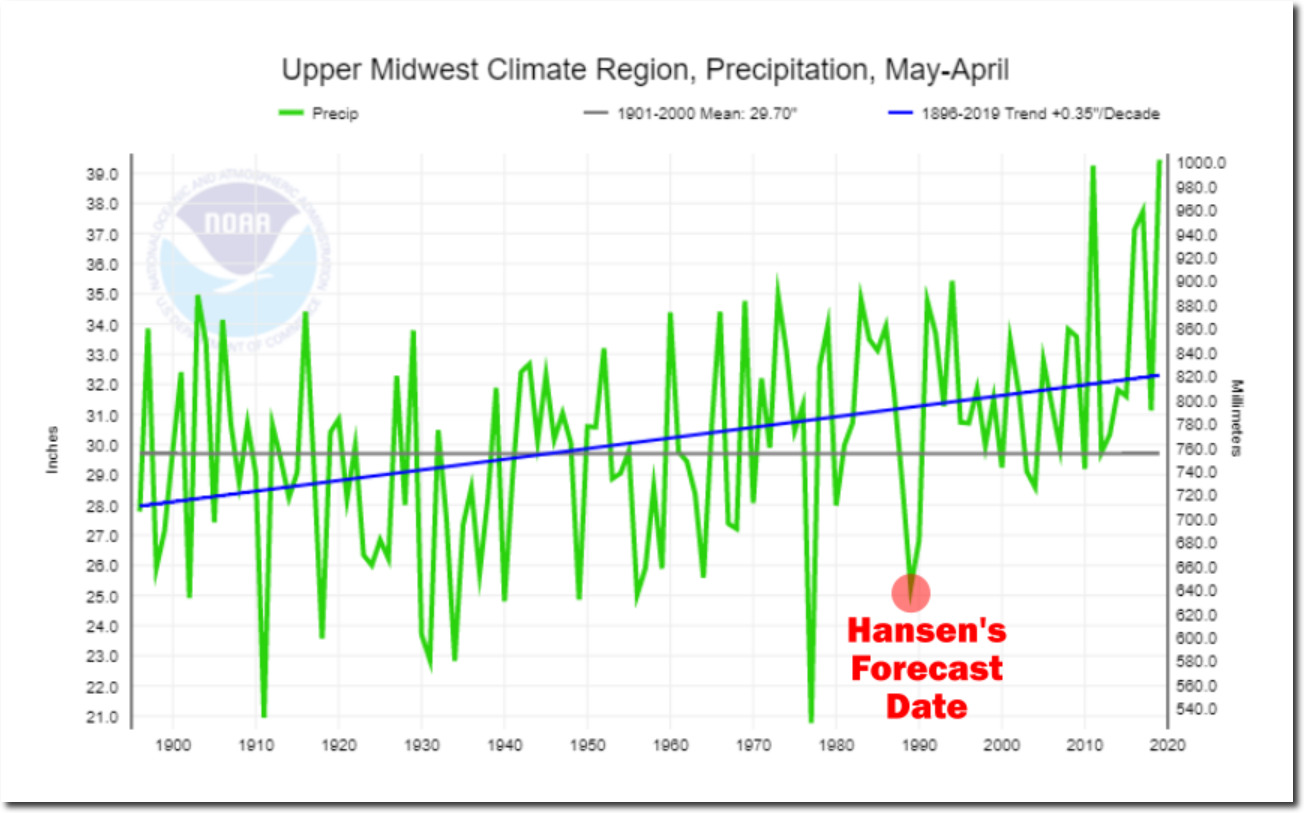
Climate at a Glance | National Centers for Environmental Information (NCEI)
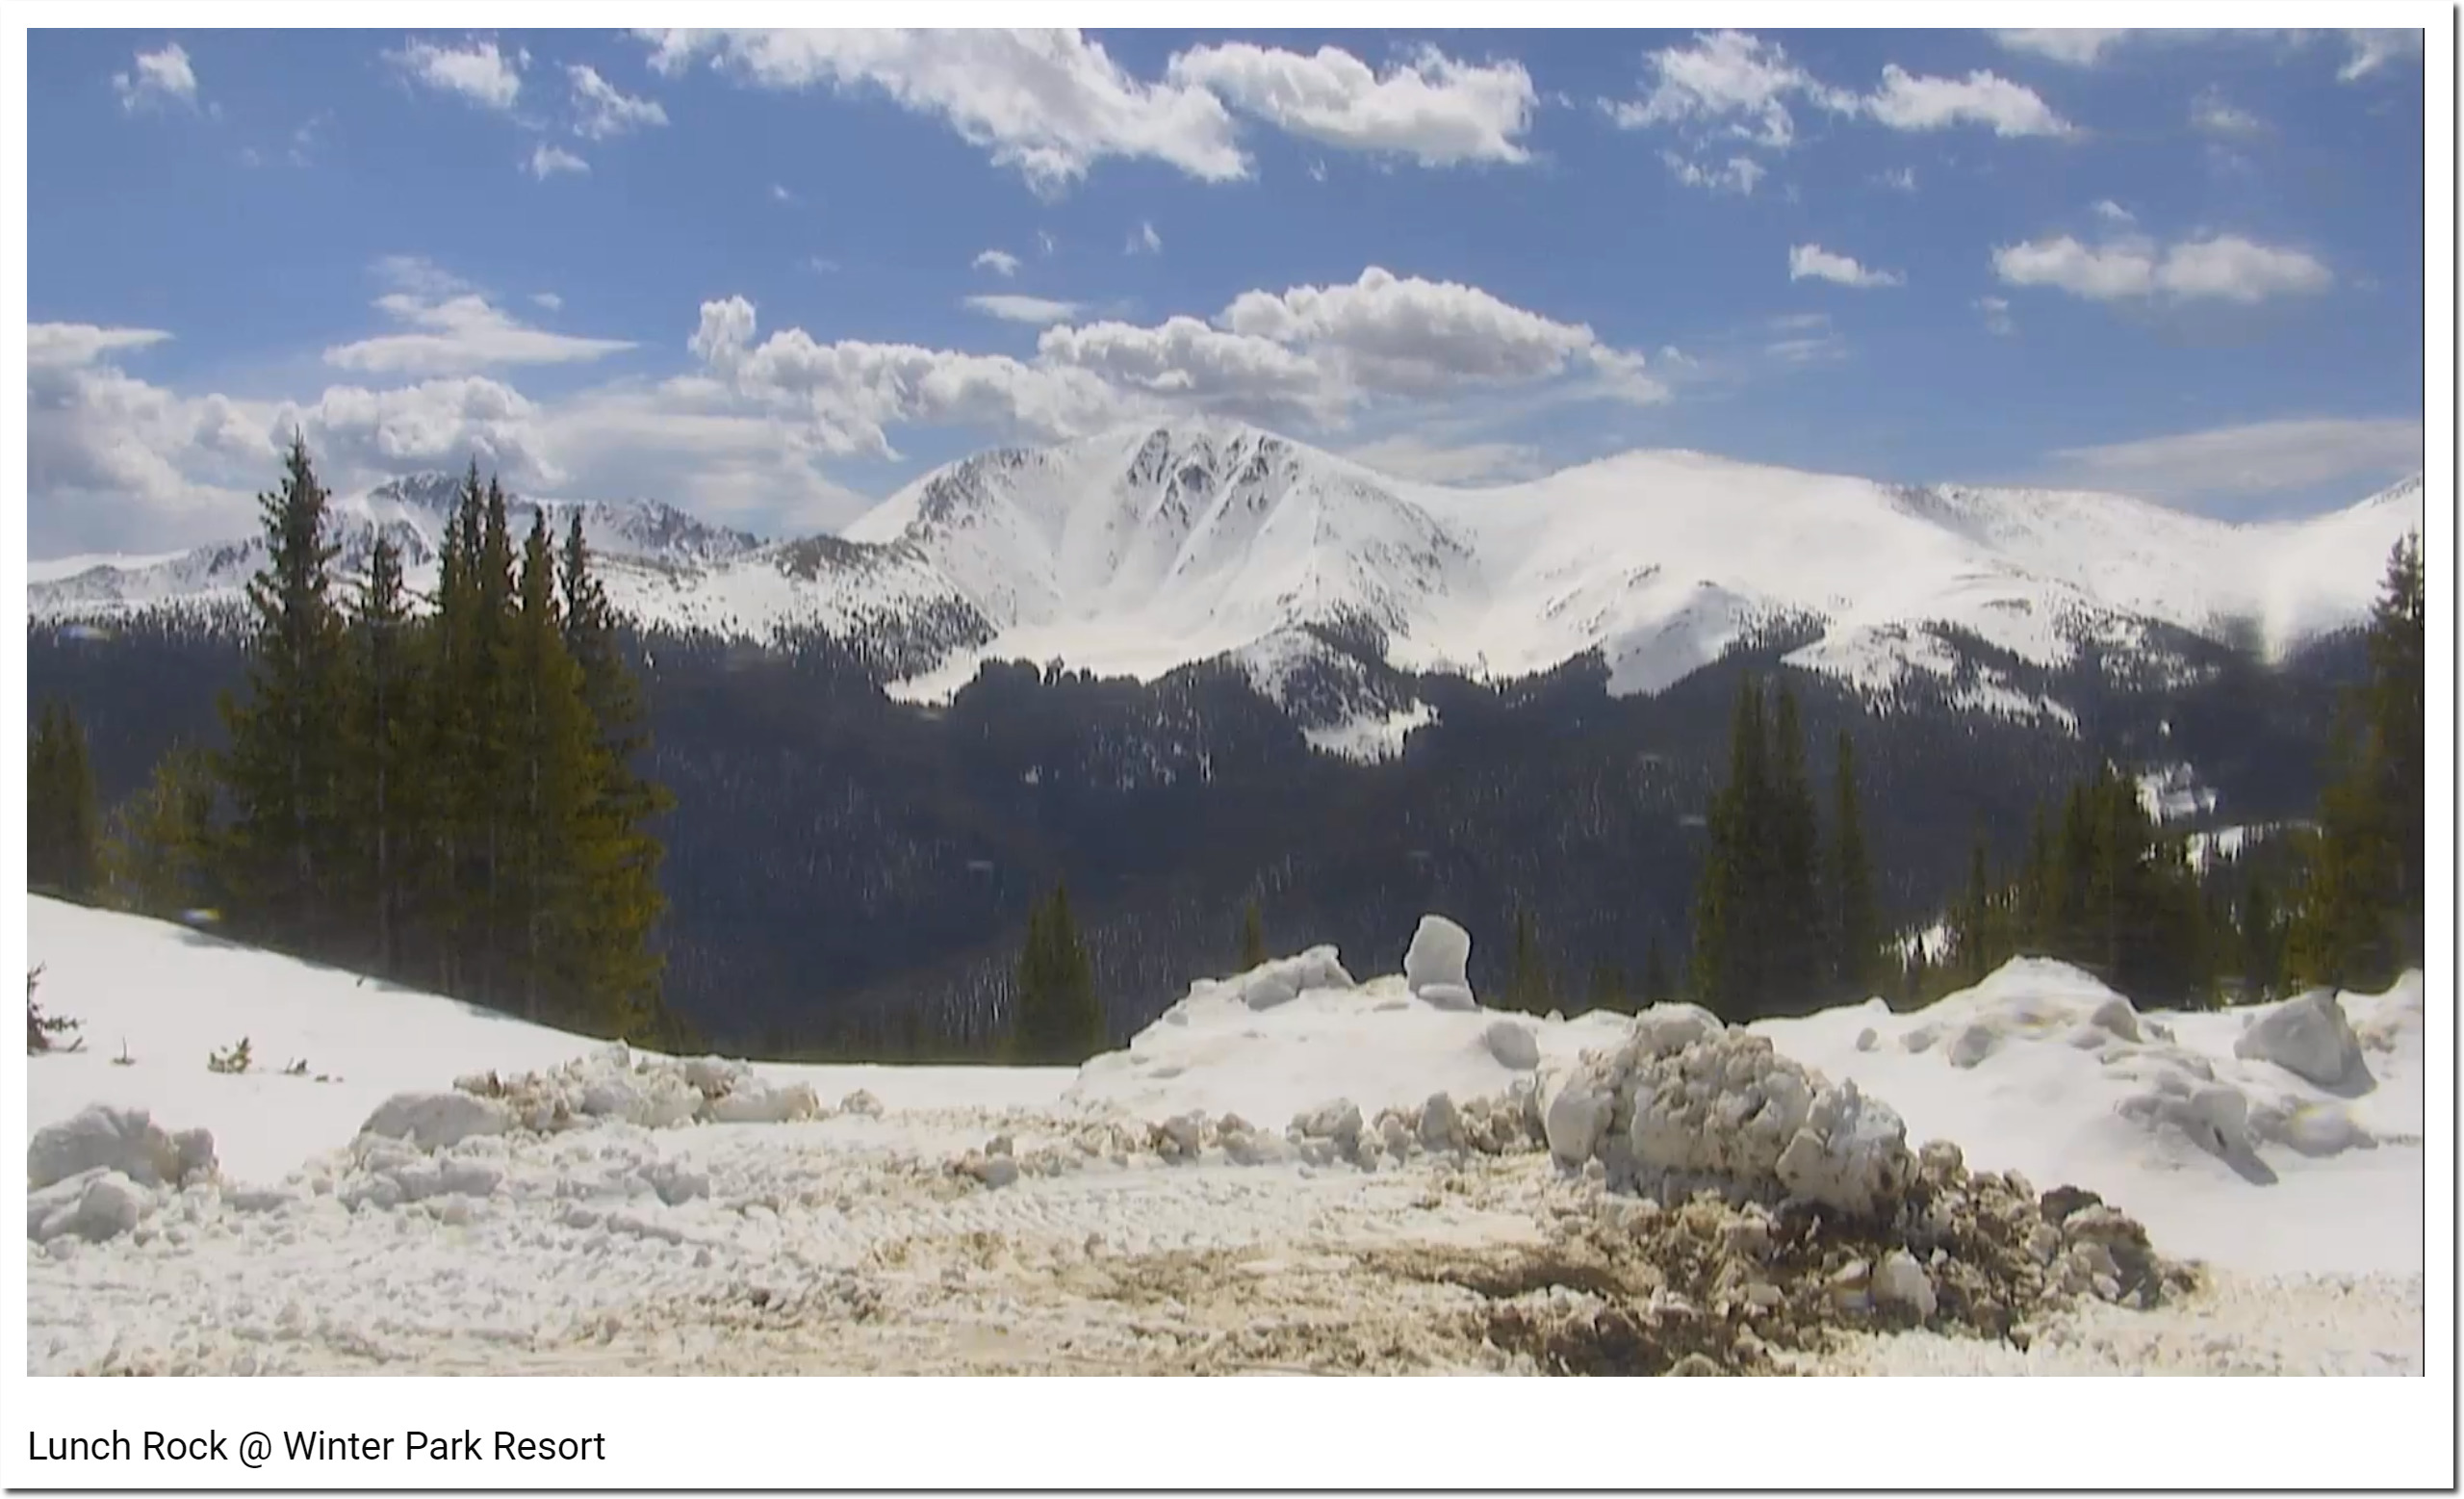
Some years I go hiking the first weekend in June in the high country. Not a chance of that this year.
There is no longer any need for comedians. We now have climate experts in Congress.
