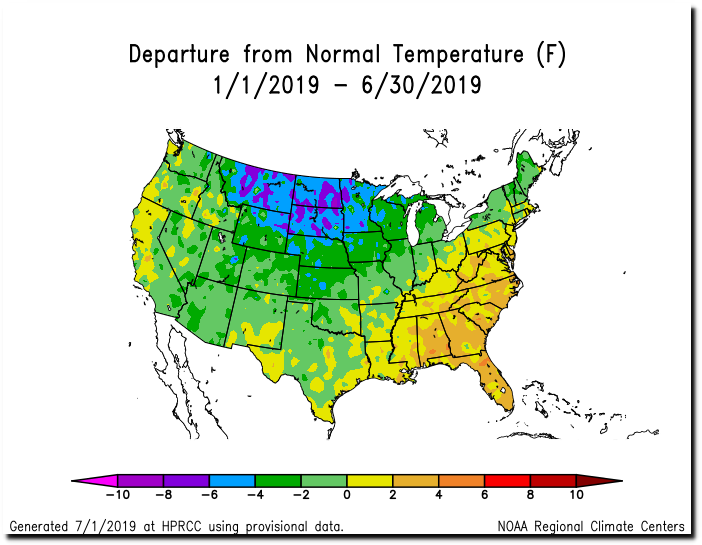
Sixty-nine percent of the US has averaged below normal temperature this year, with thirty-four percent more than two degrees below normal.
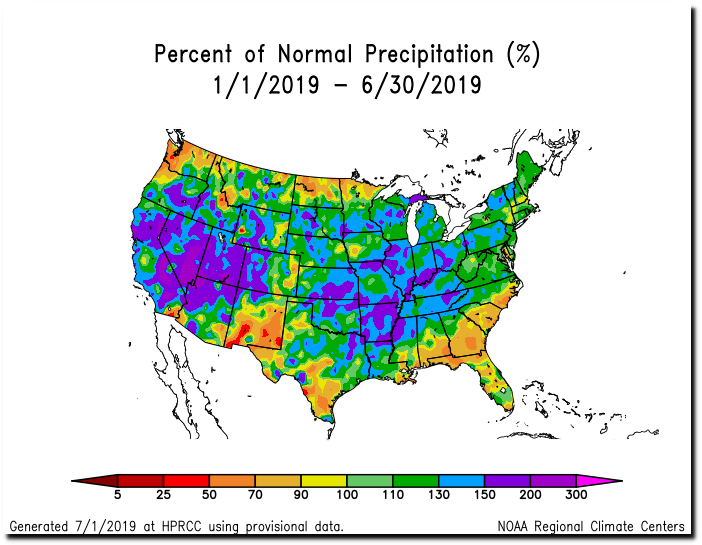
Seventy-nine percent of the US has been above normal precipitation , and seventy-three percent of the US has been more than 110% of normal precipitation. The exact opposite of claims by climate alarmists, wet weather is associated with cool air – not warm air.
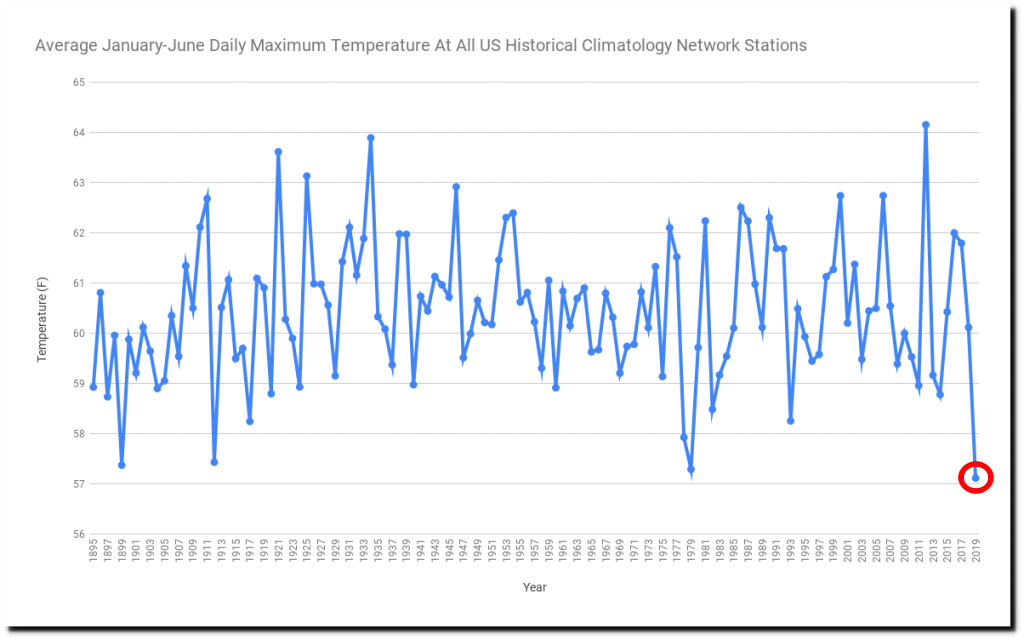
The average maximum daily temperature in the US has been coolest on record this year, more than seven degrees cooler than the record high year of 2012 – which had a lot of mild winter/spring days.
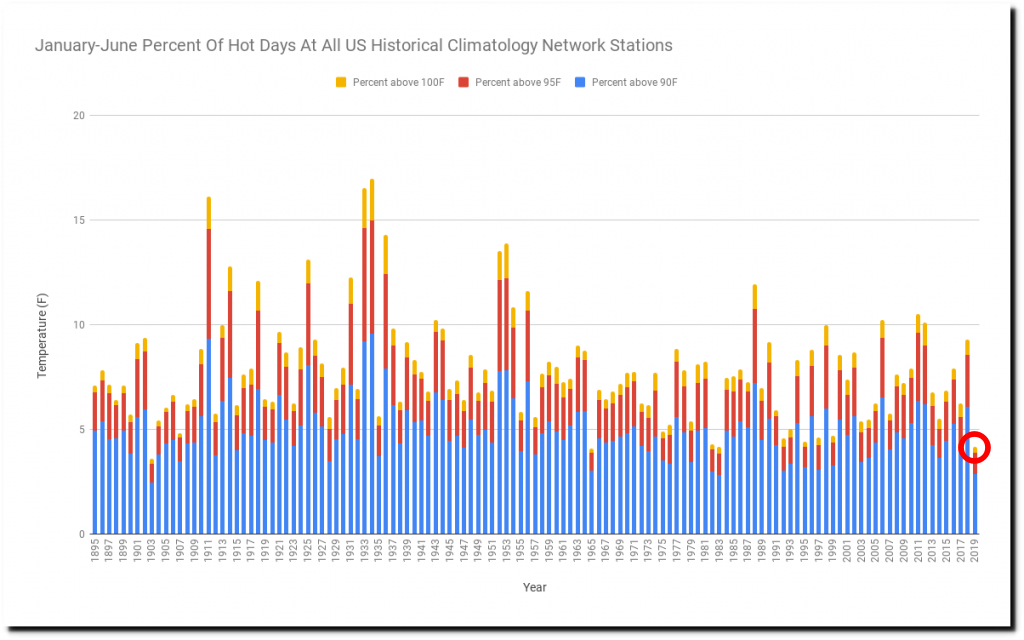
The percent of days over 80F is lowest on record by a wide margin, way down from the record year of 1934.
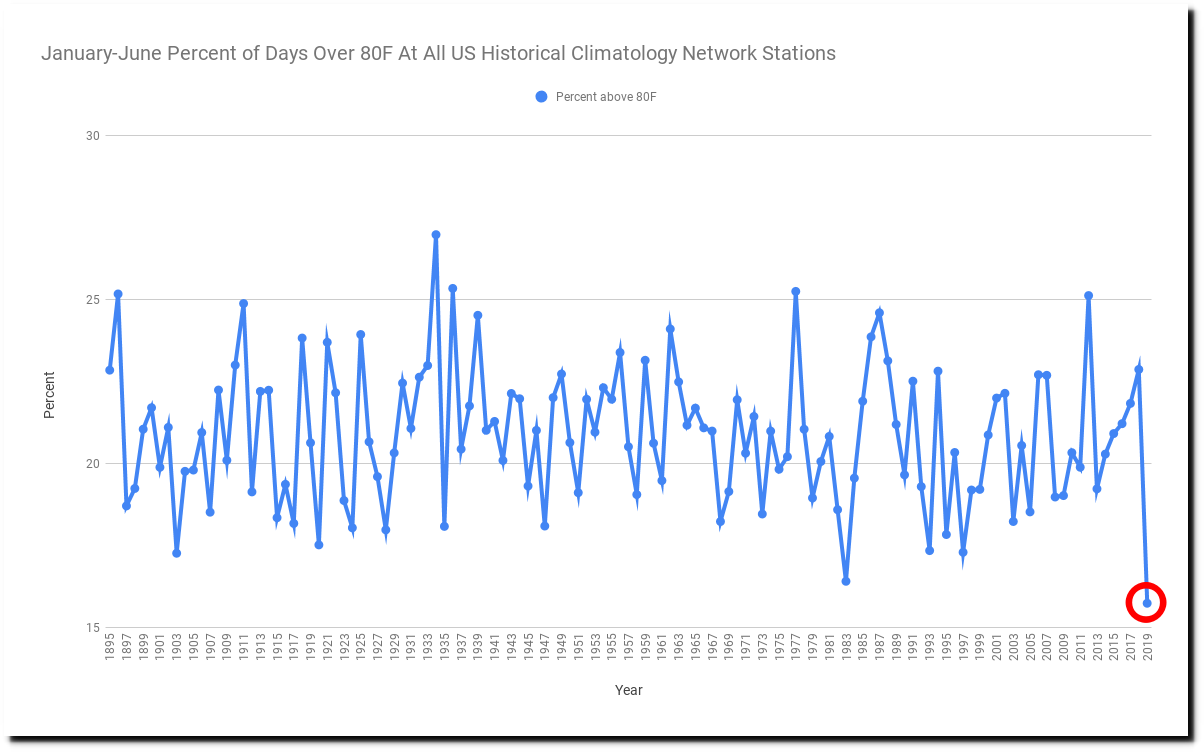
The number of hot days has plummeted since the 1930s. The last really hot year was 1988, when CO2 was below 350 PPM.
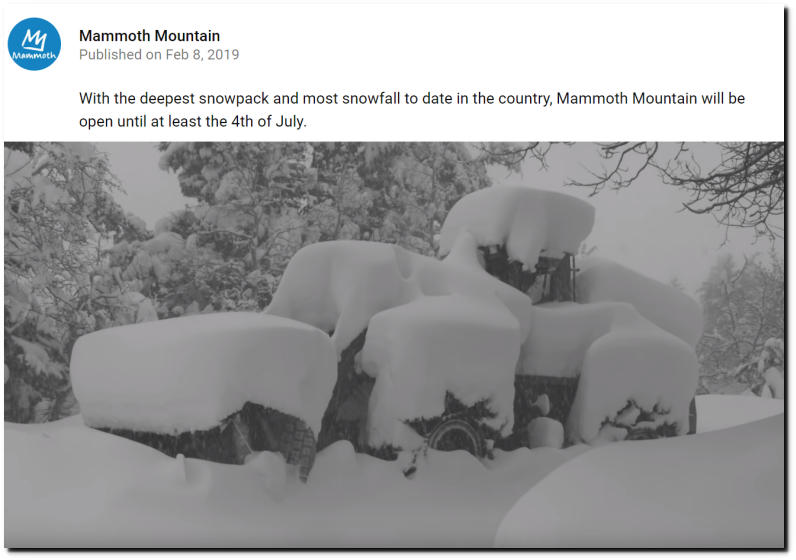
As a result of the cold, wet weather – lots of ski areas will be open on July 4th.
This comes five years since the New York Times announced the end of snow.
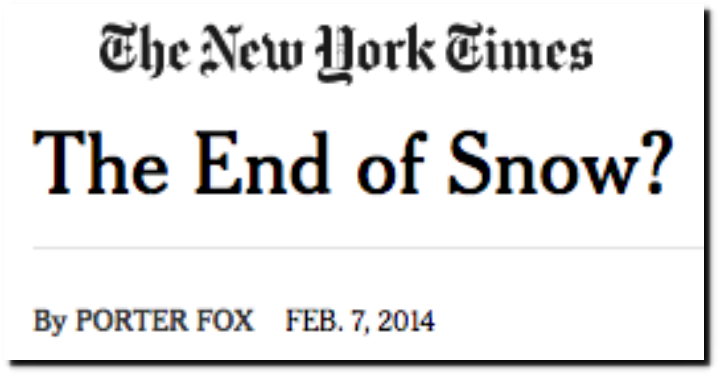
The End of Snow? – The New York Times
And thirteen years since they announced the endless summer.
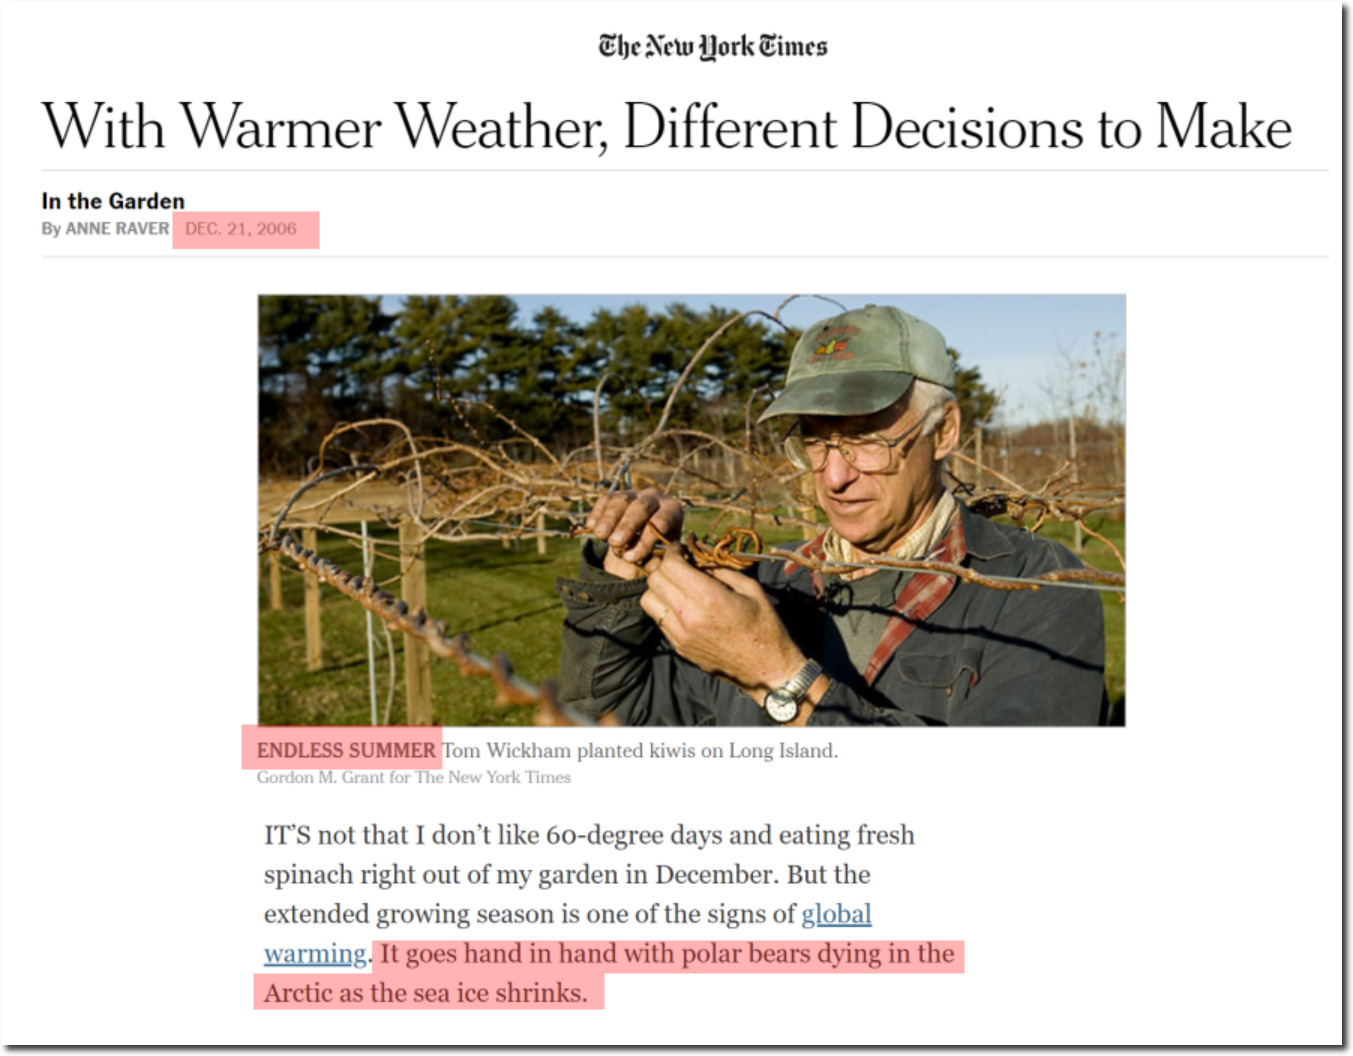
With Warmer Weather, Different Decisions to Make – New York Times
And it has been almost nineteen years since The Independent and CRU announced that snow is a thing of the past.
Snowfalls are now just a thing of the past – Environment – The Independent
So how did climate scientists and the press react to the record cold and their past failures? By ignoring it and announcing the hottest month ever.
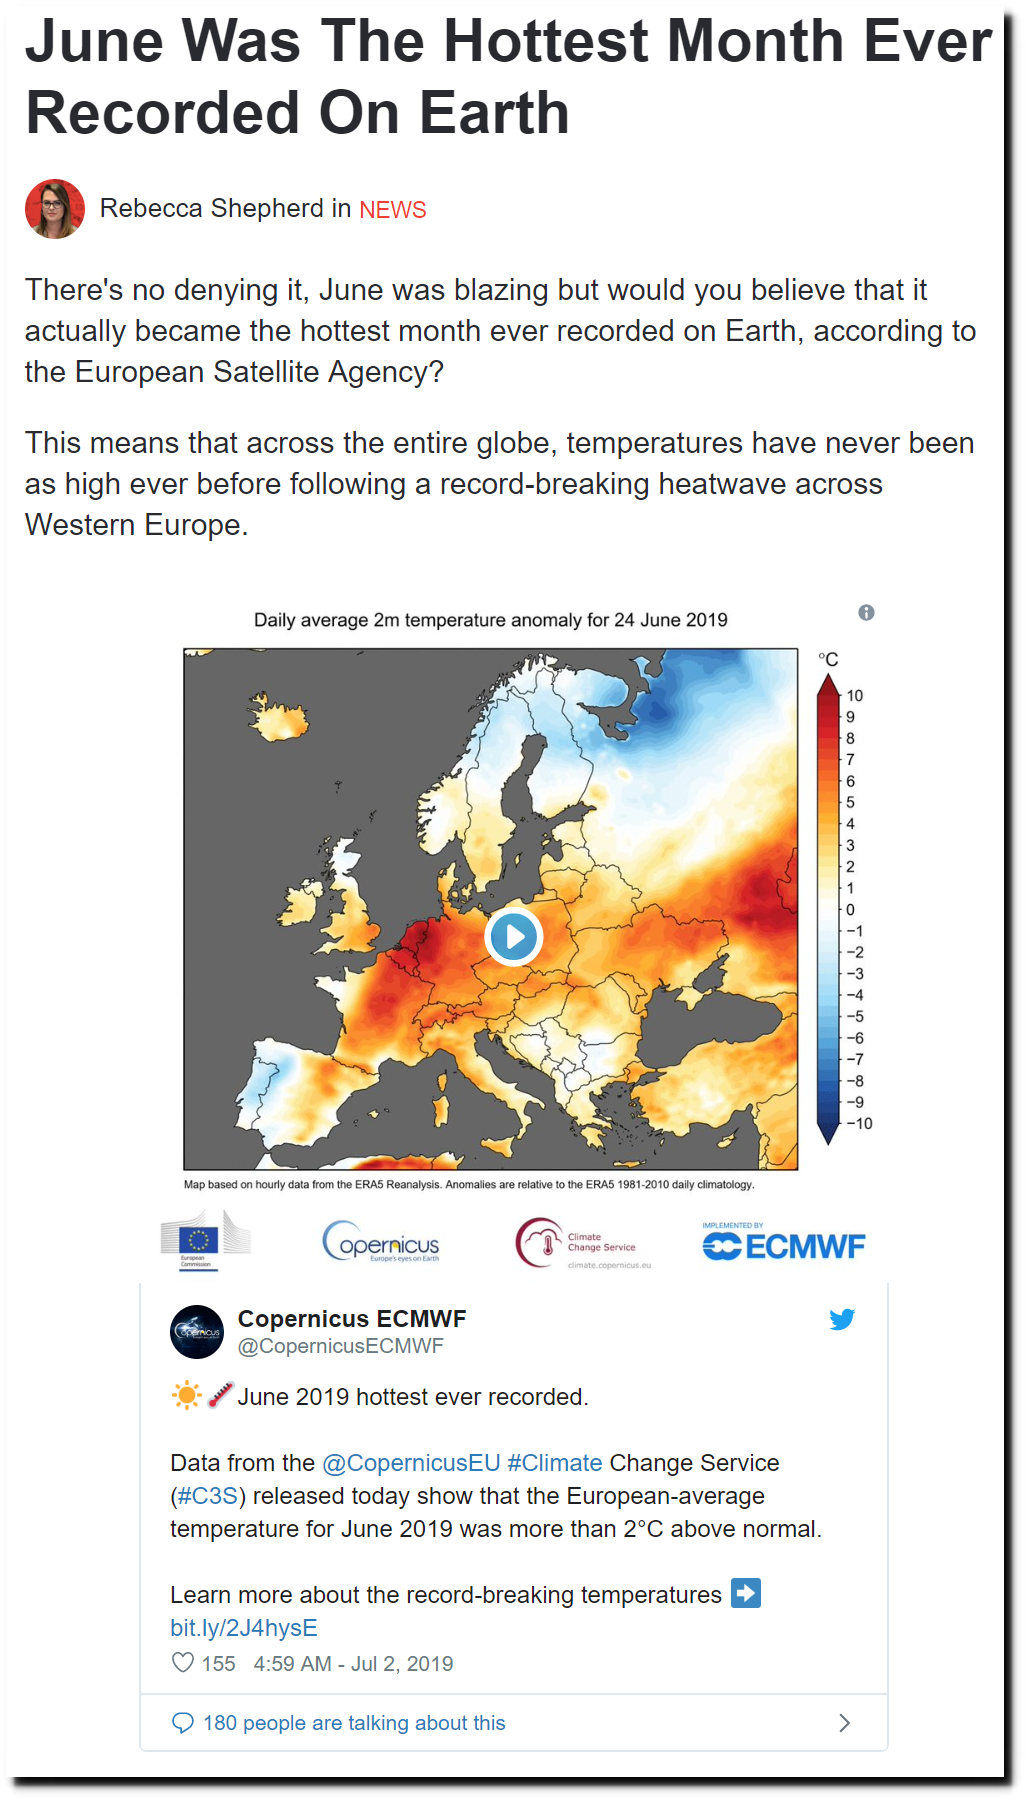
June Was The Hottest Month Ever Recorded On Earth – LADbible
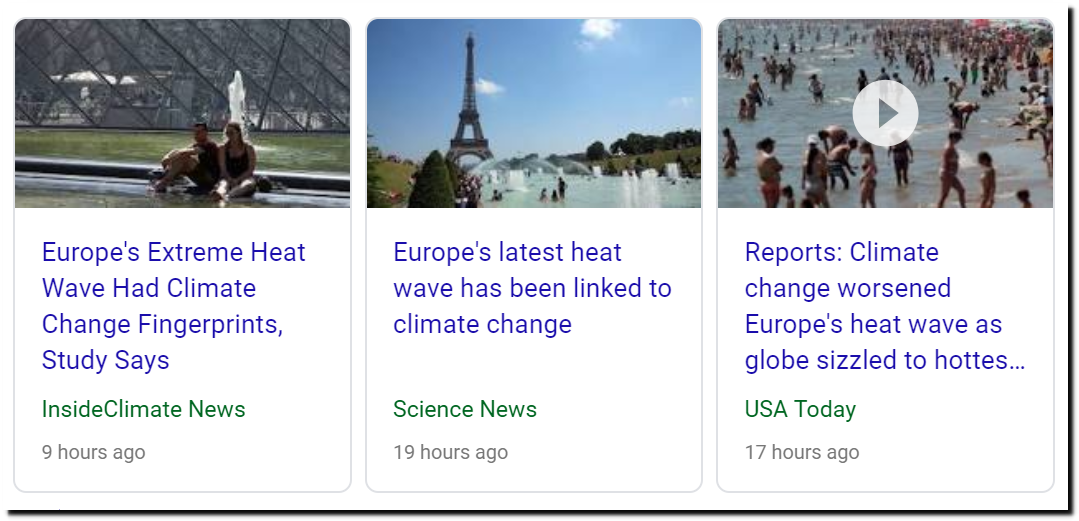
And they linked the record hot weather in Paris to climate change.
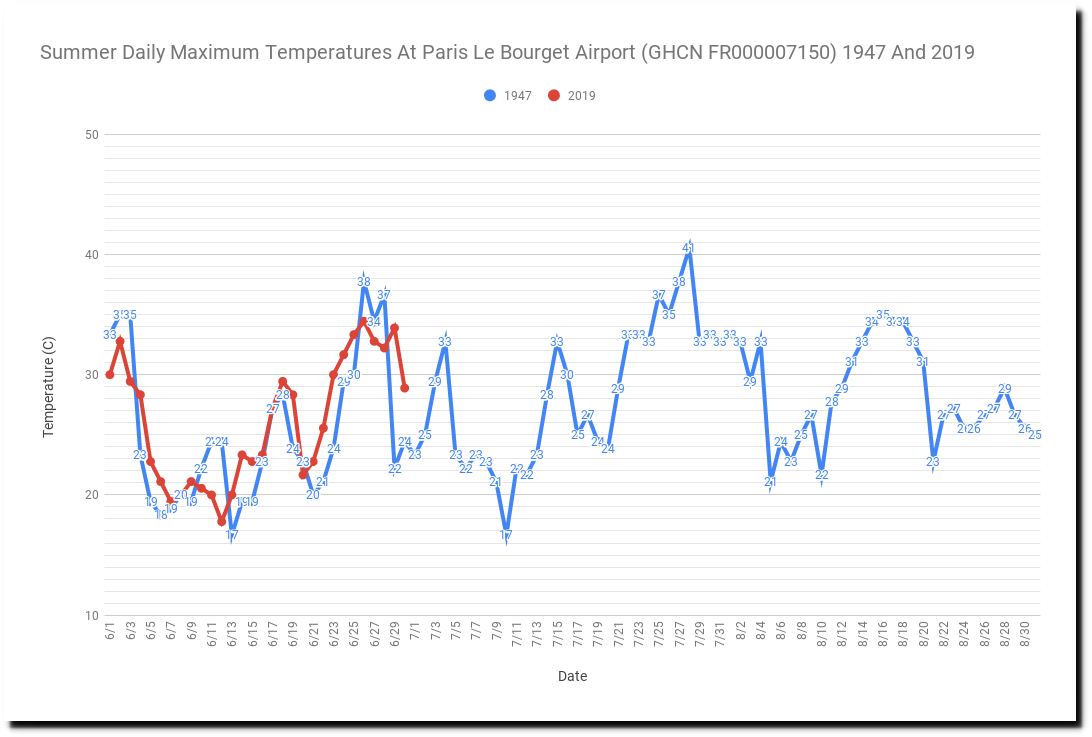
Paris was much hotter in June, 1947.
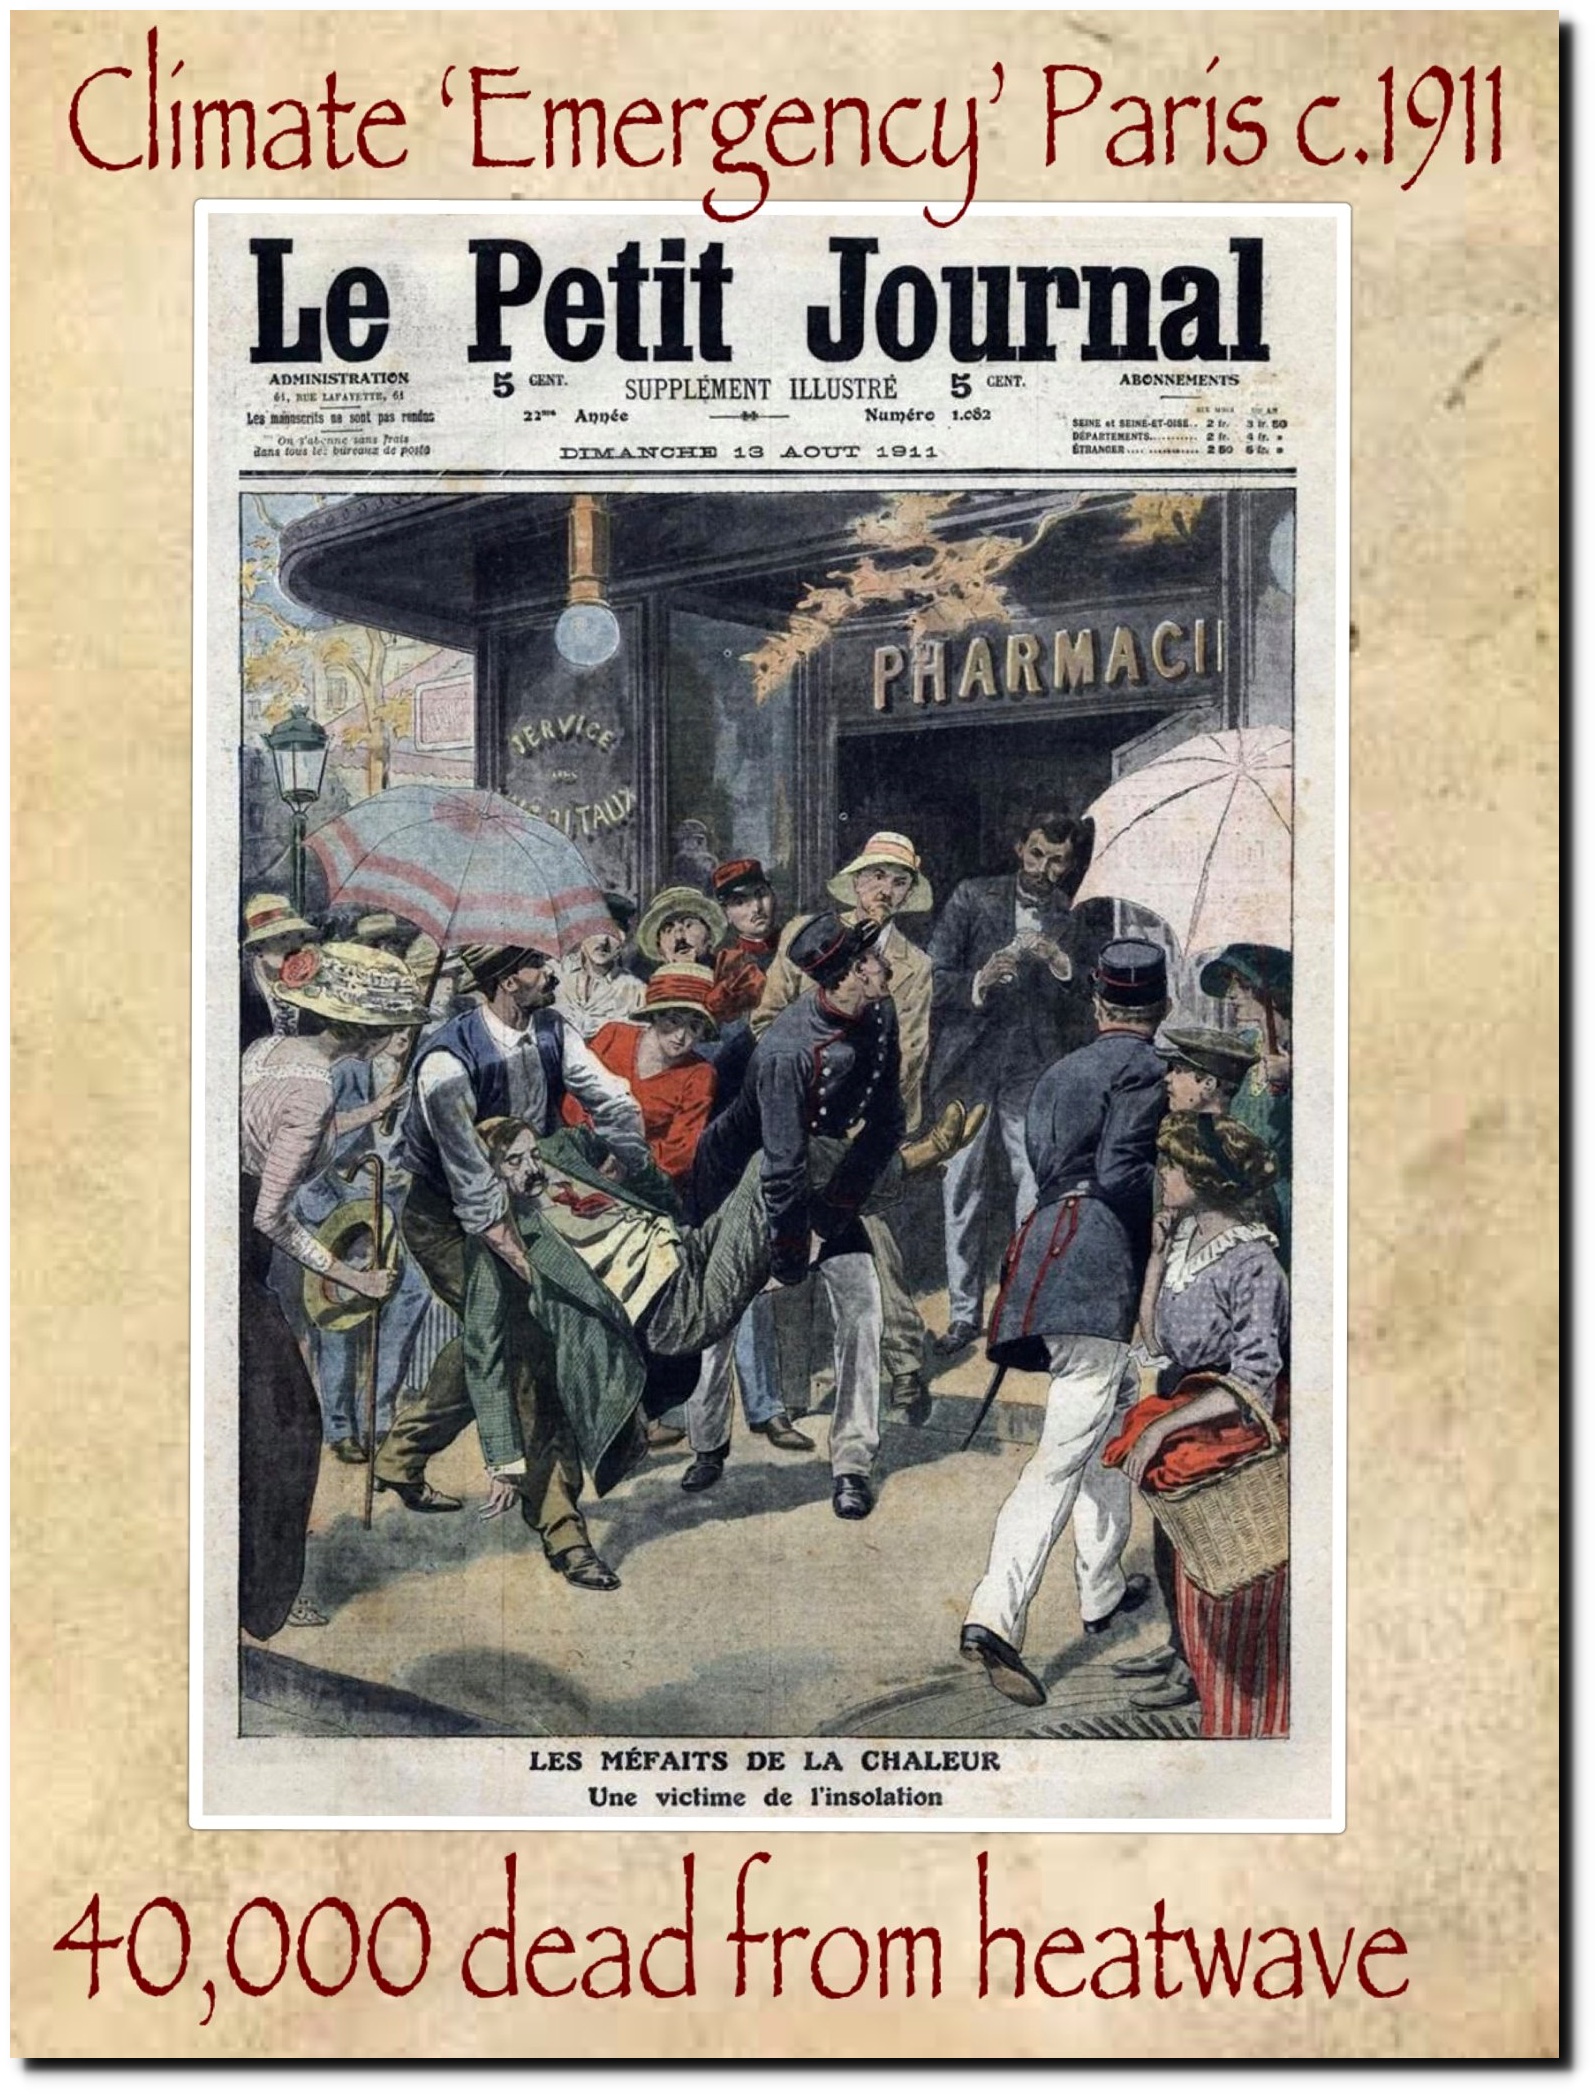
In 1911, 40,000 people died from a 70 day long heatwave – unlike five day long heatwave of 2019. Apparently that was not caused by climate change.
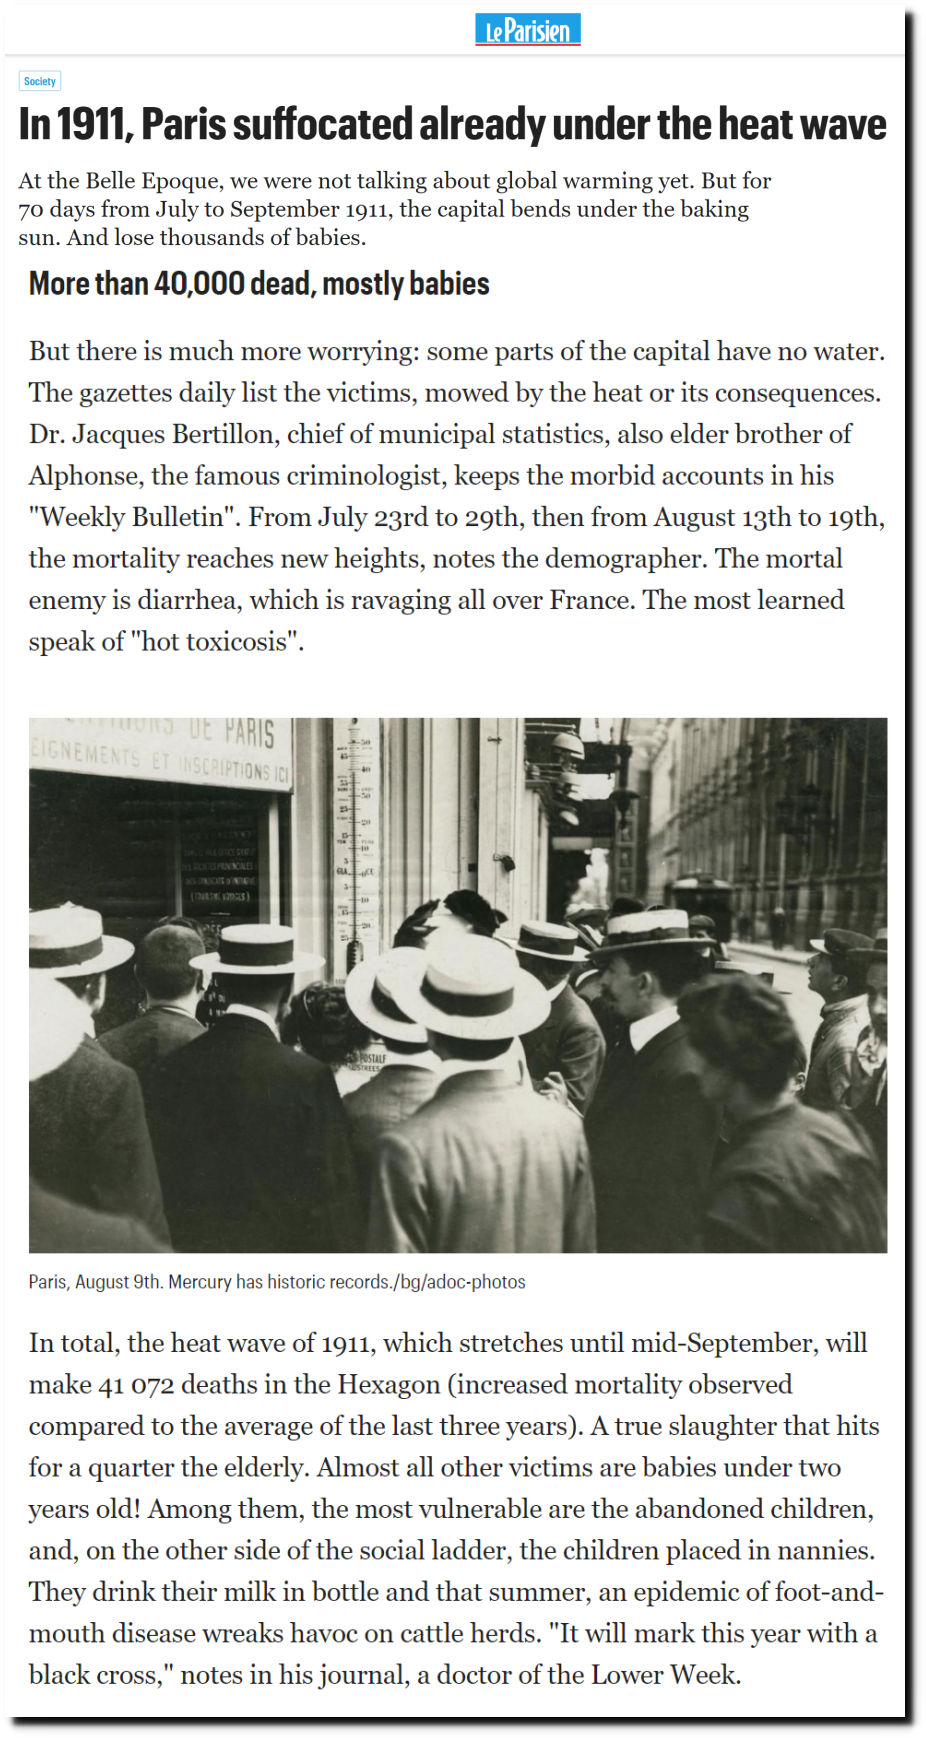
En 1911, Paris suffoquait déjà sous la canicule – Le Parisien
Europe has a long history of hot weather, which climate scientists and the press choose to ignore.
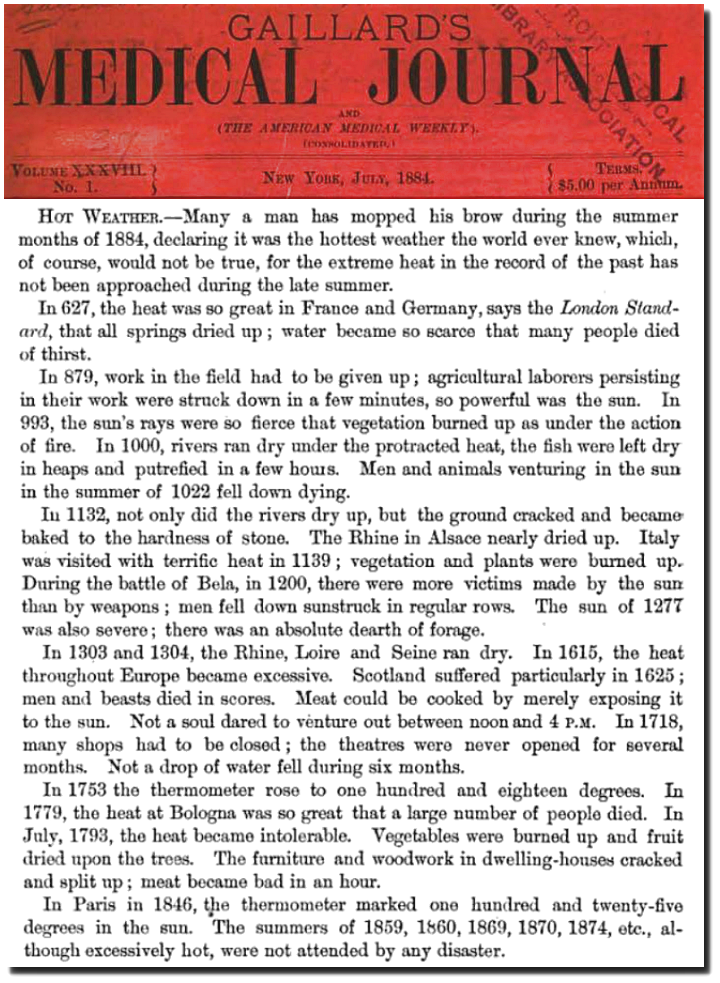
Gaillard’s Medical Journal – Google Books
21 Aug 1901, Page 3 – Shelby County Herald at Newspapers.com
Global temperatures were nowhere near a record.
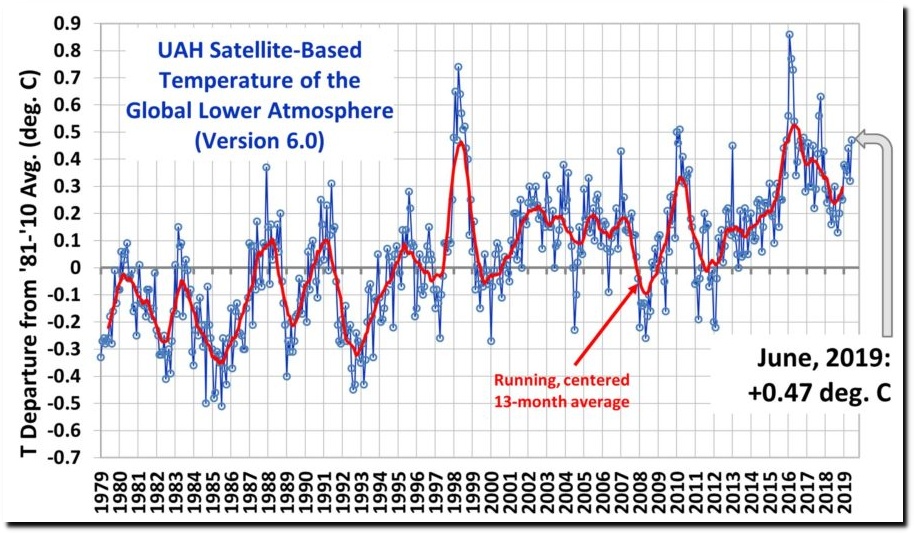
Latest Global Temps « Roy Spencer, PhD
The Washington Post claimed last week that the Arctic and Greenland had record melting in June.
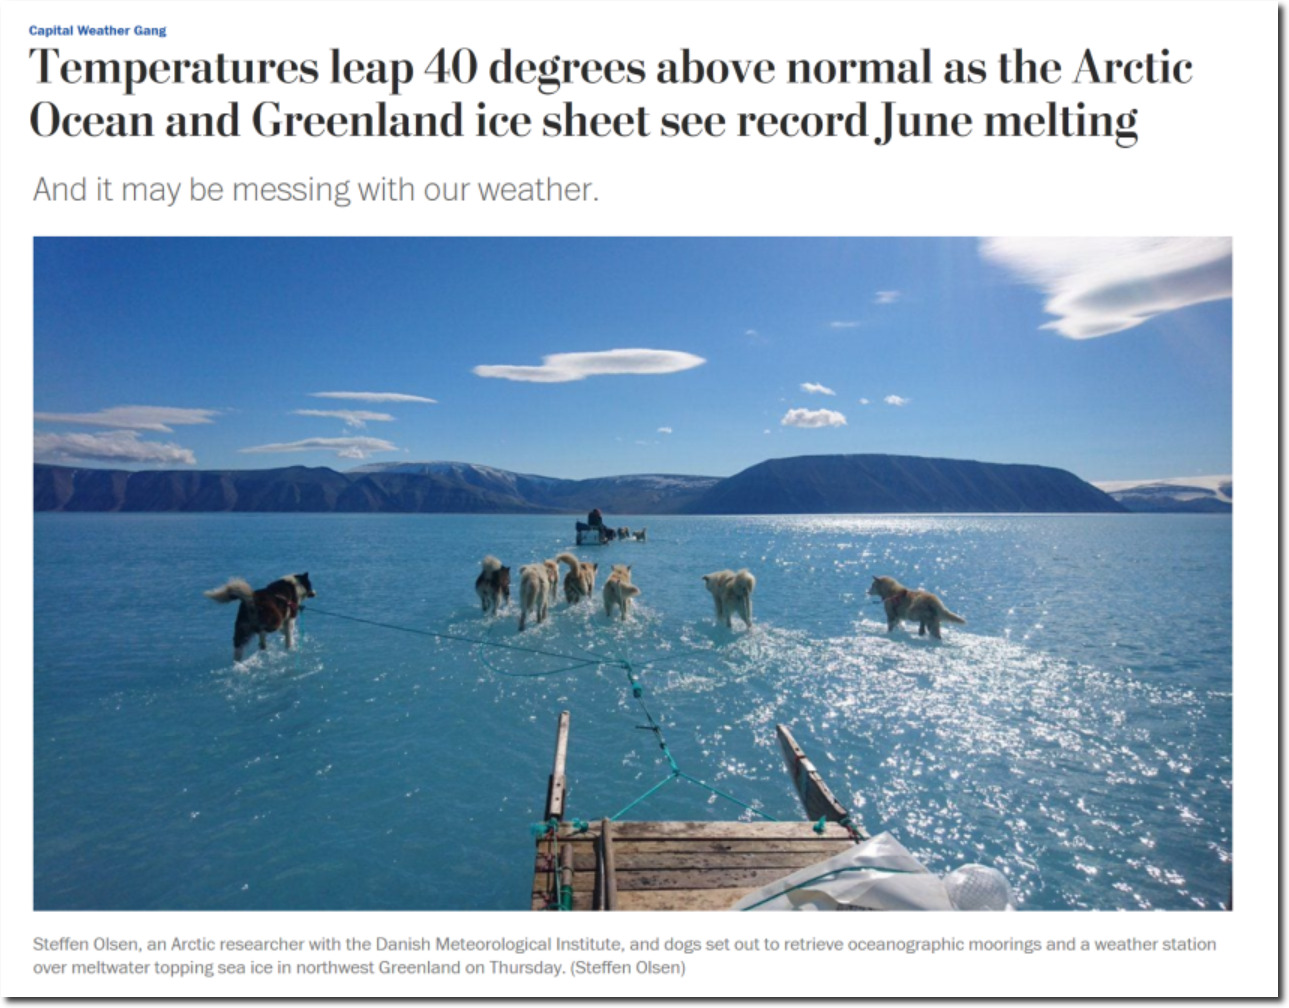
June melt in Greenland was less than half of 2012.
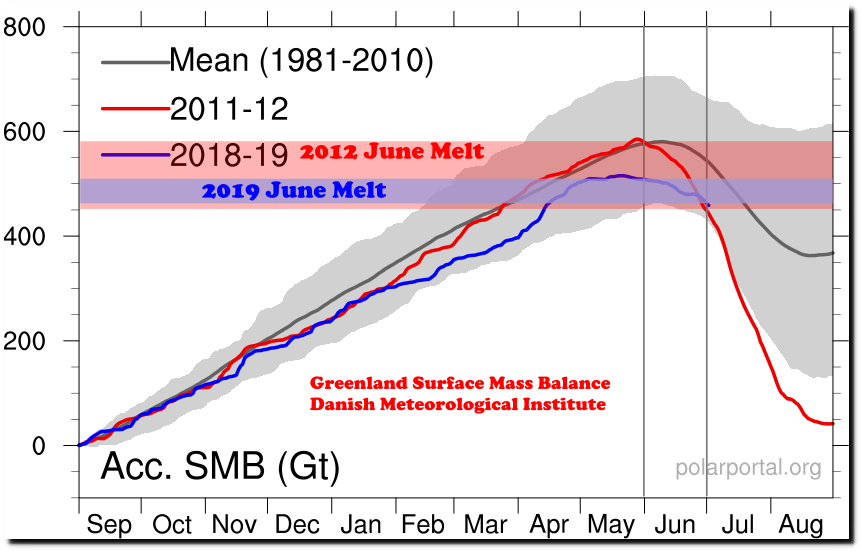
Surface Conditions: Polar Portal
The Washington Post believes that two days of mild weather in Greenland is climate, but 130 years of US temperature data is irrelevant.
Similarly, June 2012 sea ice melt was much larger than this year.
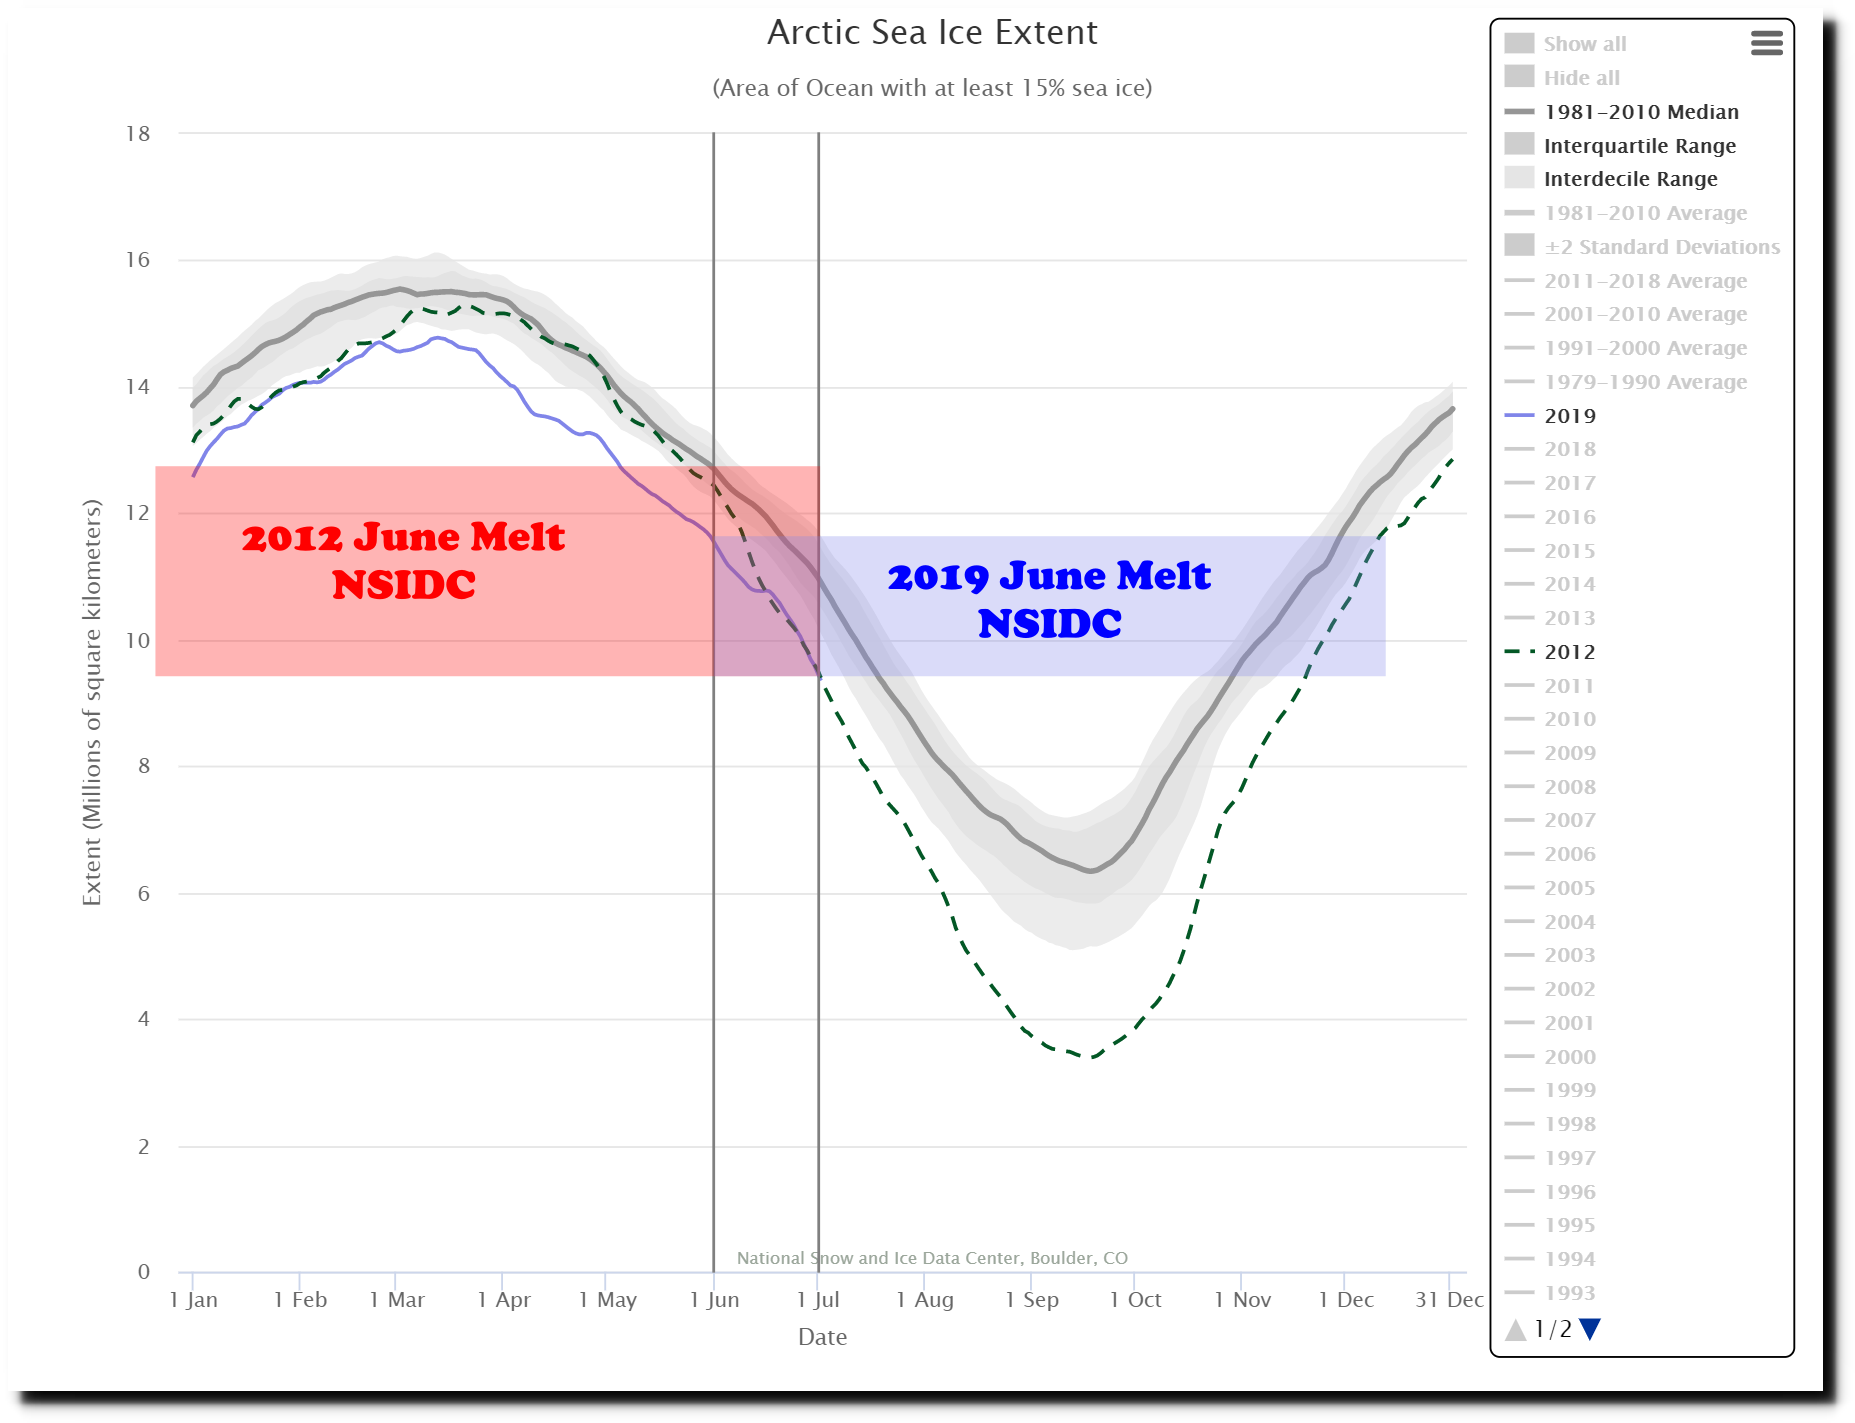
Charctic Interactive Sea Ice Graph | Arctic Sea Ice News and Analysis
Climate scientists and the press lie constantly about the climate, because this is about taking control of public policy – just as Eisenhower warned.
The prospect of domination of the nation’s scholars by Federal employment, project allocations, and the power of money is ever present — and is gravely to be regarded.
Yet, in holding scientific research and discovery in respect, as we should, we must also be alert to the equal and opposite danger that public policy could itself become the captive of a scientific-technological elite.
- President Eisenhower January 17, 1961
Excellent post, Tony! Thanks! Eisenhower’s statement shows that the left never dies, it only naps.
Tony
FYI – About that French record hot
“PeterPetrum
July 3, 2019 at 11:22 pm · Reply
I said it before in a previous thread and I’ll say it again here. We are in Provence at the moment, in a small village close to Gordes. (It’s a tough life but some of us have to make these sacrifices to bring you REAL weather reports!). On the day when Montpellier, about 100k WSW of us, was said to be at 45.5degC we only reached 36C (and the pool was lovely, thank you).
I noted that one of the US satellite guys was trying to find out which thermometer logged this temperature, but was having difficulty. I saw a short excerpt in a local paper that it was a temperature reported by a “citizen” to a paper which then became the official temperature quoted world wide.
However – now it’s official!!”
http://joannenova.com.au/2019/07/not-the-hottest-ever-june-1998-was-hotter-and-so-was-most-of-the-holocene/#comment-2156862
Ian, Very good. Thank you for the reporter-on-location reality check.
Last friday we visited my parents. When we were in the surroundings of Girona (Catalunya (and sadly still spain) ) on the tollway AP7 the car’s outside temperature indicator showed 44,5 ºC. Just when we left the tollway it dropped to 41,0 ªC and when we reached my parent’s home (3km inland) 25 min later it showed 38,5 ºC. (No swimming pool)
Sea surface temperature made a big jump.
http://www.meteo.cat/wpweb/climatologia/el-clima-ara/temperatura-del-mar/
So it was finally warm enough to have a swim. Trouble was it was ‘dirty’ yellow brown because wind came from the south bringing the river water from the Ter.
But the principle cause is the low (cold) pressure system moving further south over the Atlantic when most commonly we have a high pressure system over the Azores this time of the year.
https://earth.nullschool.net/#2019/06/25/0900Z/wind/isobaric/700hPa/overlay=temp/orthographic=-10.99,31.27,747/loc=-80.810,44.581
*mic drop* Just ‘wow’–that’s an awesome post.
Have a great 4th, Tony (and everyone else)!
Lots of great stuff, thanks.
~ ~ ~
Is there such a thing as a “cool wave”?
Up here in central Washington State we seem to be in a Cool Wave.
Not “cold” as it was about 70 yesterday and 80 today, but if we were in the mid-90s for a week no one would be surprised.
Some more mountain precip would be nice, but the low temps compensate.
Our trail work group got chased out by a rapidly moving thunder storm on Sunday afternoon. Not much happened, but rules are rules; and we only left 45 minutes early.
These are common storms, not much happens — but they can build into dangerous events.
Again, thanks for all the historic material.
‘This means that across the entire globe, temperatures have never been as high ever before following a record-breaking heatwave across Western Europe.’
Wut? This doesn’t even make any sense.
Here in the southeast U.S. part of the globe, we had one of the mildest June’s we’ve had in years. It was GREAT!
‘There’s no denying it, June was blazing but would you believe that it actually became the hottest month ever recorded on Earth, according to the European Satellite Agency?’
No, I wouldn’t believe it.
Another Tour de Force. Excellent.
Interesting how MSM seems to live in a parallel universe. Wonder why that is?
Because they do? For the most part if I walked by and saw any of them on fire, I wouldn’t even stop to pee on them.
I shall check whether there is still snow at A-basin.
There’s that deceptive word “normal” being used again when comparing today’s temp to the historical. They just refuse to use the word “average” don’t they? They know if they say “average” then there is no normal and the temperature comparison is based on ALL temps taken over a long period and averaged. There is NO normal! When they say “normal” do they mean “median”? No, they are trying to subvert the concept of an ever changing feast of weather variable temps from one day and year to the next.
Worse, if you can convince the public that there is such a thing as “normal” weather and climate, you can convince them that everything else is “abnormal”.
He who controls the language controls thought.
Macron has to learn from Trump how to get rid of warming.
Leave Paris?
Macron doesn’t have the stones.
“June melt in Greenland was less than half of 2012”.
A bit deceptive Tony since the graph you show is not surface melt but surface mass balance which is the balance between precipitation and melt. The same site which you got that data from produces a melt graph which is shown below and bears out their statement and refutes yours.
http://polarportal.dk/fileadmin/polarportal/meltarea/MELTA_combine_SM_EN_20190703.png
Ah Phil,
nice to see you,
as i have found some science the way you like it
as climate science(or its quality) is infect… growing and reaching other
superscientific fields and you should be better one of the pioneers
of newscience instead
always trying to catch up with the newest forms of Lysenkoism
https://www.youtube.com/watch?v=eXIis3EcW9A
i hope you was successfull in ignoring the long cold winter
and another bag of failed predictions
so this vid may help.
A bit deceptive Tony since the graph you show is not surface melt but surface mass balance which is the balance between precipitation and melt.
Tony’s graph is clearly marked in bold red letters, “Greenland Surface Mass Balance Danish Meteorological Institute”.
You have serious cognitive issues Phail. Seek help immediately.
Too much corn. Do yourself and the rest of us a favor, Phil. Heed the warning and abstain.
Once again we see American Exceptionalism on display. We grow infinitely more corn, and we thrive.
Happy Independence Day to my countrymen, sorry/not sorry to my limey friends, and good day to the rest of you.
Happy Independence Day to all who love this country and, if you can, have some good American Corn Whiskey or another fine spirit from Lawrenceburg, Indiana!
How Can Different Craft Whiskeys Come From One Big Distillery?
Without the Battle of Culloden there would most likely not have been an independence war. It was the Scottish revenge.
https://allthingsliberty.com/2013/10/scotland-american-revolution/
https://en.wikipedia.org/wiki/Battle_of_Culloden
My ancestors fought for freedom in both conflicts. I am descended from Duncan MacRae…
Among those killed was Duncan MacRae, who as a young man was known for both his superior strength and his tender heart. During the battle, he killed at least seven men with his Claymore before he was shot down by an English trooper. His claymore was exhibited for many years in the Tower of London as “The great Highlander’s sword”.
https://en.wikipedia.org/wiki/Clan_Macrae#18th_and_Jacobite_risings
And it also has 2012 June Melt and 2019 June melt marked on it in red and blue. The unwary might think that those captions originated with the DMI whereas they’re completely bogus ones added by Tony (presumably). The actual data from DMI on surface melt shows it to be the highest June surface melt since 1981
LOL
Phail glosses over his embarrassing cognitive issues, and laughingly keeps attacking Tony.
Phail, once again, the graph clearly states that it is the “Greenland Surface Mass Balance Danish Meteorological Institute”. Quit playing with straw men, they are much more intelligent than you, and they will keep embarrassing you.
Are you an extremely New Earther? 1981? Really? LOL
the graph clearly states that it is the “Greenland Surface Mass Balance Danish Meteorological Institute”.
Yes, but it isn’t, it’s a photoshopped version of the graph with incorrect additions to it claiming to show melt, which they don’t. I’m sure that DMI would be upset to learn that their material was being misused in this way.
Are you an extremely New Earther? 1981? Really? LOL
Tony chose the data source not I.
Nice try at deflection Phail.
Phailed to see the graph was clearly labeled.
Phailed to address Tony’s actual post.
Phailed once again at making a legitimate criticism.
Phailed to bail out his multiple phailures.
Nice try at deflection Phail.
You’re the one who’s deflecting, away from Tony’s deception.
Phailed to see the graph was clearly labeled.
Pointed out that it was an incorrectly labelled fake graph.
Phailed to address Tony’s actual post.
I pointed out that he had not produced any data on melt to support his statement.
Phailed once again at making a legitimate criticism.
Showing that Tony made an assertion without any valid data to support it is a legitimate criticism.
Phailed to bail out his multiple phailures.
Tony’s you mean I assume.
Phailed to accept his phailure. Never Phails to never admit when he wrong. Poor Phail.
Apparently Phil thinks that the best metric for determining the amount of ice is surface melt. But will change because It’s always the same with these people. Which ever ice metric is lowest at the time is the only one anyone should be talking about. Just like which ever place has higher than average temperatures is always climate and never mind the lower than average temps as they have done concerning the recent heat wave in Europe.
But when it comes to extremes in the metrics of water level too much is bad now when only seven years earlier too little was bad as in the case of the Great Lakes.
But they never set a standard for what is ideal for temperature, water levels, or ice amount and extent.
rah says:
July 4, 2019 at 6:28 pm
Apparently Phil thinks that the best metric for determining the amount of ice is surface melt. But will change because It’s always the same with these people. Which ever ice metric is lowest at the time is the only one anyone should be talking about.
No, it was Tony who specifically referred to ‘June melt in Greenland’ but illustrated it with a graph of SMB, I pointed out that was more relevant to use a graph of surface melt from the same source.
Hey Phil., ““June melt in Greenland was less than half of 2012”. A bit deceptive Tony since the graph you show is not surface melt but surface mass balance which is the balance between precipitation and melt.”
I went to the link you added, http://polarportal.dk/fileadmin/polarportal/meltarea/MELTA_combine_SM_EN_20190703.png
expecting to learn something but was sorely disappointed. The graph you linked to does not at all show surface melt, but simply shows the AREA of surface melt. The area of melt and the amount of melt are two very different things, and of the two, only the amount of melt really has any importance. I find it difficult to believe that you would have any real confusion about such a straightforward difference. Shame on you.
The graph you linked to does not at all show surface melt, but simply shows the AREA of surface melt. The area of melt and the amount of melt are two very different things, and of the two, only the amount of melt really has any importance. I find it difficult to believe that you would have any real confusion about such a straightforward difference.
The original graph shown by Tony does not show surface melt, rather it shows the difference between precipitation and melt. I don’t see you criticizing Tony for conflating the two. Currently DMI shows the net loss at the highest for the date, ~8Gt/day. They state that over the last few days that “the ablation at the surface of the Greenland Ice Sheet was more than 20 gigatonnes of ice”.
Phail, why are you so perpetually CONFUSED?
So Funny to see you doubling down on your Phailure to comprehend.
Please keep going, you are great as a comedy act. :-)
One thing to note is that the “average” daily low temperatures are rising. So here in Vermont, US zone 4 (-25) our lowest temperature this past winter was only -10.
That is an obvious UHI artifact.
Tony – Can you post links for the USHCN data that you start off with. I can confirm that USCRN says coldest since USCRN started in 2004. (June is known but not published officially yet.)
But, I cant replicate your USHCN graph.
Here is my data source: https://www.ncdc.noaa.gov/temp-and-precip/national-temperature-index/time-series?datasets%5B%5D=uscrn¶meter=anom-tavg&time_scale=p12&begyear=2004&endyear=2019&month=6
That is because you are looking at adjusted (tampered) data. I’m using the raw data from NOAA.
I get that they tamper with the data. I understand there are several unadjusted data sets along with “homogenized, adjusted, and cleaned” data sets. But, I need all of my data to be from original sources and so links to what you are looking at would be helpful.
Why not just download his Unhiding The Decline software up top?
Great data as always! You da man! Here in West Texas overnight we had several inches of rain and the daily high looks like it’s gonna be in the 80s – again. We almost can’t stand it, so we might have to go on up to Colorado for some summer skiing to beat this ‘hellish’ heat.
Climate change indeed.
This bares closer scrutiny…. https://www.geoengineeringwatch.org/
How does the first 6 months look including Alaska and Hawaii? Or perhaps better, North America? Still the same overall assessment that this year is cooler? Thanks