It’s Not Your Imagination – The New York Times Is Getting More Dishonest

It’s Not Your Imagination. Summers Are Getting Hotter. Extraordinarily hot summers — the kind that were virtually unheard-of in the 1950s — have become commonplace.

It’s Not Your Imagination. Summers Are Getting Hotter. – The New York Times

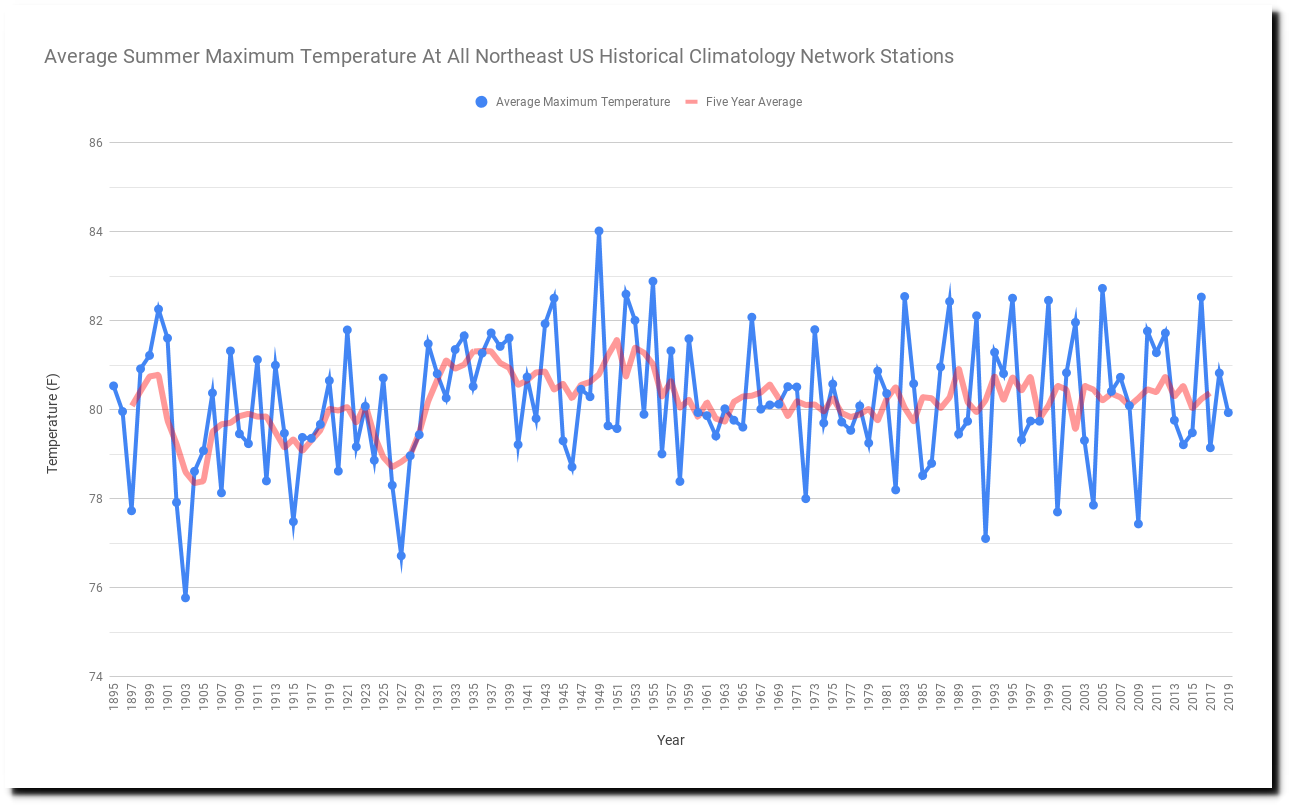
The New York Times claims are the exact opposite of reality. The hottest summer in the Northeast was 1949, and the second hottest was 1955. There is no indication that summers in the Northeast are getting hotter.

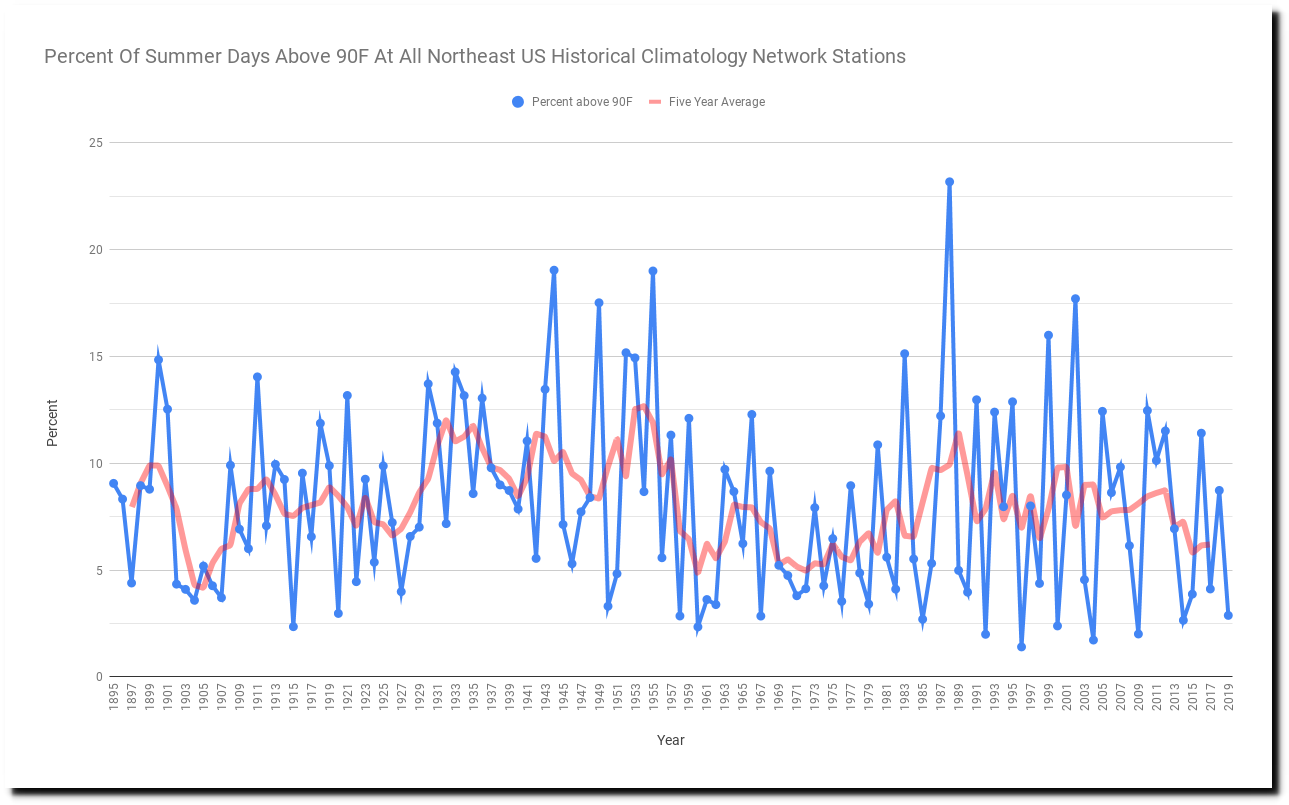
The frequency of hot days in the Northeast has generally been low since the 1950s, with the notable exception of 1988, 1999 and 2002. Recent summers have been among the coolest on record.

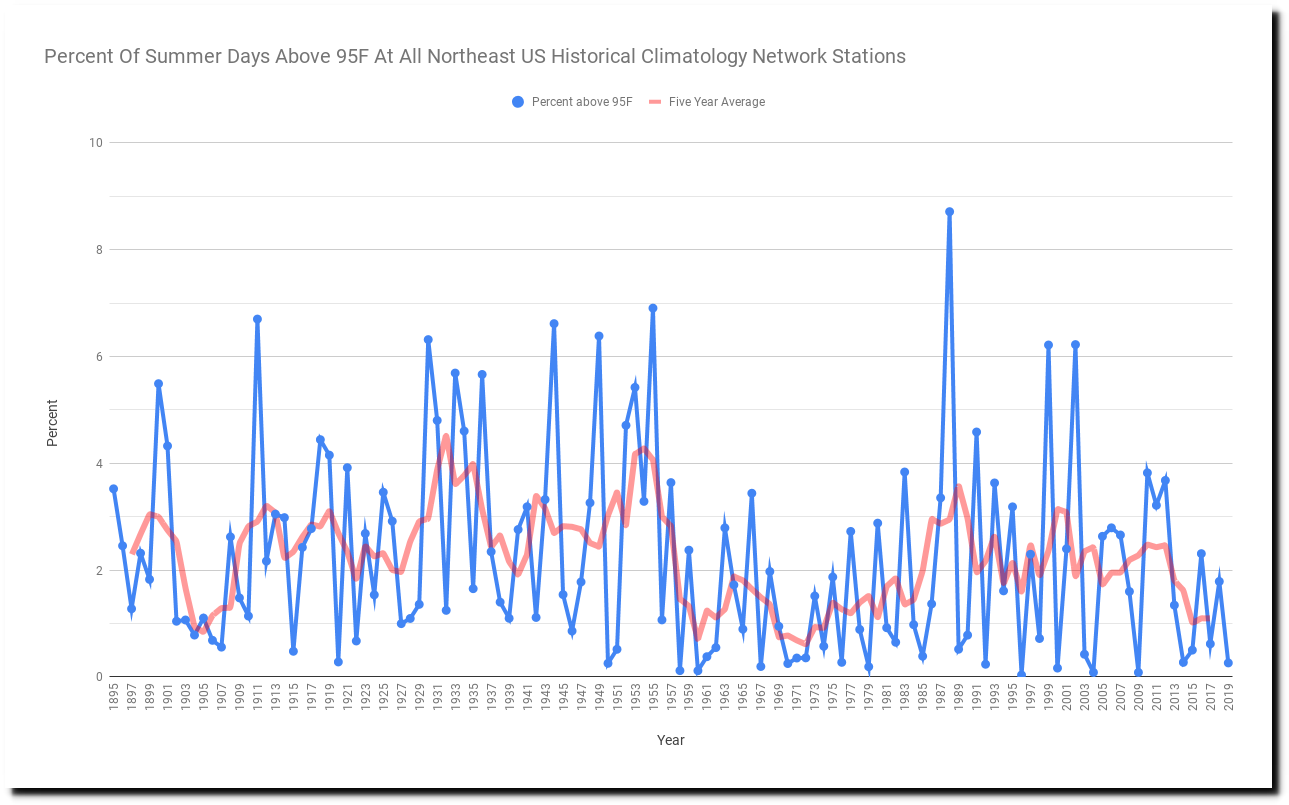
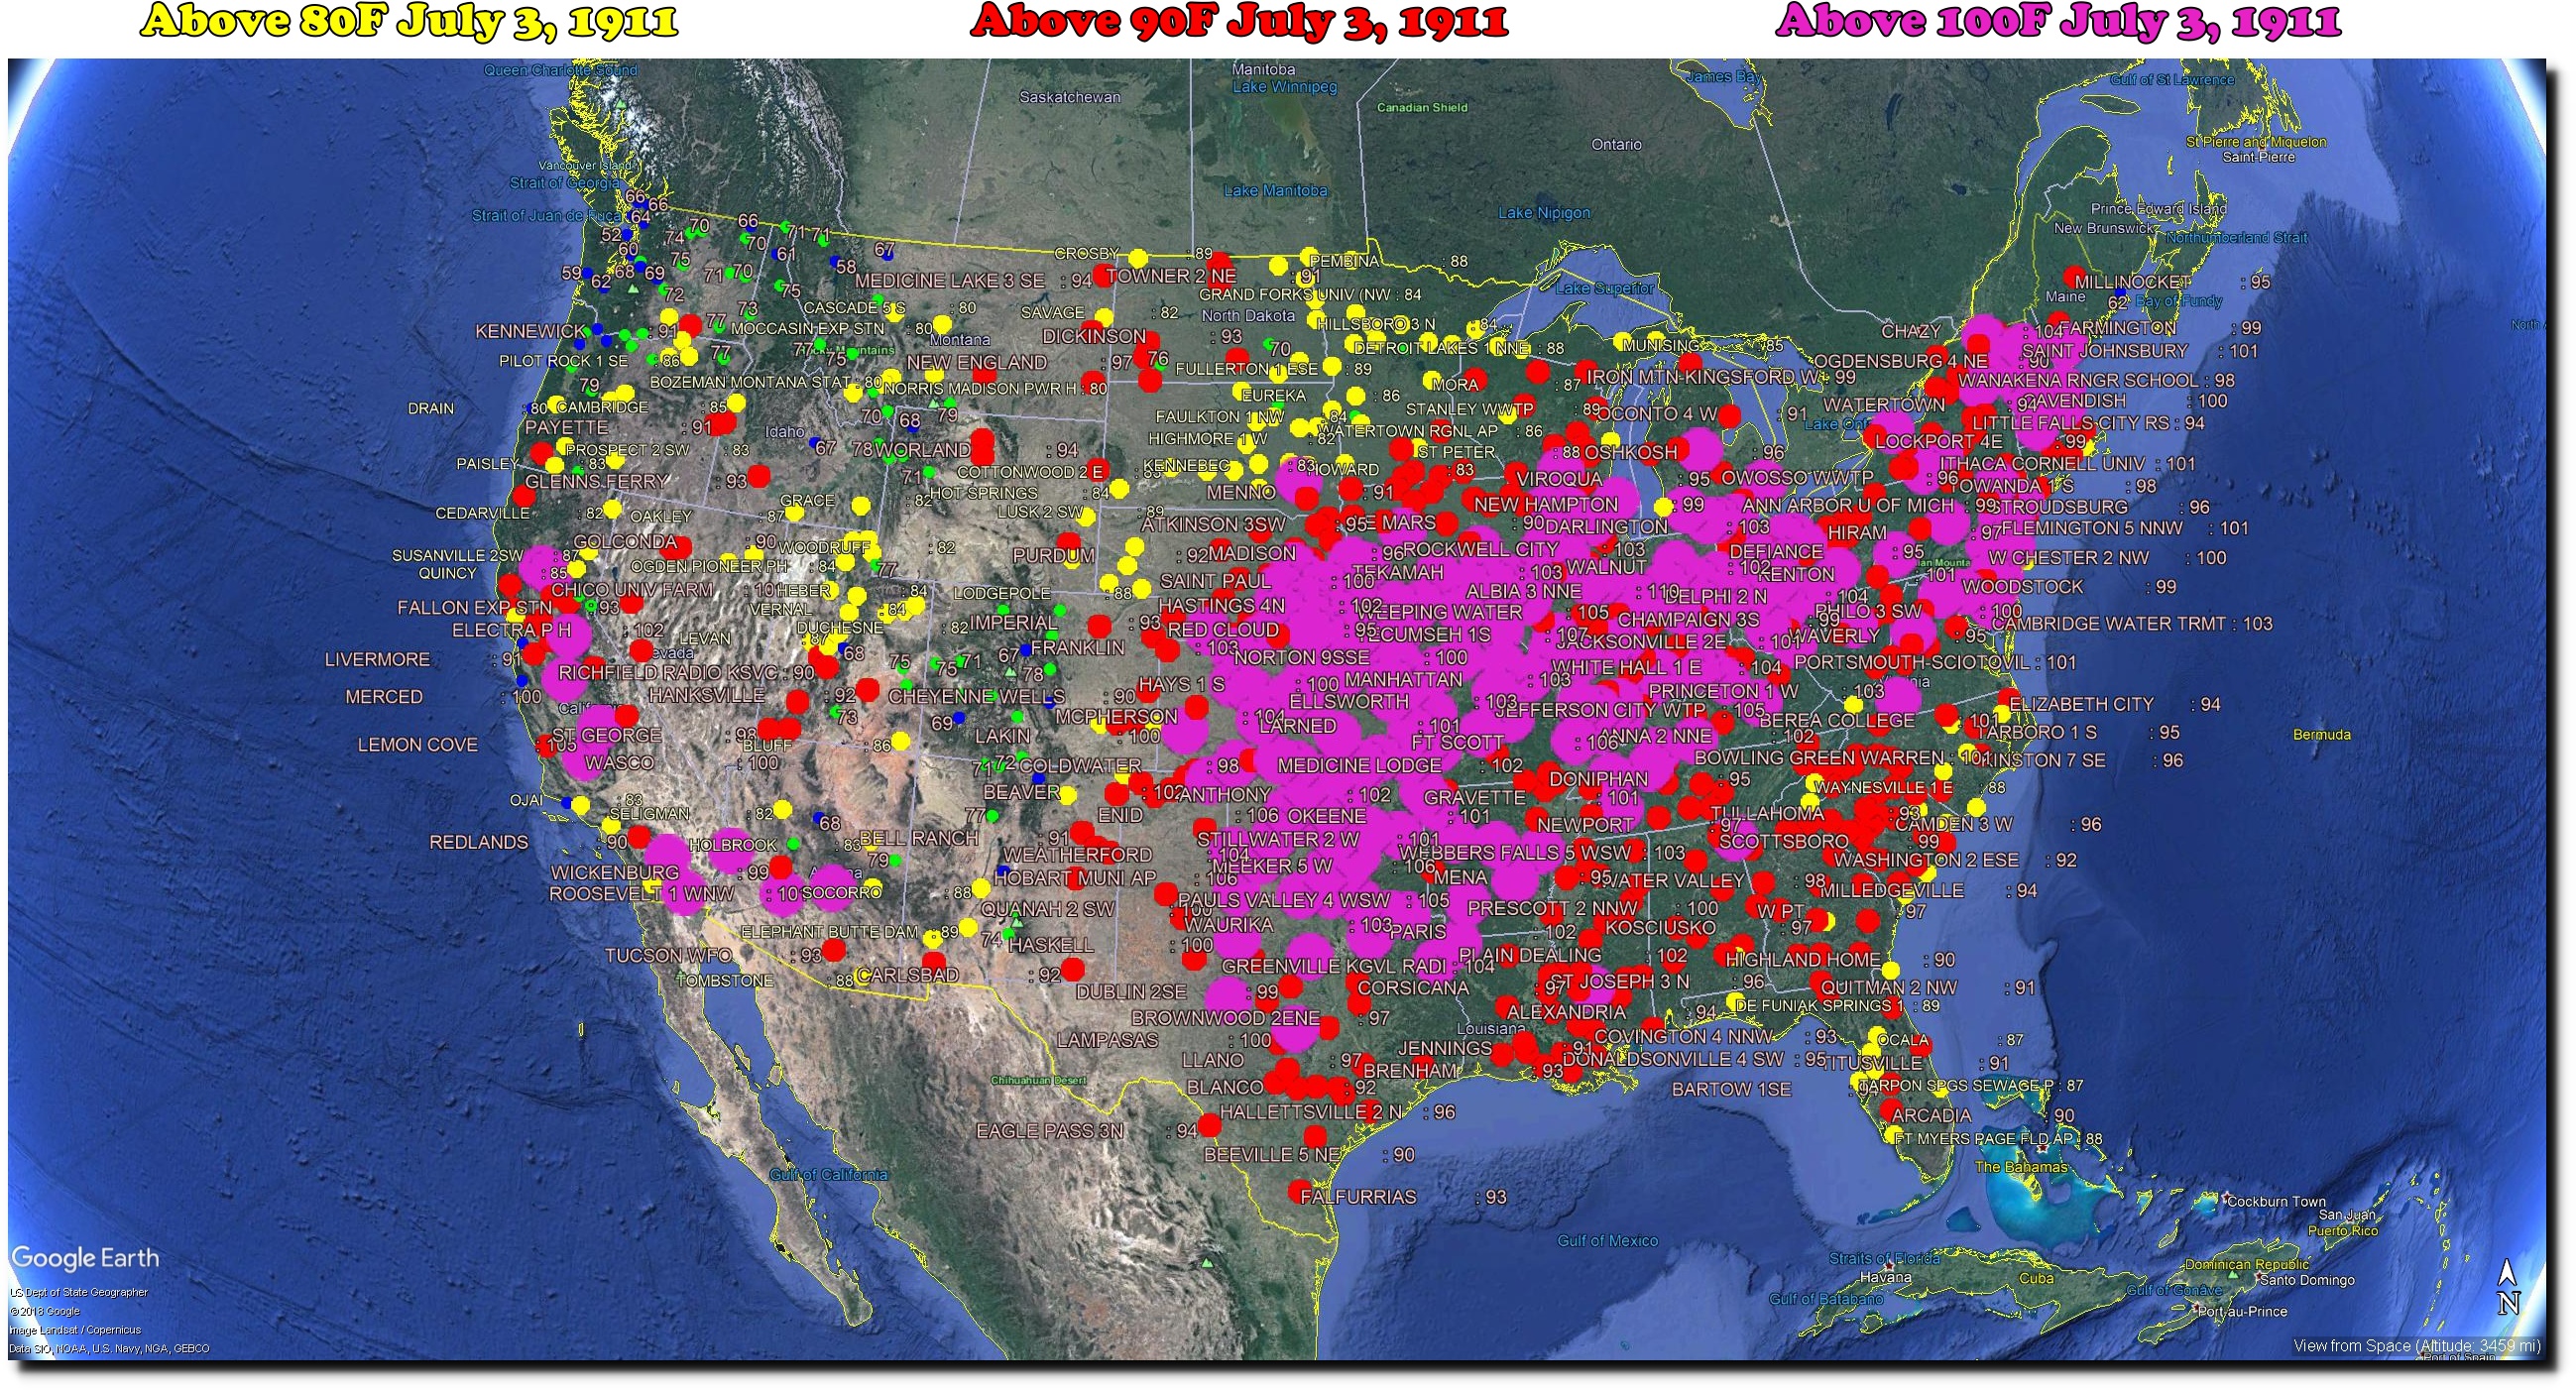
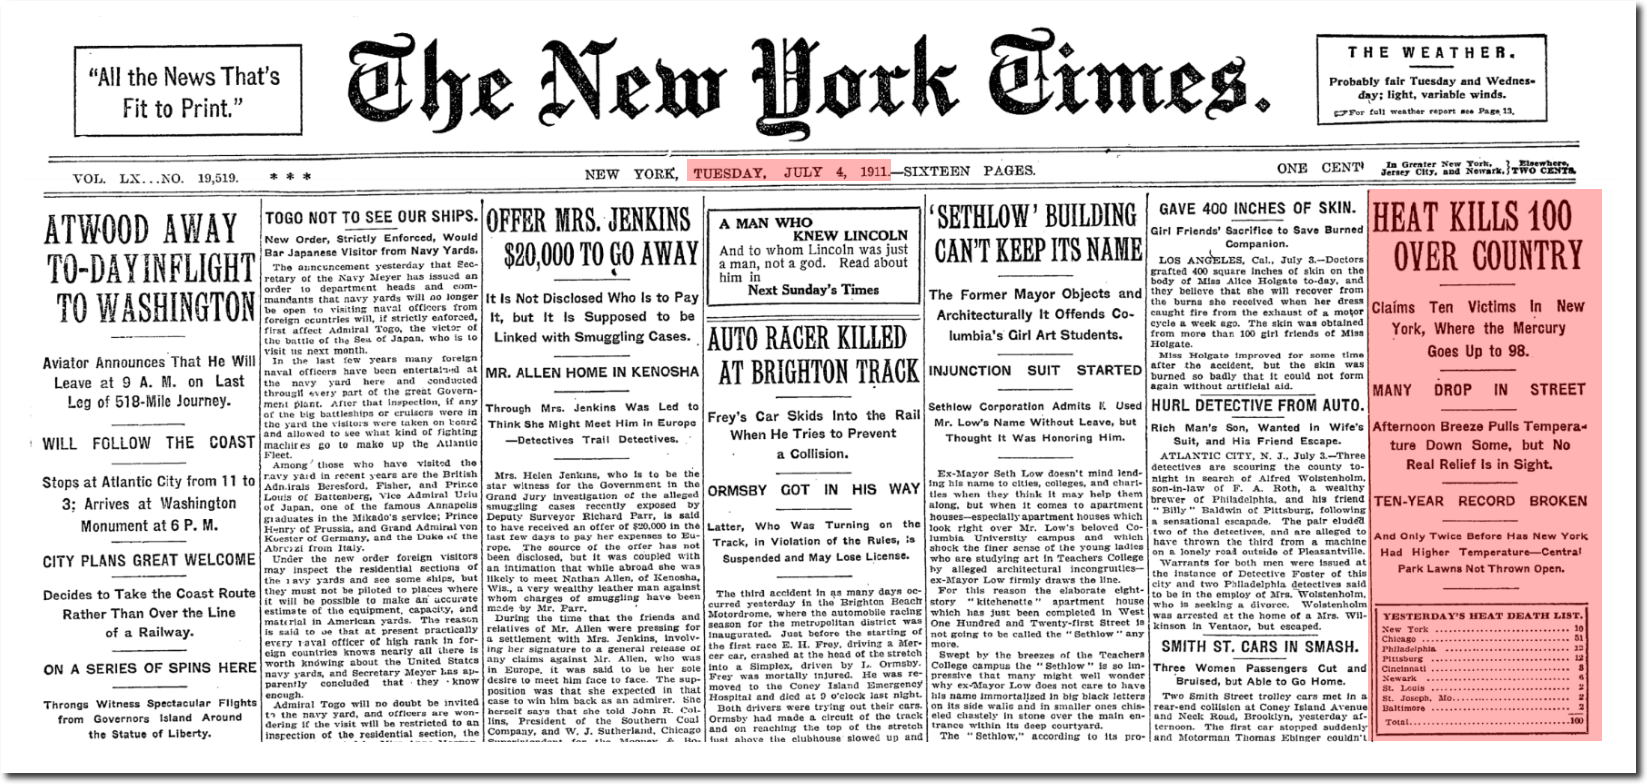
The Northeast US has had seventeen days since 1895 which averaged above 95F (35C.) Five occurred in 1911, and all but one occurred more than sixty years ago. The hottest day on record in the Northeast was July 3, 1911 and the second hottest was July 4, 1911.

7/3/1911    97.1
7/4/1911    96.5
7/10/1936   96.4
7/5/1911    96.2
8/7/1918    96.0
7/9/1936    95.9
9/2/1953    95.8
8/27/1948   95.7
7/5/1919    95.7
8/26/1948   95.7
7/22/2011   95.5
7/3/1898    95.5
7/3/1966    95.5
7/10/1911   95.4
7/4/1919    95.3
7/6/1911    95.3
8/28/1948   95.2

TimesMachine: July 4, 1911 – NYTimes.com

TimesMachine: July 4, 1911 – NYTimes.com

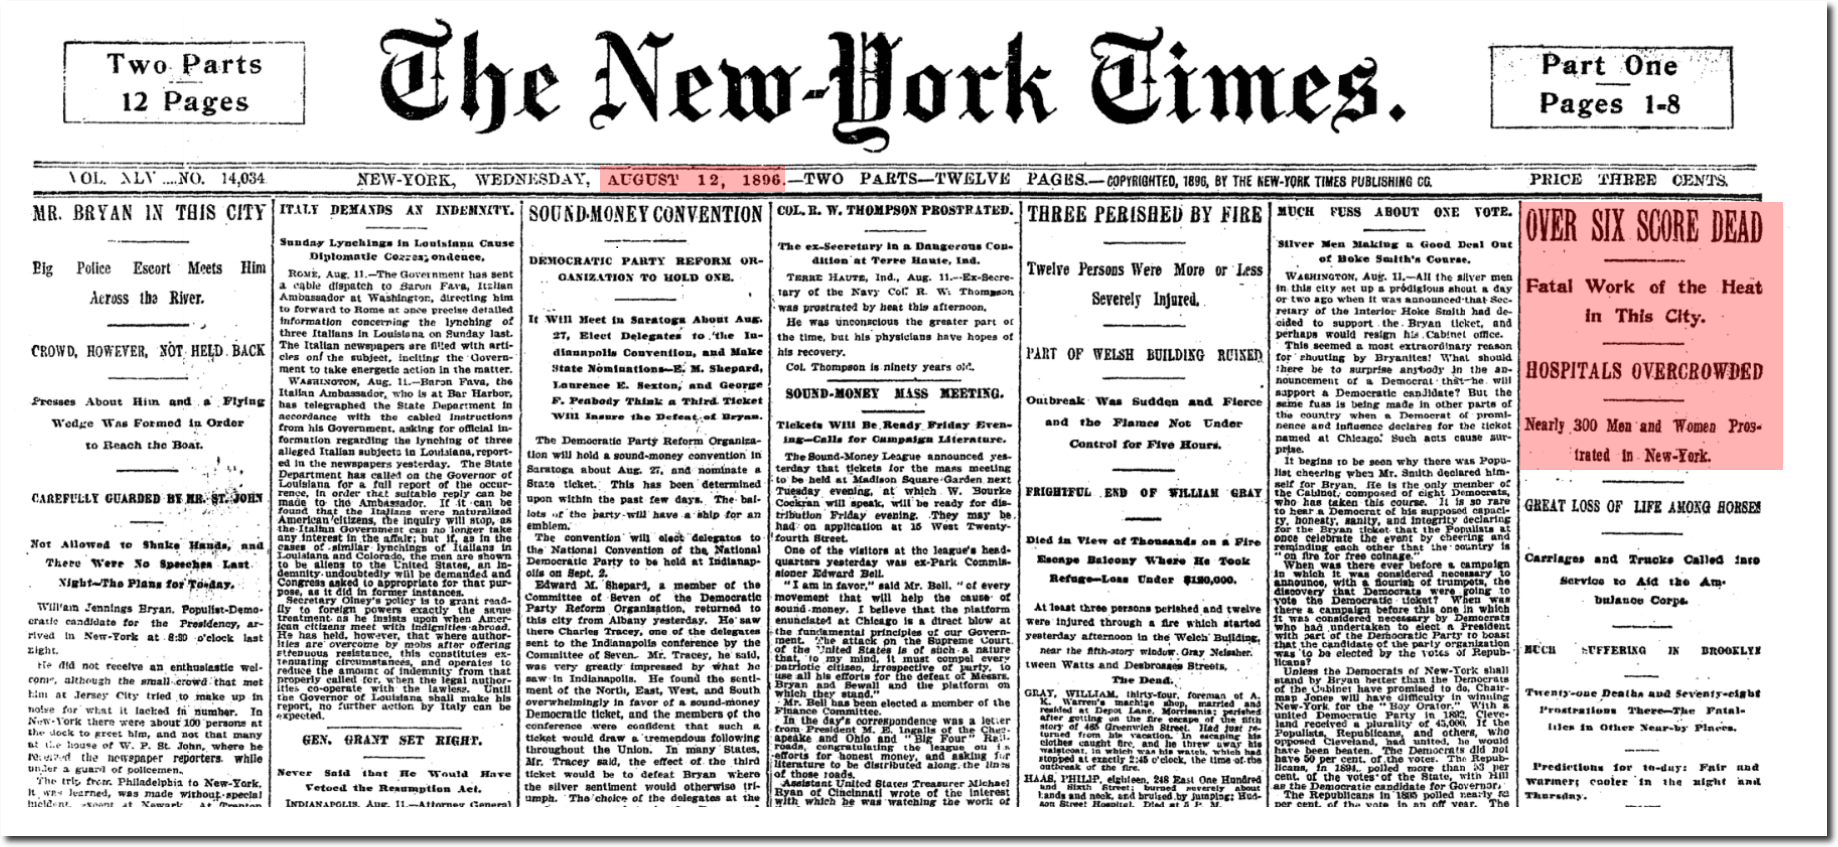
There have been many other terrible heatwaves in New York.
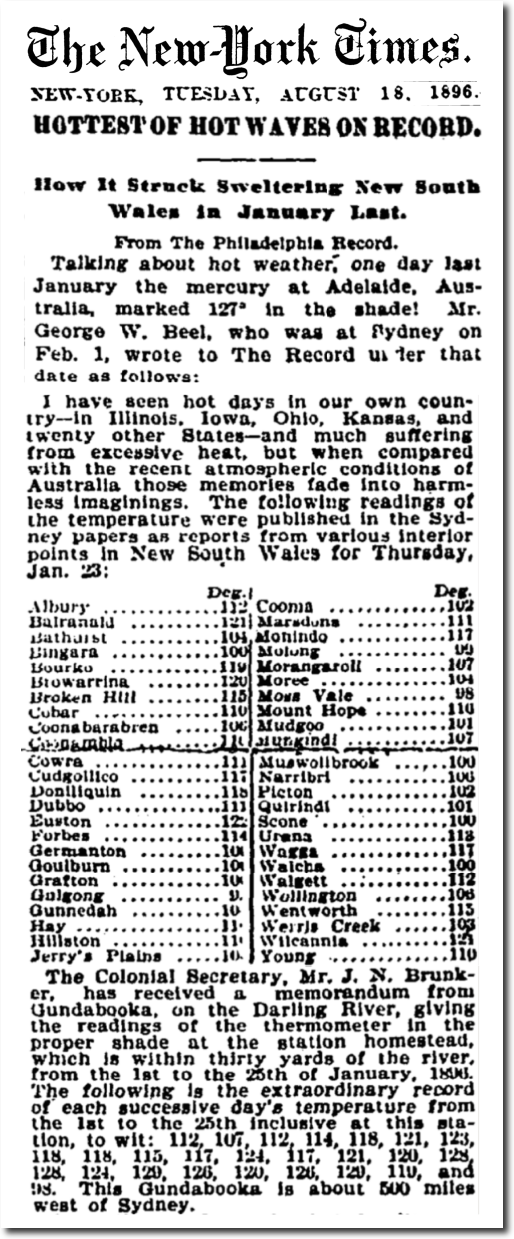
1896

1896 Heatwave

Australia also had their worst heatwave on record during January of 1896.

TimesMachine: August 18, 1896

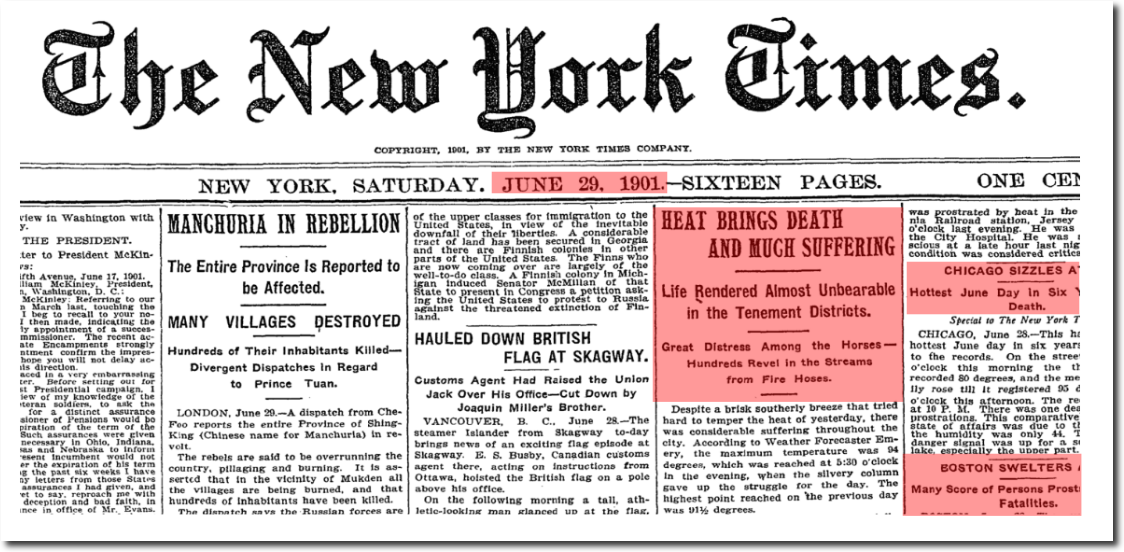
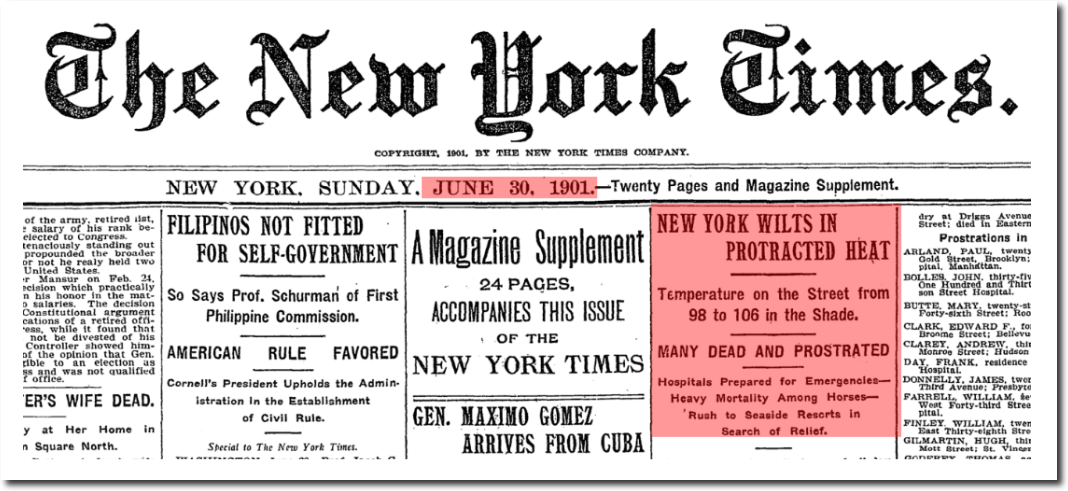
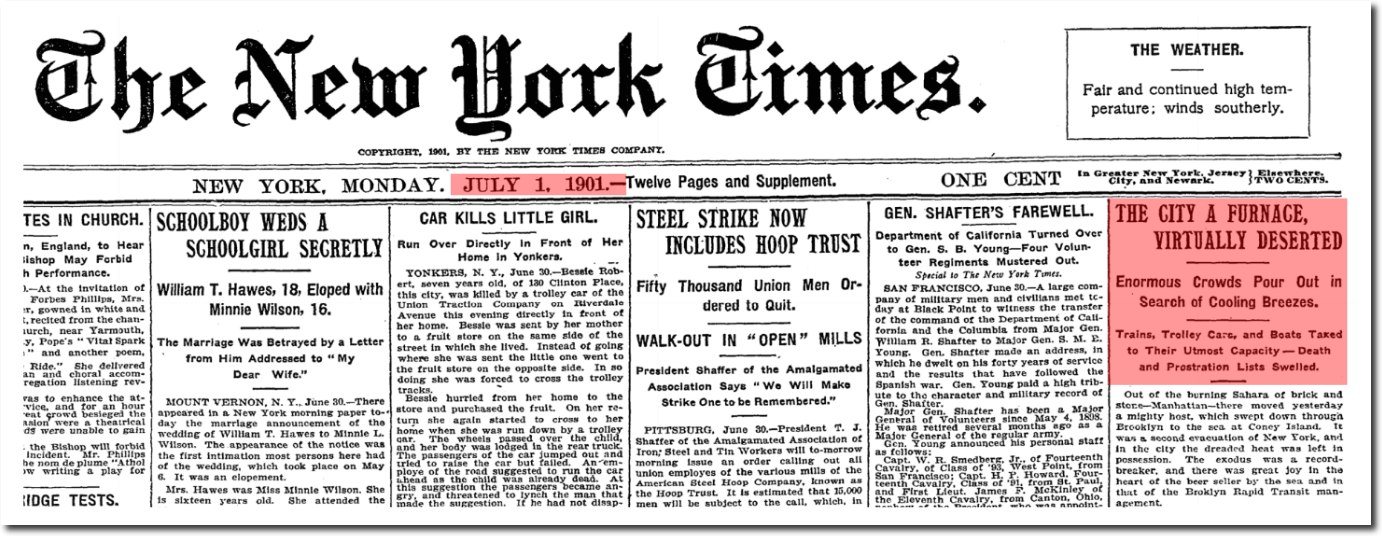
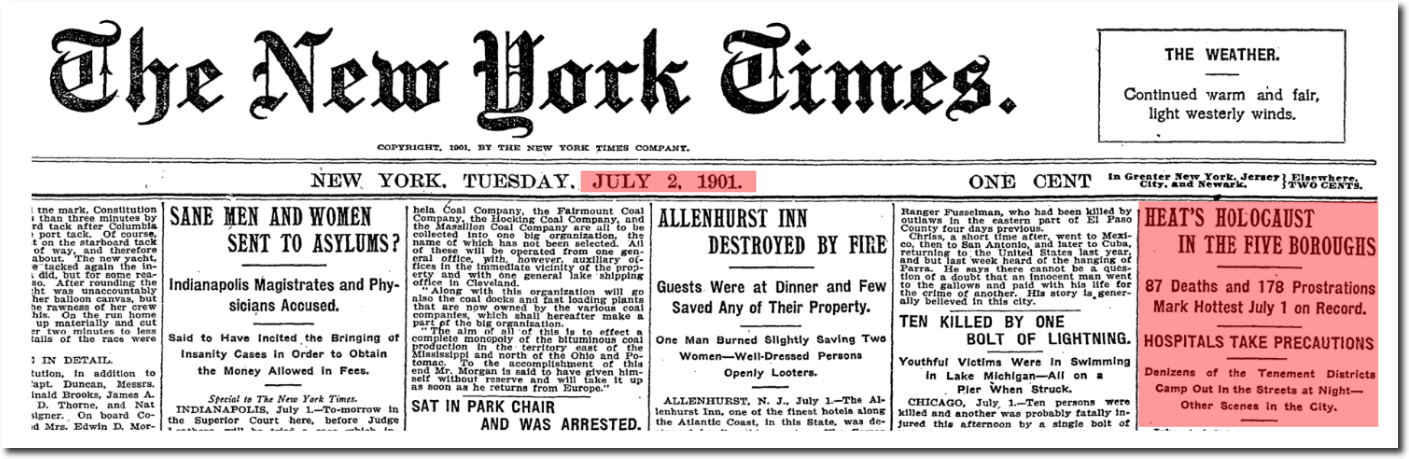
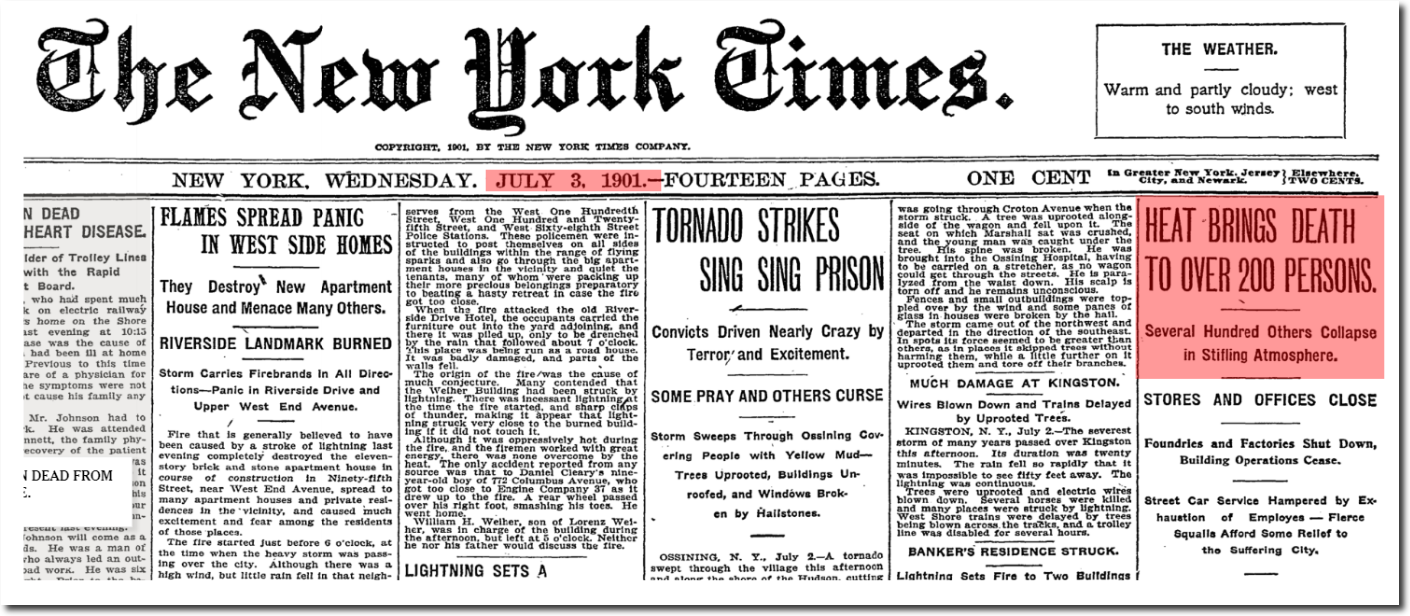
The 1901 heatwave killed thousands of people.

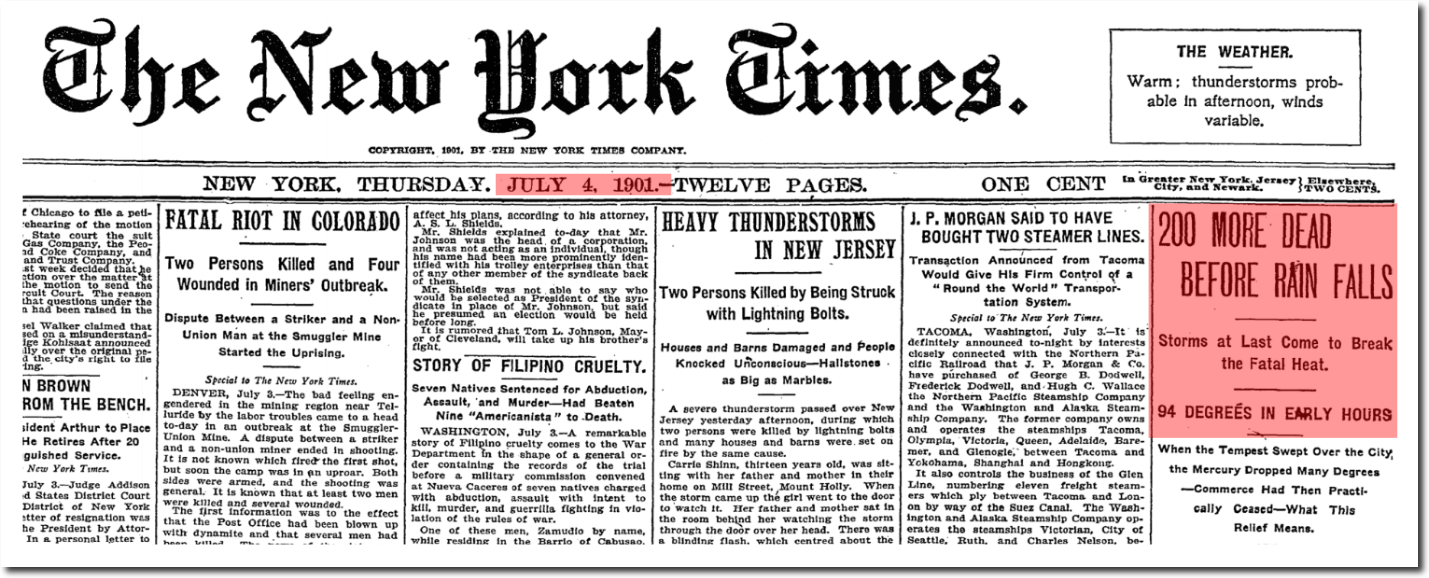
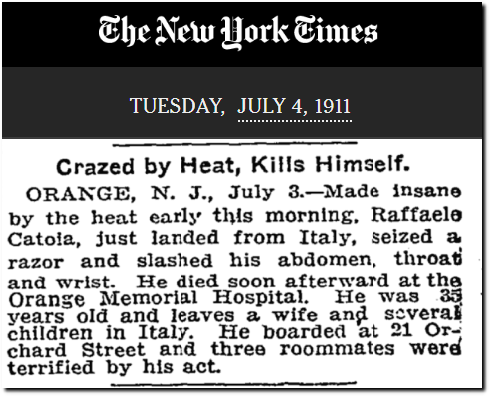
The 1911 heatwave killed thousands of people in New England and across the country.

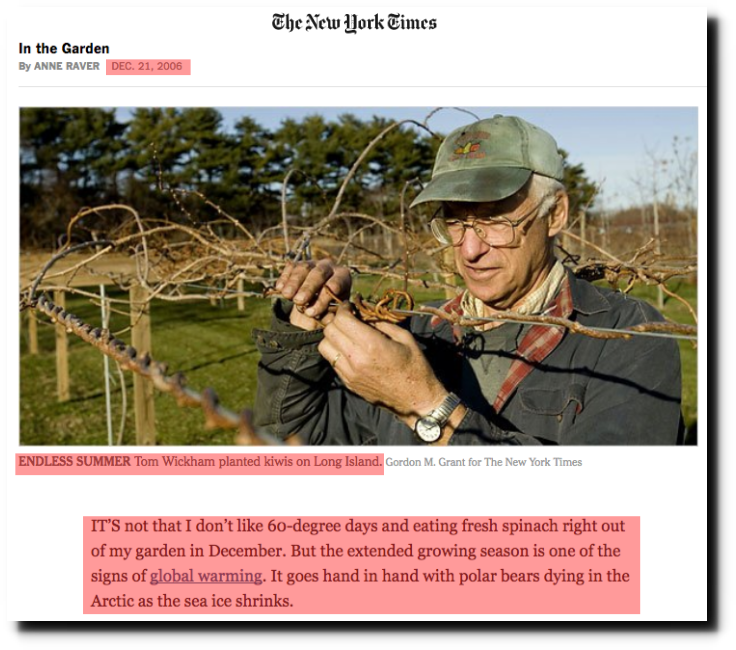
The New York Times claims about heat are completely fraudulent, and their claims about cold and snow are equally as bad. In 2006, they announced the “endless summer.”

With Warmer Weather, Different Decisions to Make – The New York Times

The Washington Post predicted seven years ago that cherry blossoms would start blooming in January.

Could cherry blossoms one day be blooming in winter? – The Washington Post

January temperatures have been declining in the Northeastern US since the 19th century.

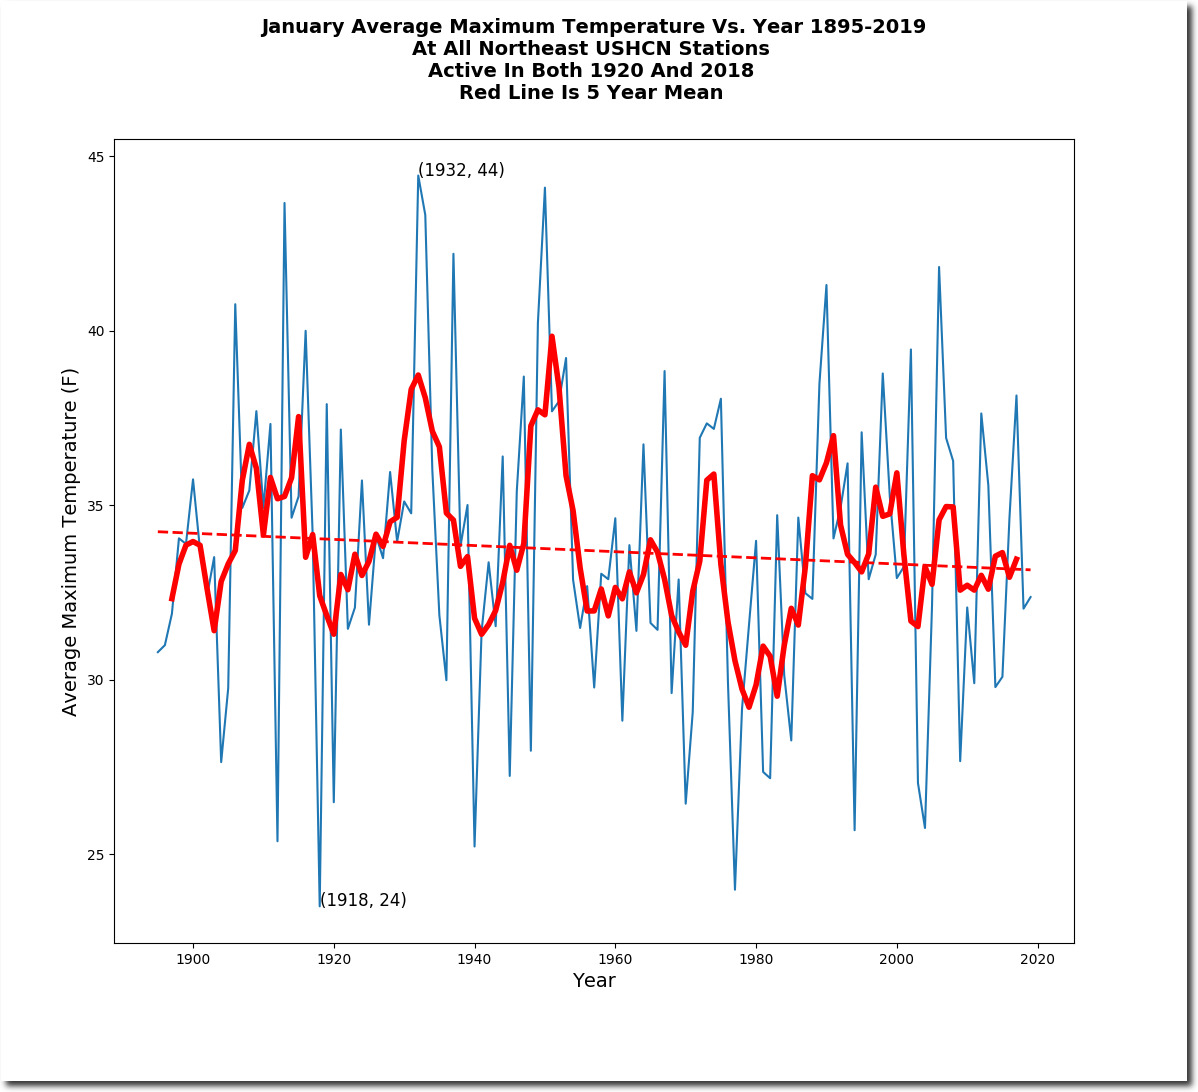
The New York Times cherry-picked a warm year which went against the trend, and declared it to be science.

The percentage of cold January nights has been increasing.

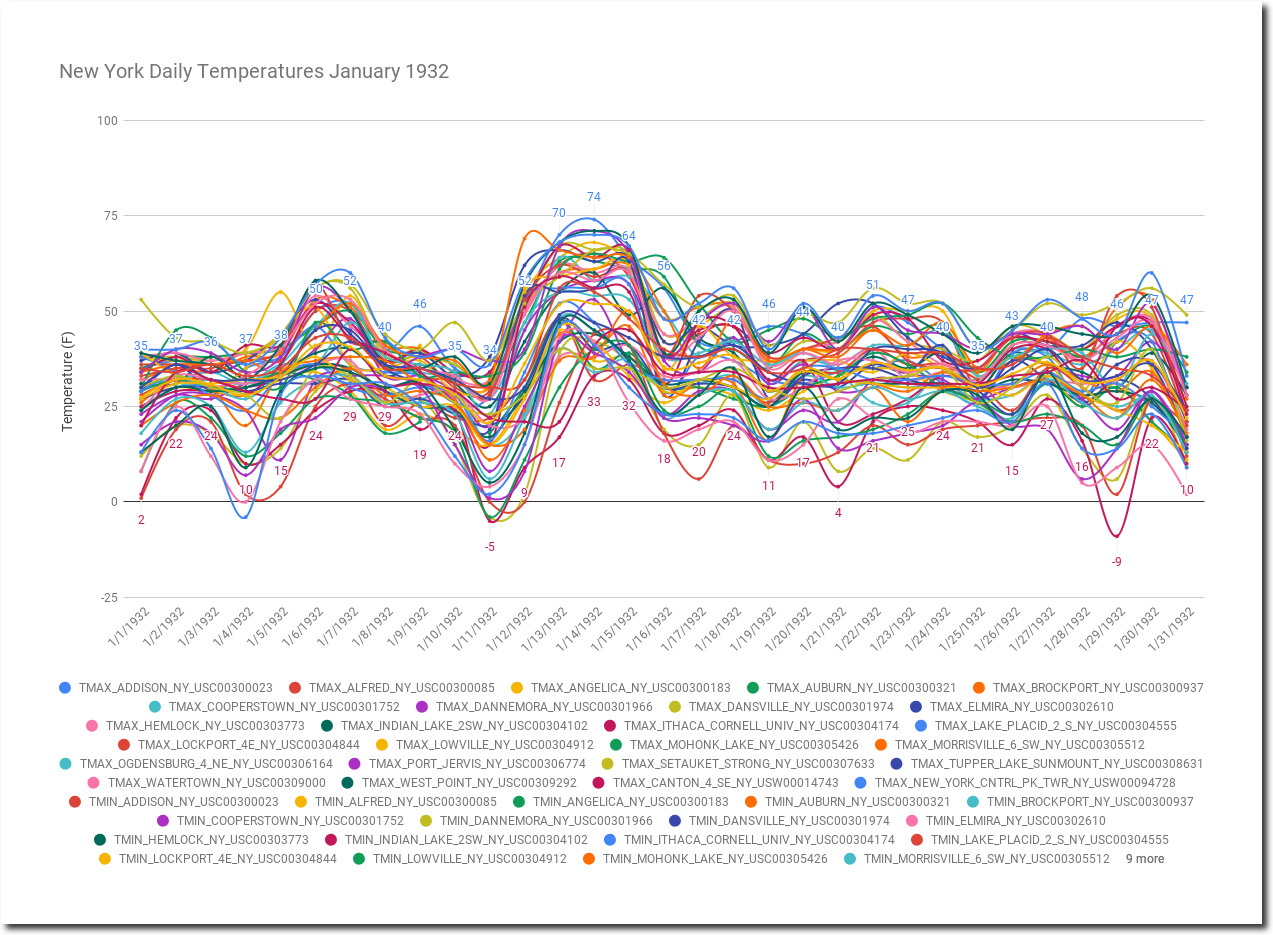
The warmest January in the Northeast was 1932, when the Lake Placid Winter Olympics almost had to be cancelled due to no snow.

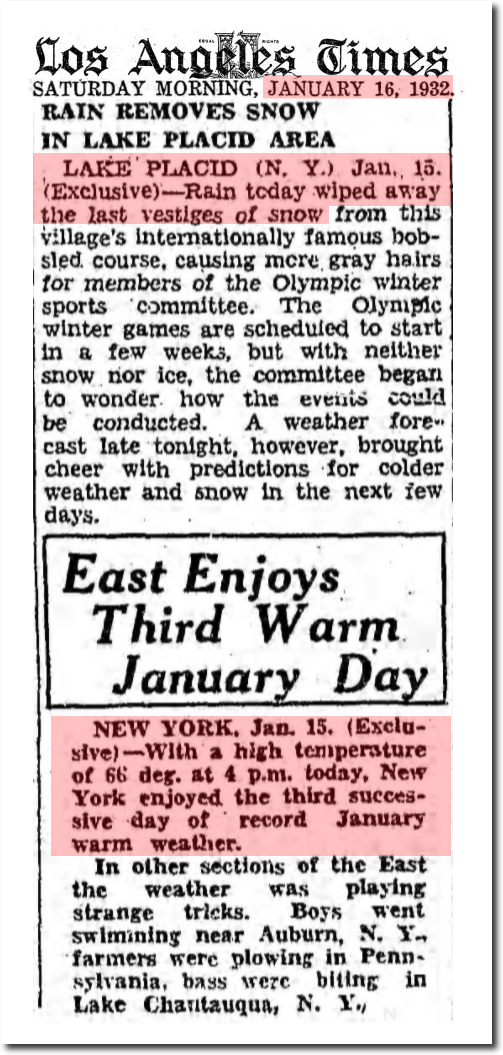
16 Jan 1932, Page 1 – The Los Angeles Times 

Addison, New York was 74 degrees on January 14, 1932.

Spreadsheet

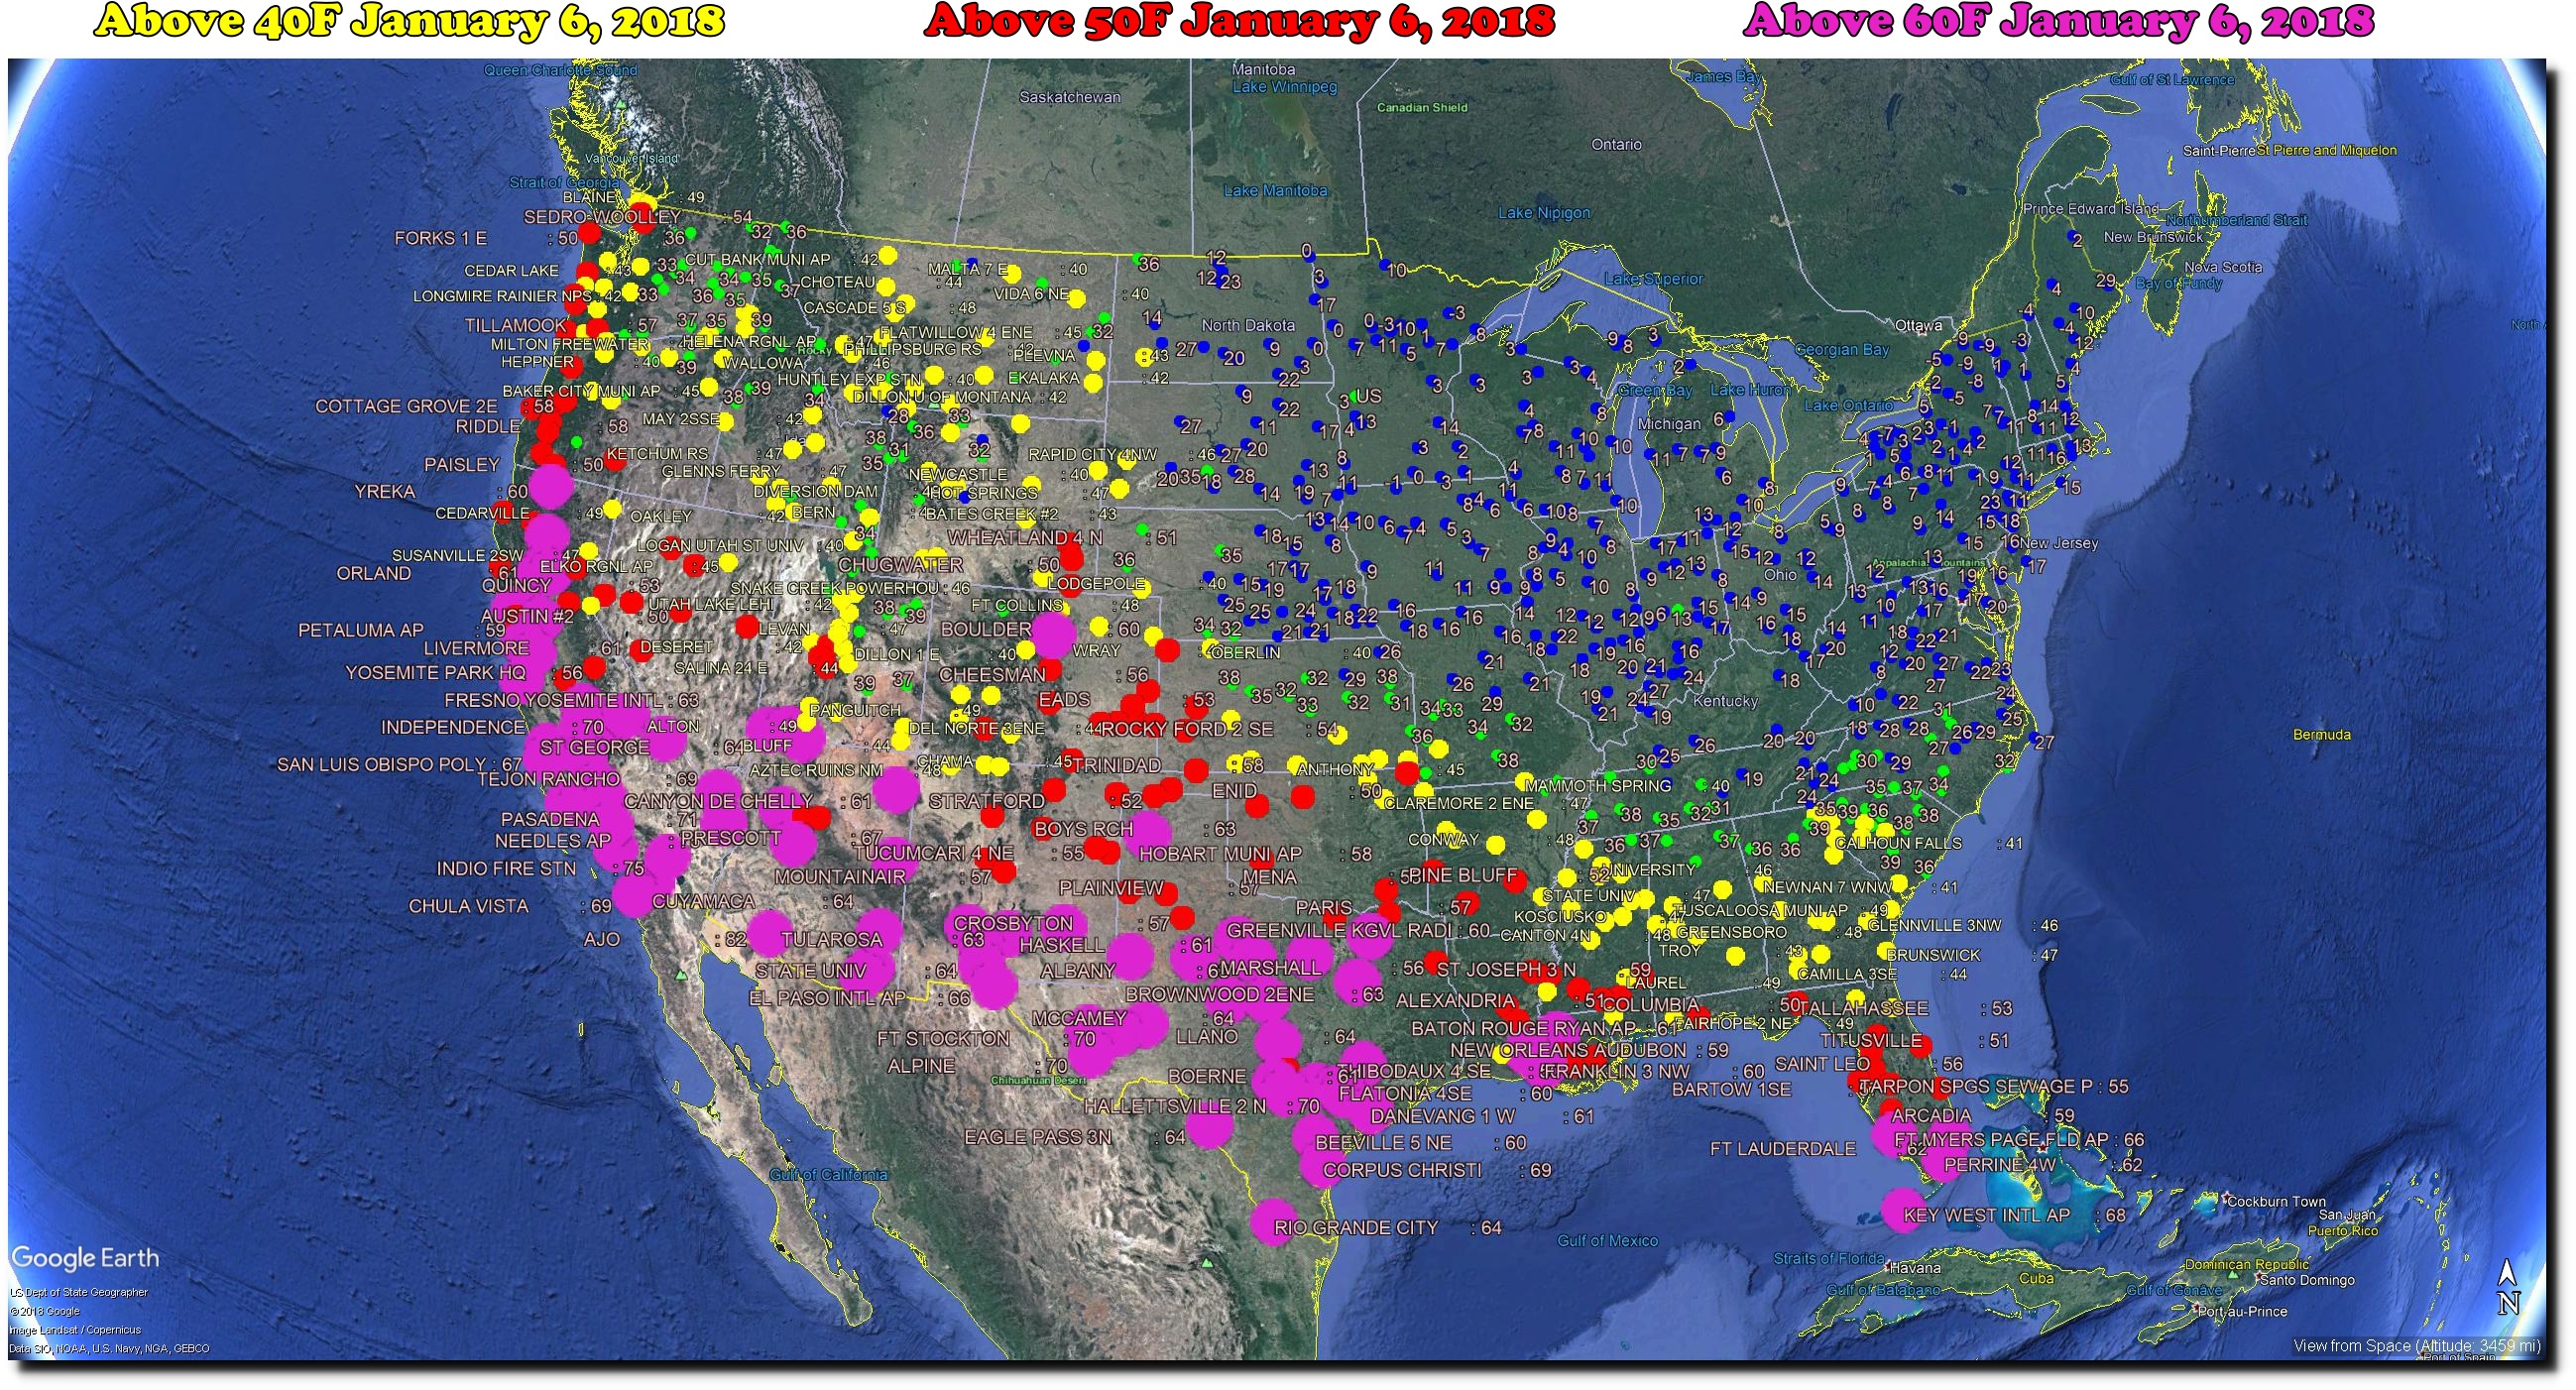
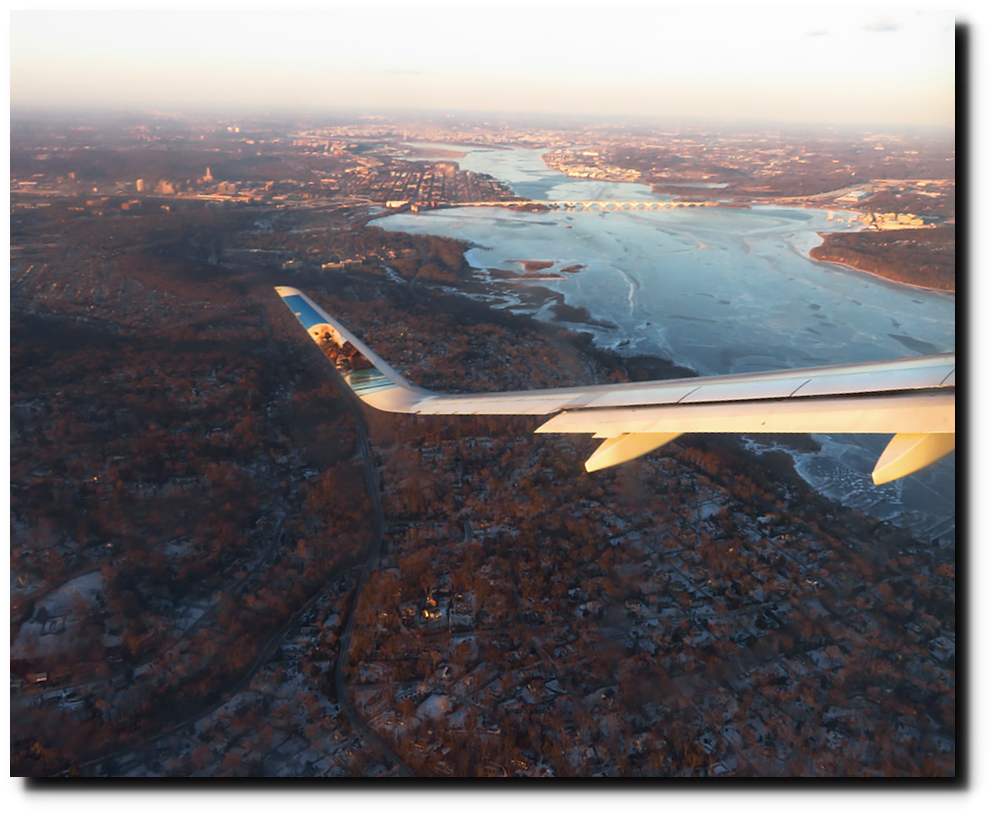
By contrast, January 6, 2018 was the ninth coldest afternoon on record in the Northeast. I flew to DC that day. It was unbelievably cold in the east. The average maximum temperature in the Northeast that day was 7.5F (-14C.)

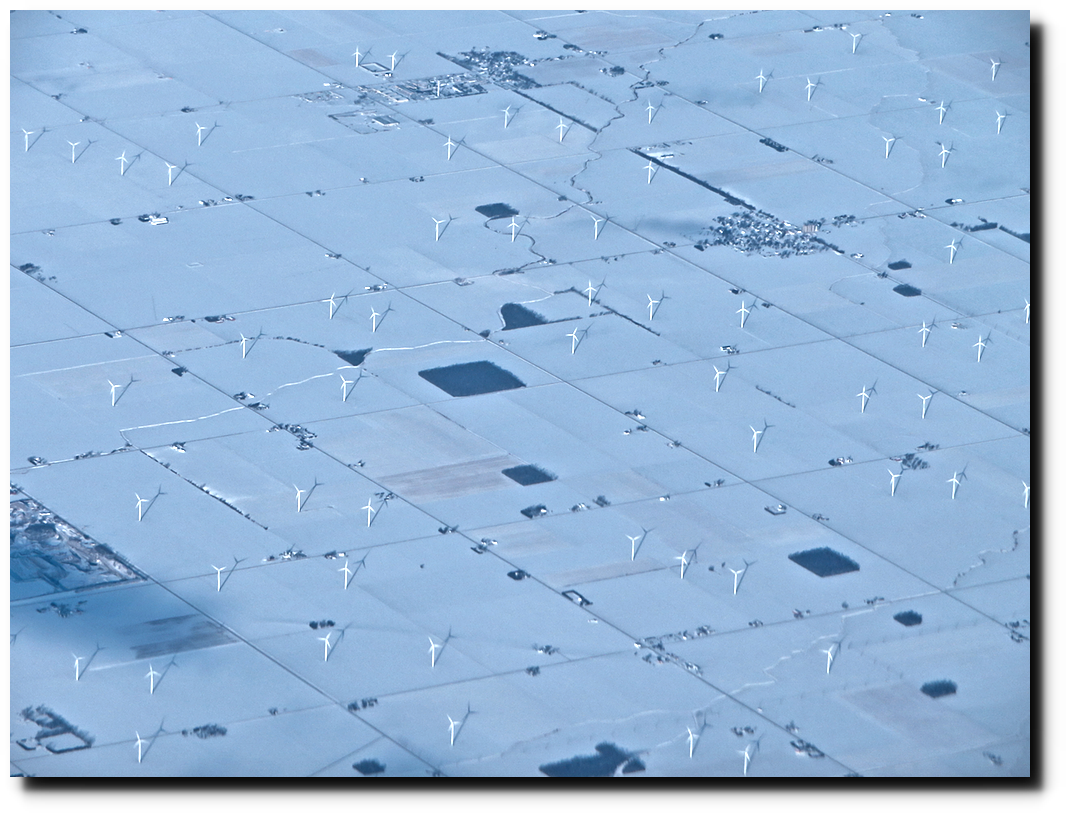
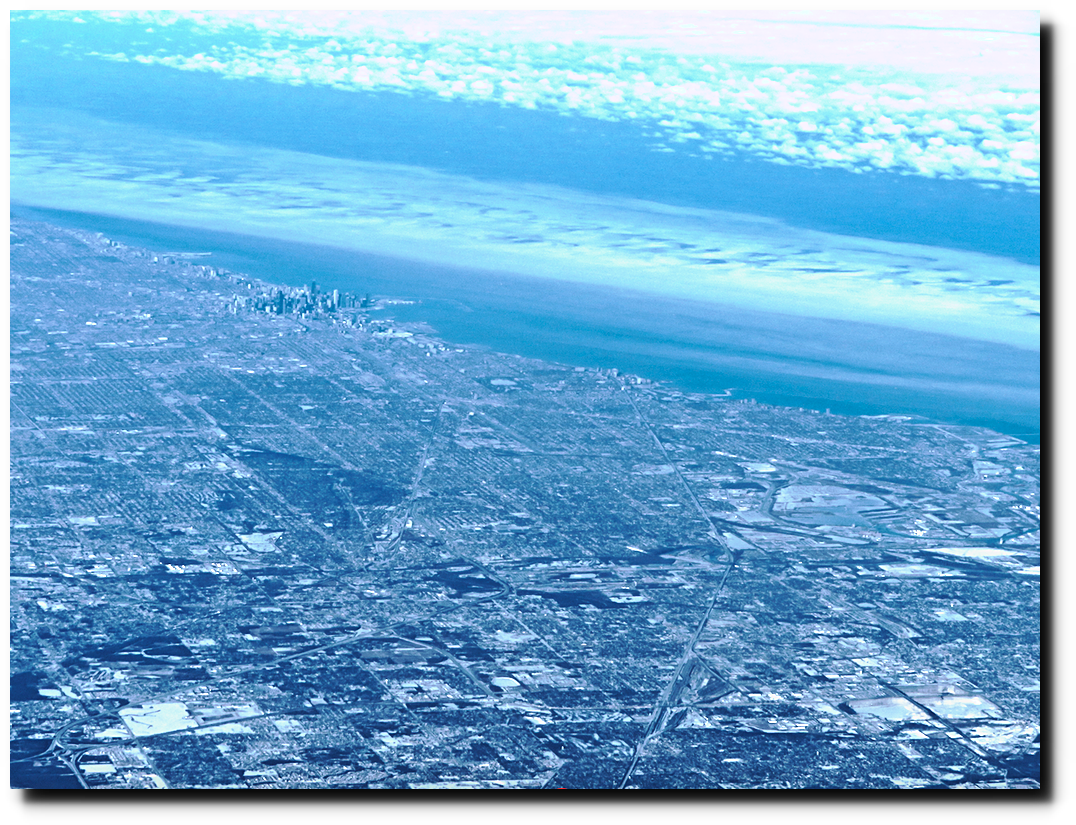
Evil fossil fuels were keeping  the Midwest running, as the windmills were motionless.

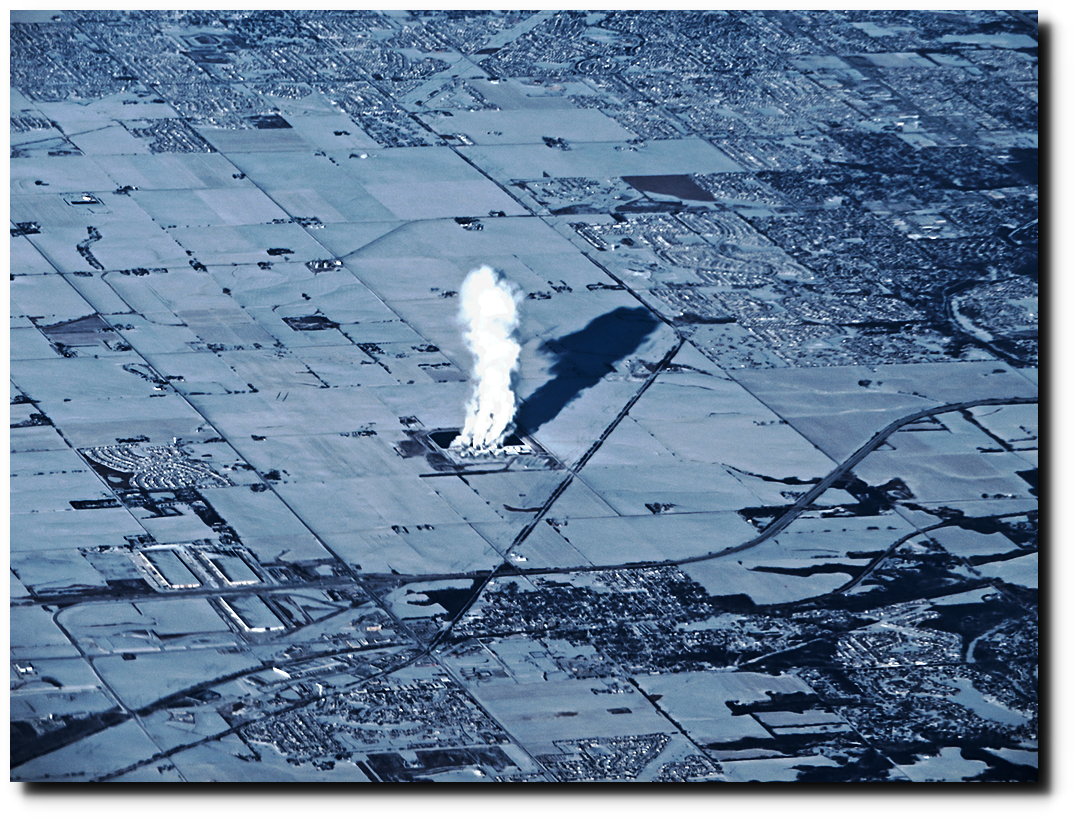
Lots of ice around Chicago and southern Lake Michigan.
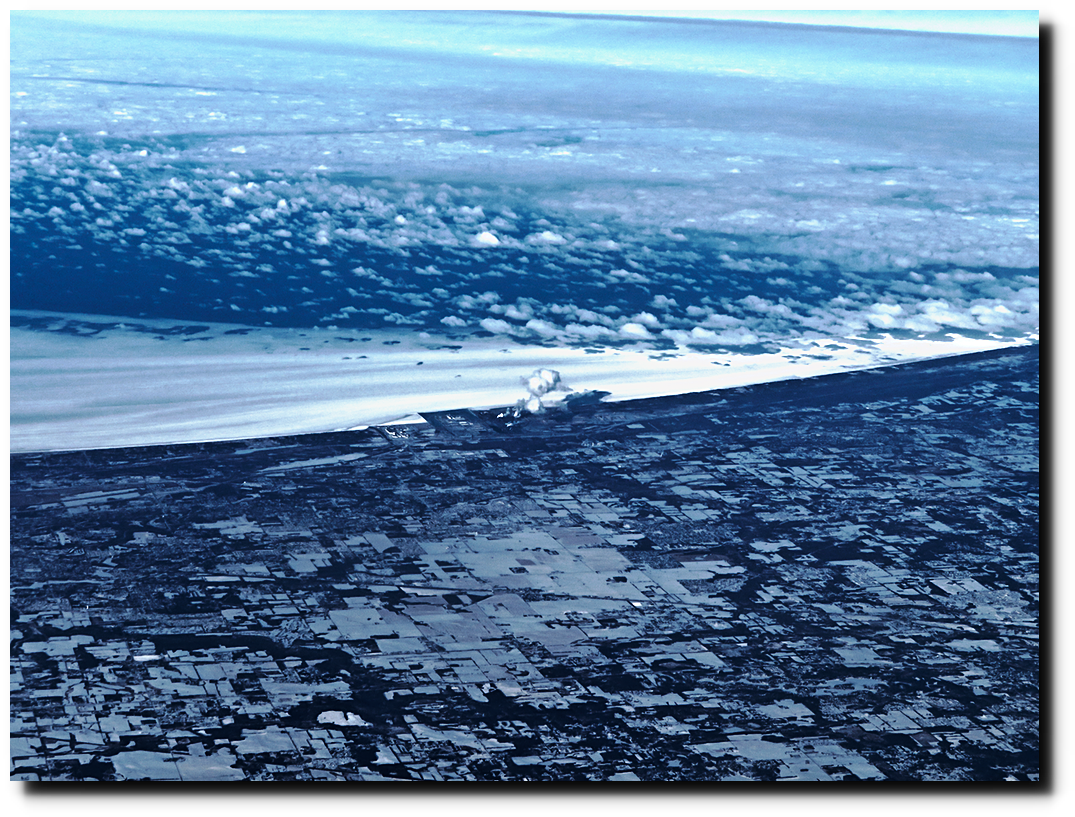
Lake Erie

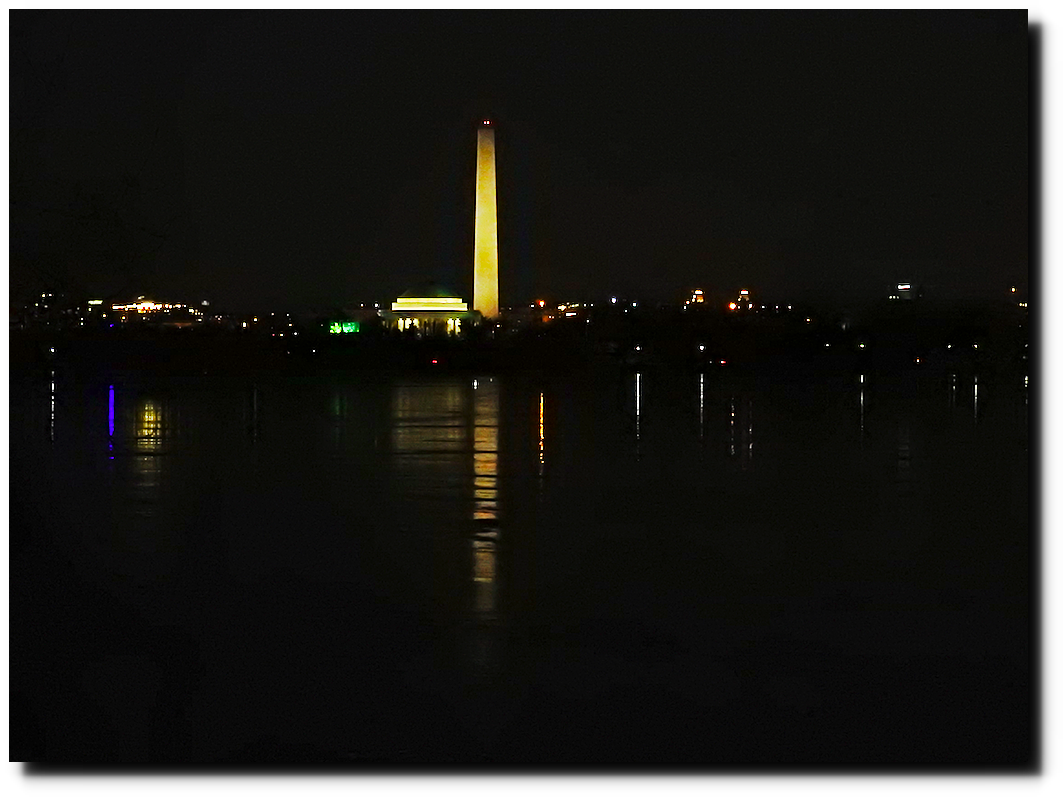
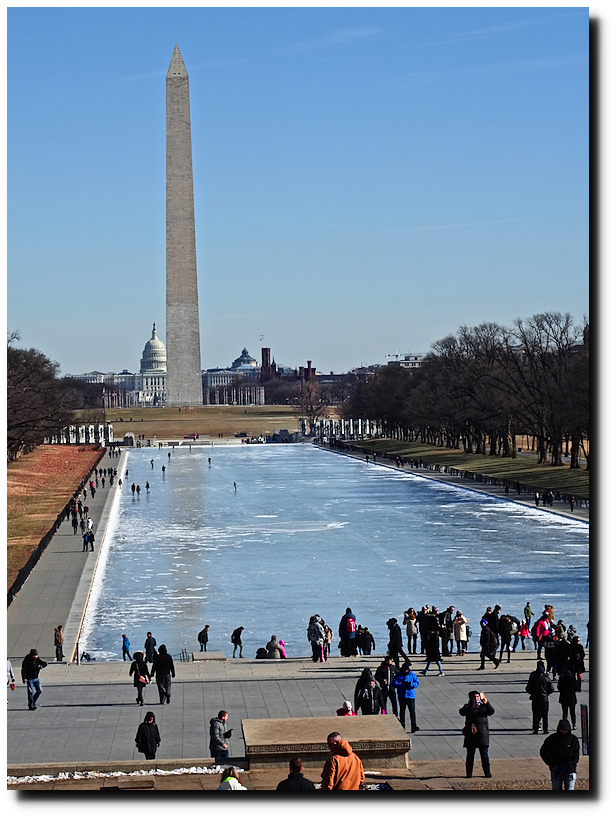
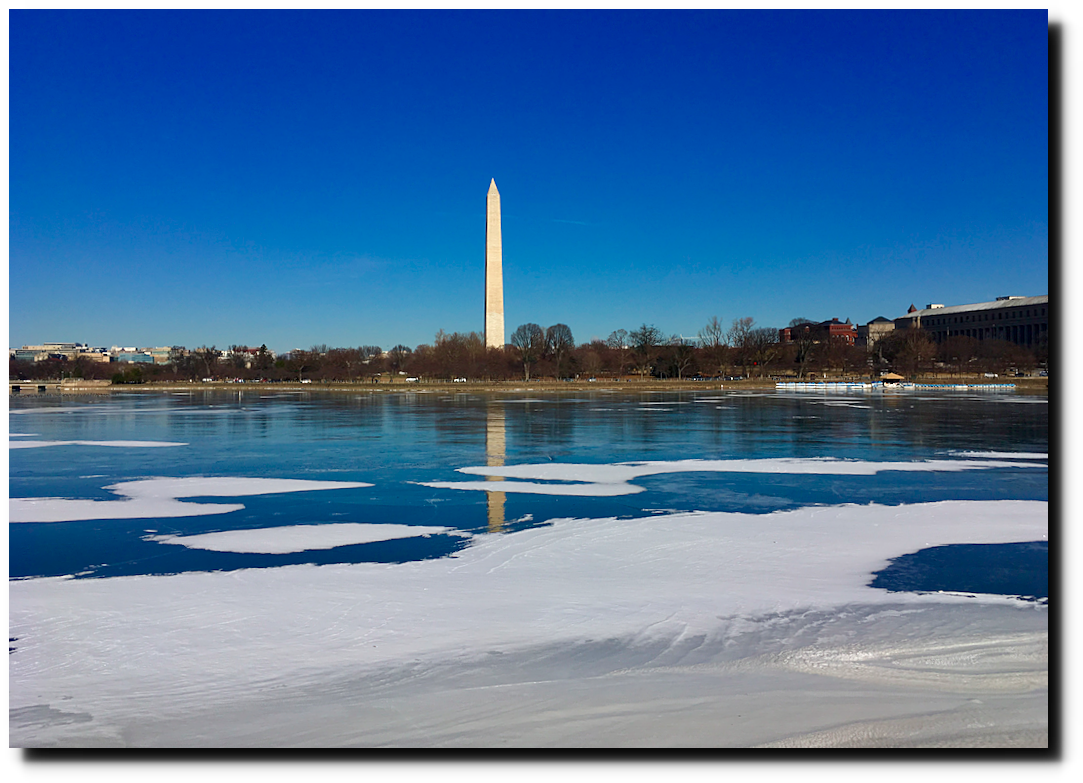
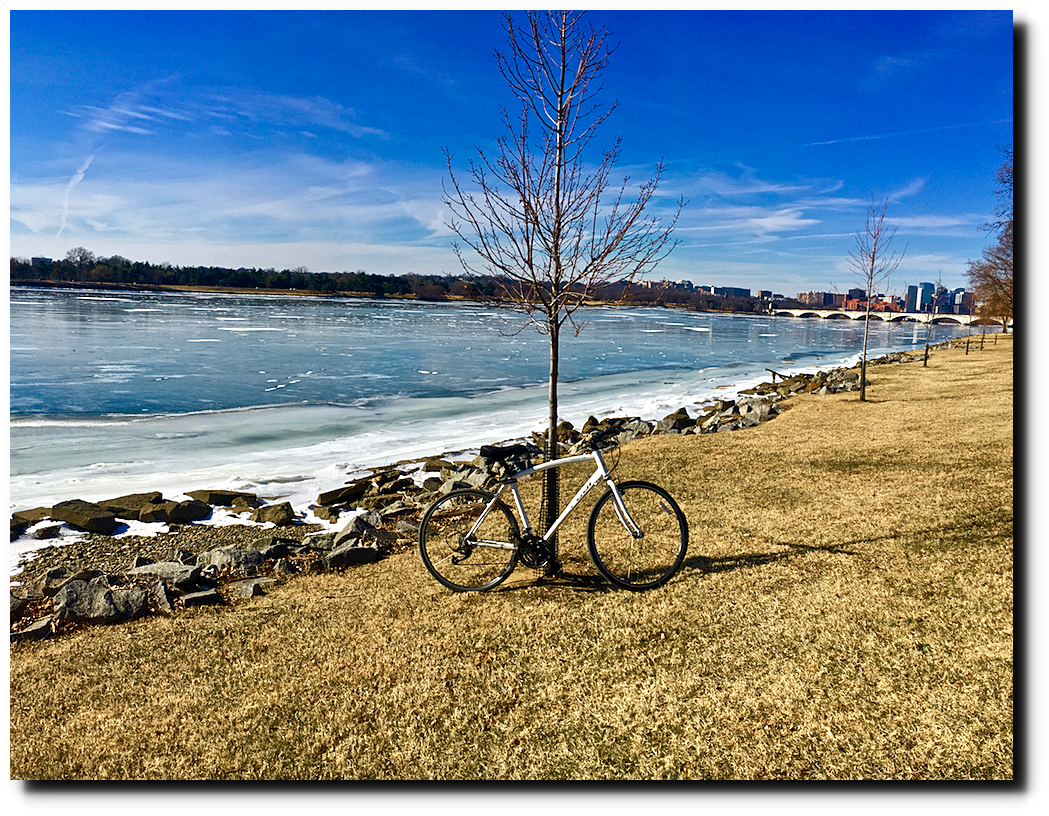
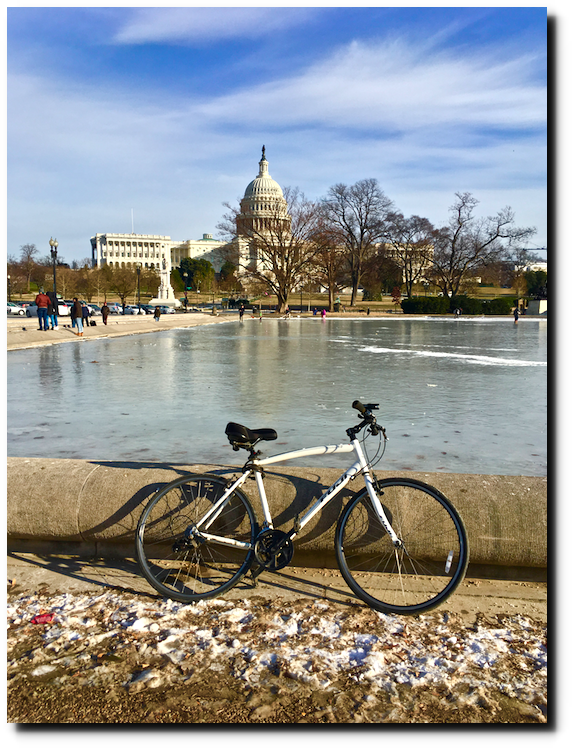
The Potomac was frozen solid.

I nearly got frostbite on my face due to the high winds and very cold temperatures in DC on the evening of January 6, 2018. It didn’t feel like “endless summer.”

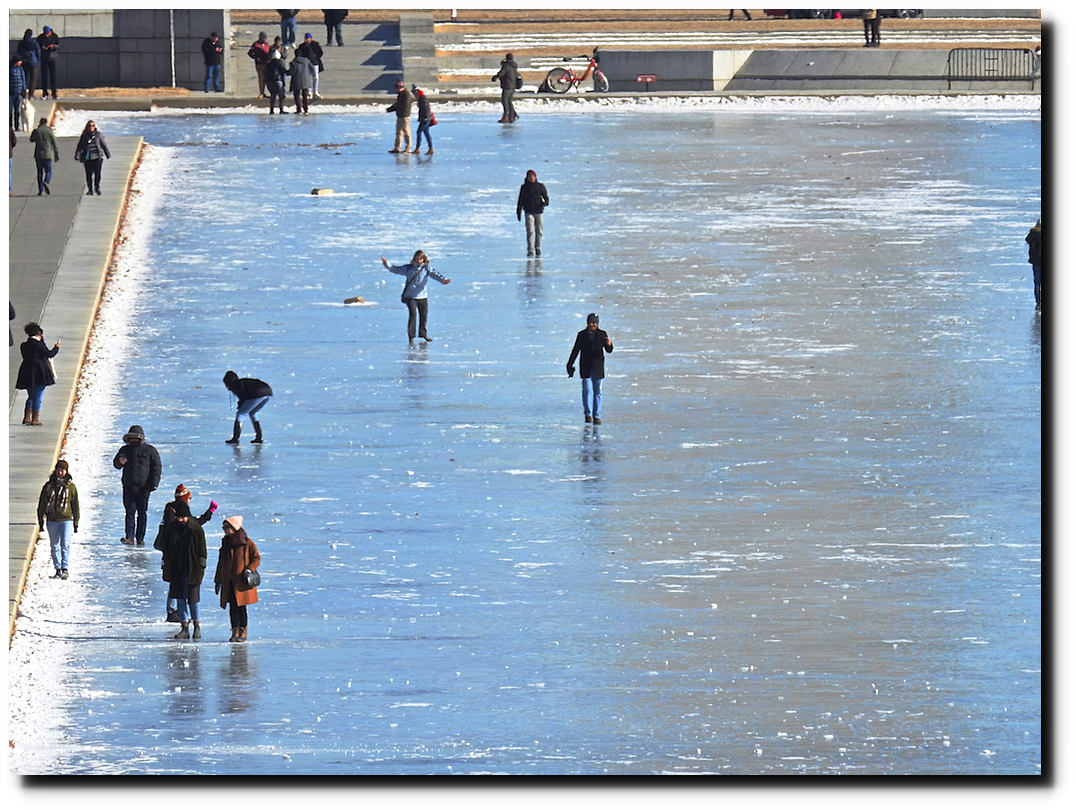
I found this leaf frozen into thick ice in the reflecting pool in front of the US Capitol on January 7, 2018. People were playing hockey right in front of the Capitol Building.

Summers are not getting hotter in the Northeast. Winters are not getting warmer in the Northeast.  It is not your imagination – the New York Times is lying about the climate.

This entry was posted in Uncategorized. Bookmark the permalink.

23 Responses to It’s Not Your Imagination – The New York Times Is Getting More Dishonest

  1. Tommy says:

    Hi tony. Great post. Its great to know the facts. I an from chile and it has been a very dry winter in santiago. Everybody is just freaking out because of it. Do you have some real information about it or is there some way i could contact you to talk about it. Im looking like for historical data of it because im pretty sure there is nothing out of normal, but id love to have the facts. ThAnk you Tony!

  2. GW Smith says:

    Blatant and in your face NYT! Get em, Tony!

  3. James says:

    Remember all liberals lie, cheat and steal.

  4. MrZ says:

    USHCN tells too much and hence it is officially deprecated. We must instead refer to GHCNM that is getting more and more “accurate” with every release (or more pristine as they say).

    Here is how much better historical readings from Washington – IOWA has gotten. Same station, same readings, different releases.

    Blue is GHCNMv3 QCA vs QCU for January
    Red is GHCNMv4 QCF vs QCU for January
    Note that the figures listed in the QCU files are identical.
    The lines are broken some years. These years QCU holds a value that was replaced with -9999 in the QCA/QCF files. Very convenient to mask the sudden 1998-2000 bump. Also notice how v4 catches up in steps to end up at same level as v3 2017.

    I think Tony can confirm that a big part of the v3 adjustments are motivated by TOBS (their motivation). If so they are not very consistent in v4.

  5. Caleb Lawson says:

    It’s not your imagination, Tony Heller is getting more dishonest.

    The article you linked to was about hotter summers GLOBALLY. It’s global warming, not “Northeastern US warming.” The planet as a whole is getting warmer, no matter how much you wish otherwise. Facts don’t care about your feelings, Tony.

    • tonyheller says:

      The New York Times prints articles all the time claiming that US summers are getting hotter. Nobody “feels” the imaginary global temperature. Your comment is clueless.

    • David Jung says:

      Caleb,
      It’s not our imagination, you’re an idiot.

      The New York Times article is about hotter summers IN THE NORTHERN HEMISPHERE. Not GLOBALLY. It also cherry picks data from 1951 forward. Data of unknown origin, quality or integrity, so that it can’t be verified. Since the USHCN data is the best data set available, surely this super hot summer temp data would show up somewhere, but it doesn’t. The NY Times article is another example of media propaganda using vague and scary looking graphs to fool chumps like you into thinking that the earth is burning up. Tony continues to expose what a hoax all of this is. Thanks Tony!

  6. richard says:

    You have to laugh-

    “In the middle of July we see few signs of thawing and that spring has come. We had expected more melting and that the ice was more disintegrating, ”says Captain Hansen, who for several decades has worked on various vessels in the Arctic.

    https://www.iceagenow.info/icebreaker-headed-for-north-pole-turned-back-by-thicker-ice-than-expected/#more-29058

  7. griff says:

    Lets see: highest temp ever up in Alert in N Canada… high temps in Svalbard, Alaska… you never seem to comment on the rapidly warming bits of the Arctic. why is that?

  8. Mister Majestic says:

    Attention ” griff ”

    Looks like you TOO have won the Blatant Insanity Award.
    Maybe we can saw the trophy in half. Then you can share it with Caleb Lawson.

    Sorry to burst your bubble ” griff ” but the data from the town of Alert is based on Idiot’s Logic.
    Why ? Well, the Communist Pigs said the town reached a recent high of 21 degrees Celsius. The PREVIOUS record of 20 degrees Celsius…….was set…….Way Back……in 1956. I’m sure all the Communist Pigs were ranting and raving about Global Warming, way back then too. It only took 63 EFFFINNGGGG years to break the previous record. Therefore, no trend toward global warming in this location………
    Sorry ” griff “. Looks like you’ve been drinking too much of the Communist Pig Koolaid……..yet again…….

  9. rah says:

    Nice post here: “NASA GISS Surface Station Temperature Trends Based On Sheer Guess Work, Made-Up Data, Says Japanese Climate Expert”
    https://notrickszone.com/2019/07/16/nasa-giss-surface-station-temperature-trends-based-on-sheer-guess-work-made-up-data-says-japanese-climate-expert/

  10. Jeff says:

    Tony, Amazon.post is reporting increase in MINIMUM temperatures over the past several decades.

    https://www.washingtonpost.com/weather/2019/07/17/widespread-oppressive-dangerous-heat-roast-much-us-through-weekend/?utm_term=.546db43ec125

    If you have the time, could you please address this data set? (How does that compare to the decrease in maximum temperatures? How related are they? Is the data good or cooked?) The data looks like it’s from the Fourth Annual Climate Assessment from 2018, because that’s linked in the article, but it also has the stamp of the NOAA – the link is:

    https://www.ncdc.noaa.gov/cag/national/time-series/110/tmin/3/8/1895-2019?base_prd=true&firstbaseyear=1901&lastbaseyear=2000

    Thanks, and keep up the great work

  11. John Plummer says:

    Isn’t it amazing how NYT journalists are so ignorant of what their newspaper has published in the past? Well, actually, perhaps not so amazing. When the predicted date for a climate Armageddon prediction comes and goes (with nothing happening of course) the NYT and all MSM are nowhere to be found!

  12. another Jim says:

    The NYtimes used to publish science news.
    In 1986 they reported that solar cycles effected the climate as seen through variable rock banding.
    https://www.nytimes.com/1986/11/18/science/solar-cycles-found-in-bands-of-rock.html

  13. RW says:

    I wonder if the North East heat in the 40s correlates with record heat you showed across France in 40s. Would implicate the oceans (atlantic) as the main driver of temp fluctuations for neighbouring landmasses.

Leave a Reply

Your email address will not be published. Required fields are marked *