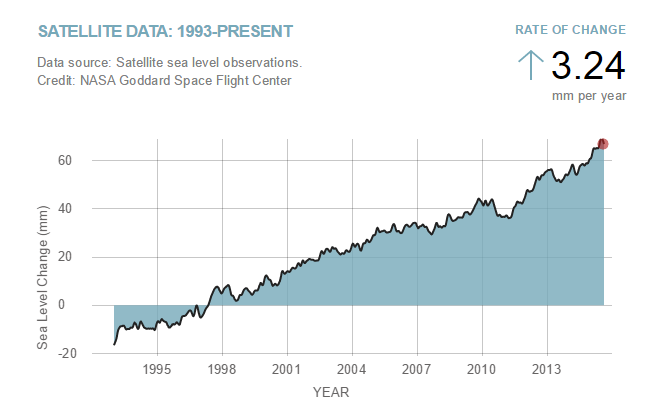
NASA shows 3.24 mm/year sea level rise on their web site. They call it “Facts” – when in fact it is blatant fraud.
Until early December 2015, NOAA had this web page up showing about half that much sea level rise. NOAA just made it disappear ahead of COP 21.
the absolute global sea level rise is believed to be 1.7-1.8 millimeters/year.
Here is the web archive link from September 10, 2015
September 10, 2015 : Sea Level Trends – Global Regional Trends
So let’s look at how NASA committed their fraud. The first thing they did was to add in a 0.3 mm/year “Global Isostatic Adjustment” (GIA) to their satellite data. This is a completely fraudulent adjustment based on theoretical sea floor sinking – which should be used to calculate the sea floor height, not the sea surface height. Even if sea surface height rise was dead zero, the GIA adjustment would show sea surface height increasing by 0.3 mm/year. Mind-blowing malfeasance.
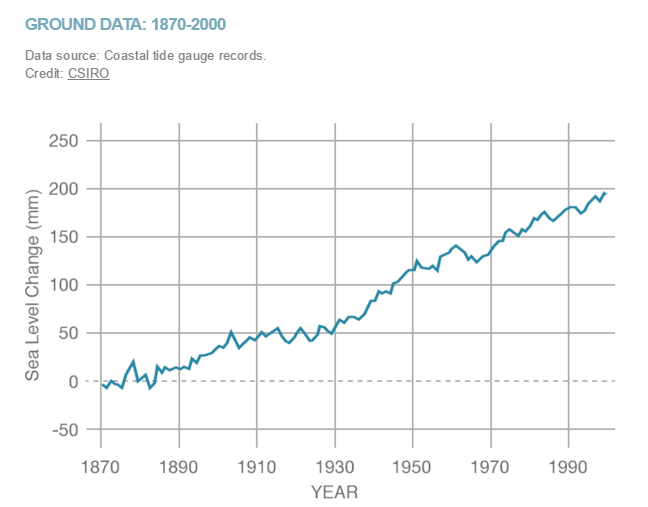
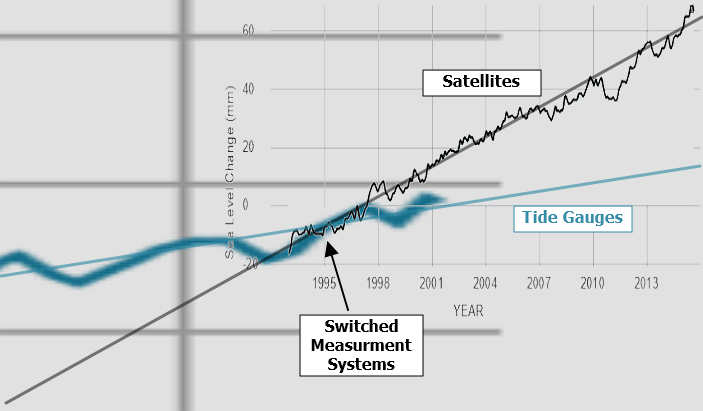
The next fraud was bait and switch. Until 1993, they use tide gauges, but after 1993 they switched to satellites.
This change in instrumentation to uncalibrated satellites produced an immediate doubling of sea level rise rates. Tide gauges do not show any change after 1993. They are attempting to blame an instrumentation change on climate change. Once again, mind-blowing malfeasance.
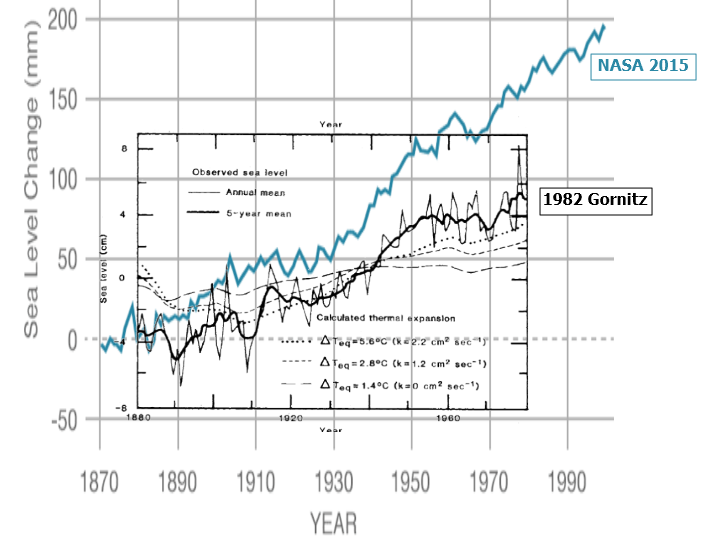
But it gets much worse. Their tide gauge data is also fraudulent, and does not agree with any historical publications, or current NOAA tide gauge data.
pubs.giss.nasa.gov/docs/1982/1982_Gornitz_etal_1.pdf
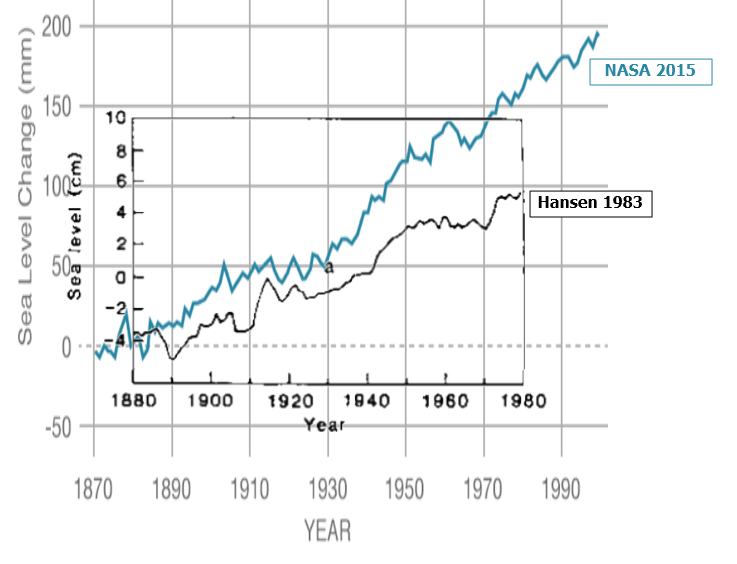
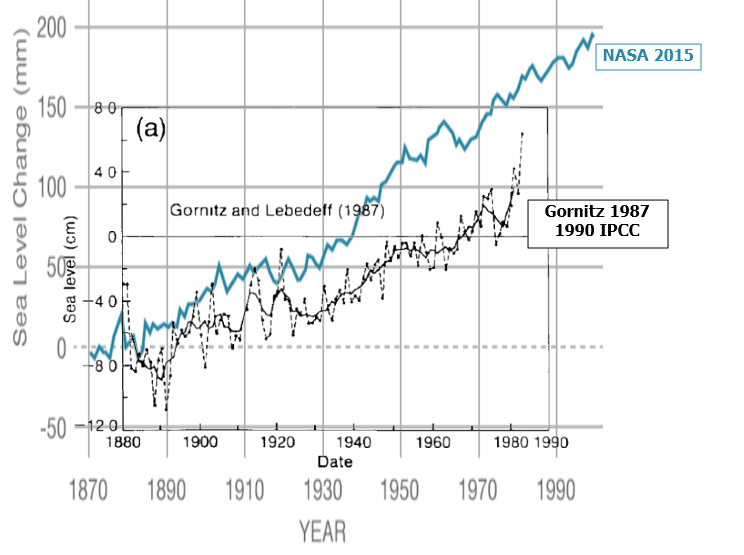
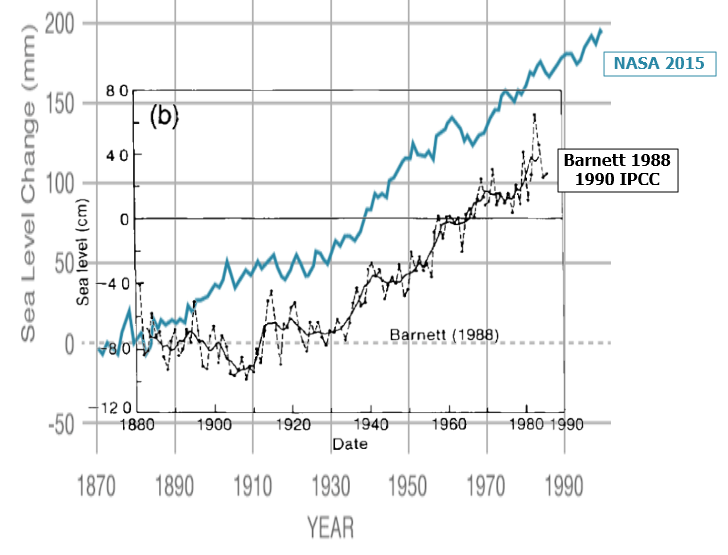
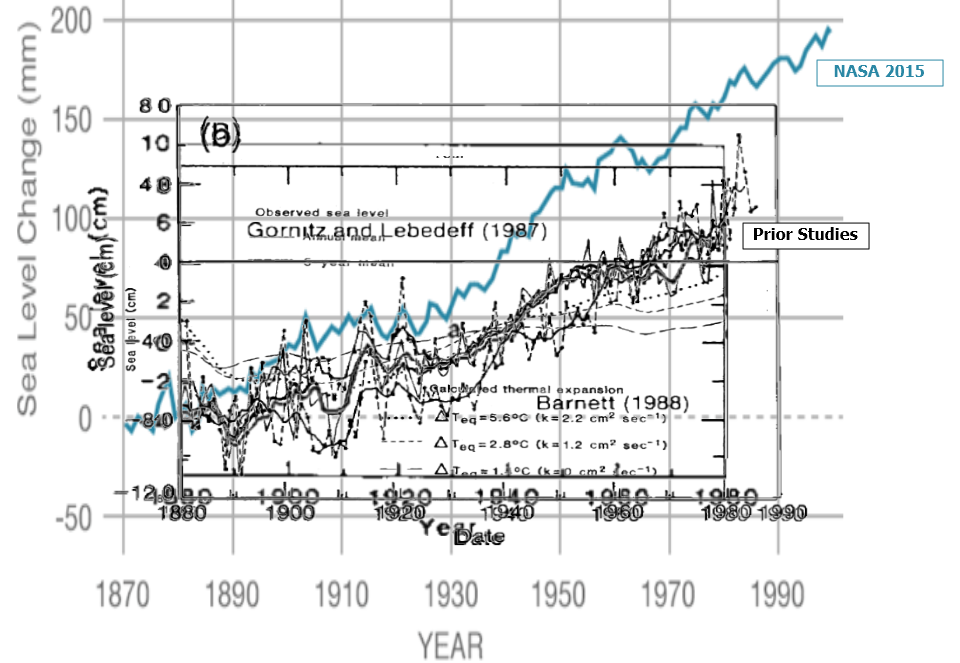
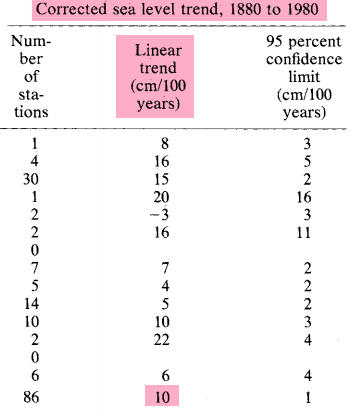
The composite below shows all of the above in one graph. Earlier studies consistently showed half the rate of 1880 to 1980 sea level rise, as NASA shows now.
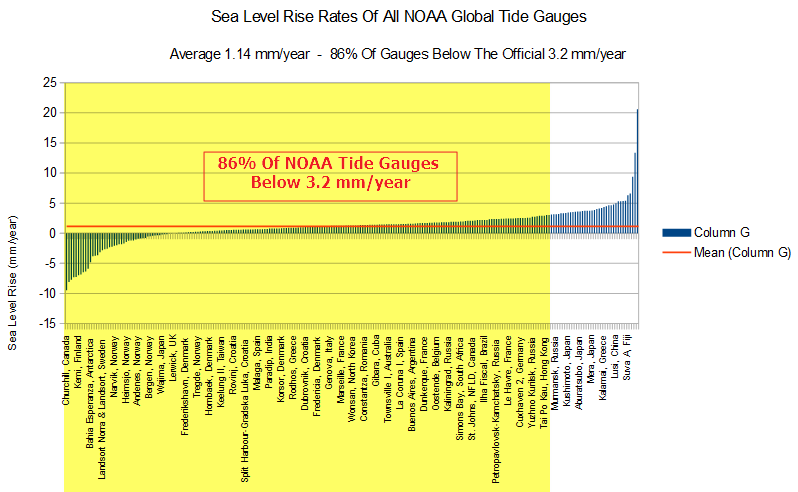
NOAA has 240 tide gauges globally, and 86% of them show less sea level rise than the claimed average of 3.2 mm/year. The average of all of the NOAA tide gauges is 1.14 mm/year, just over one third of the NOAA climate claims.
tidesandcurrents.noaa.gov/sltrends/MSL_global_trendtable.html
In 1982, NASA showed 1 mm/year. Now they claim 3.24 mm/year
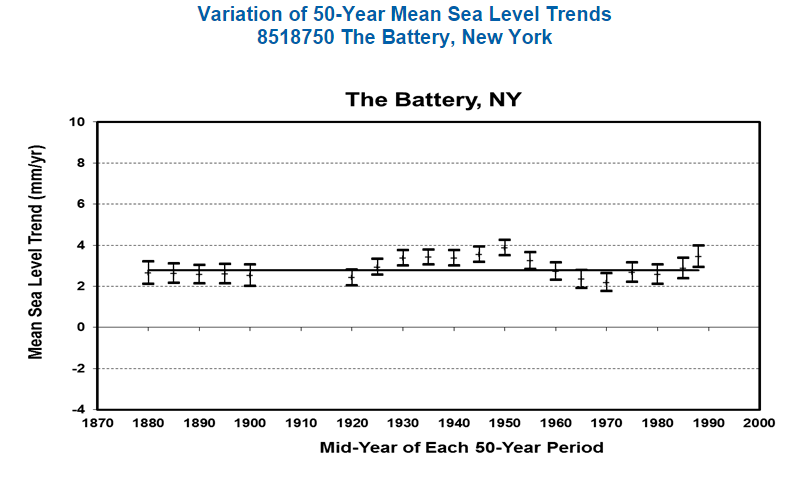
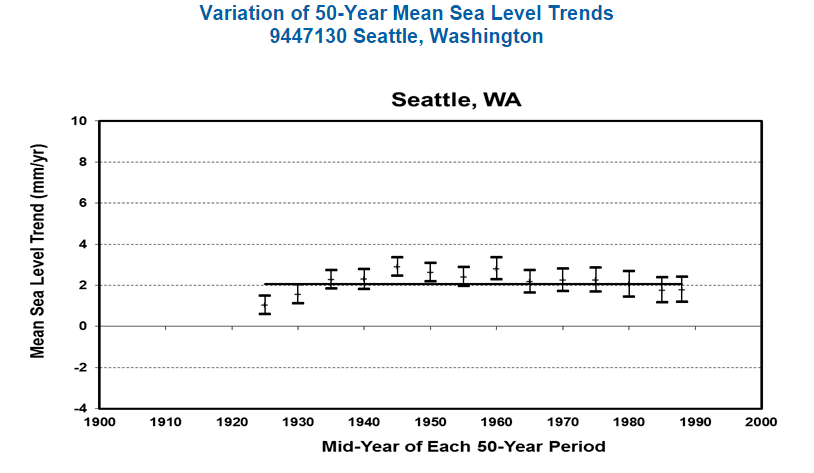
Tide gauges show that sea level rise rates peaked around 1950. The claimed increase since 1993 is completely fraudulent.
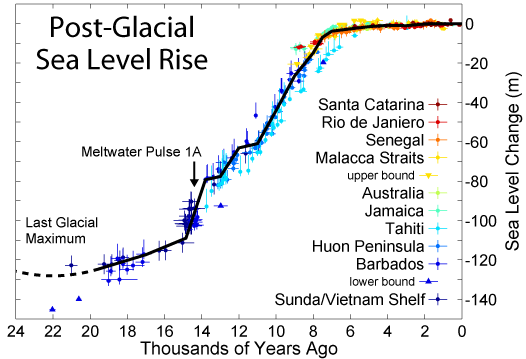
Sea level has been rising for 20,000 years – and raise rates have slowed considerably.
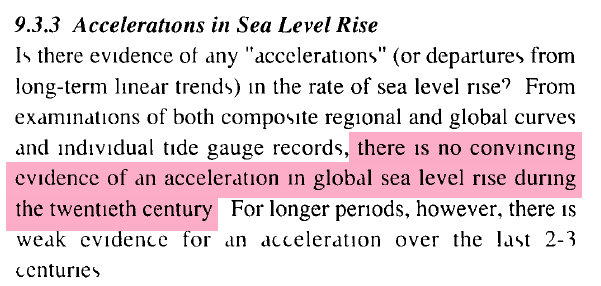
The 1990 IPCC report said there is “no convincing evidence of acceleration” during the 20th century.
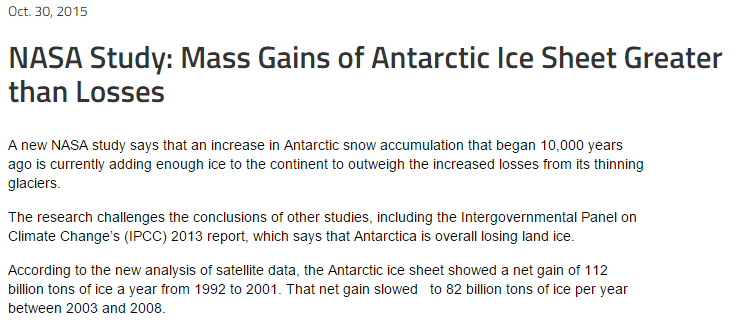
Every single thing NASA says about sea level is fraudulent. NASA’s own data says that Antarctica ice growth is reducing sea level.
NASA Study: Mass Gains of Antarctic Ice Sheet Greater than Losses | NASA
Their sea level operation is a propaganda outlet. They are not scientists and are not doing any legitimate science.




Top Posting VIP glad to see old deleted files are being kept for proof of fraud
And since 2004 the satellite data has been steadily adjusted upwards.
http://oi67.tinypic.com/ojdn6h.jpg
Truly – and I don’t say this lightly – you perform a service to the rational world against the forces of climate hysteria spin.
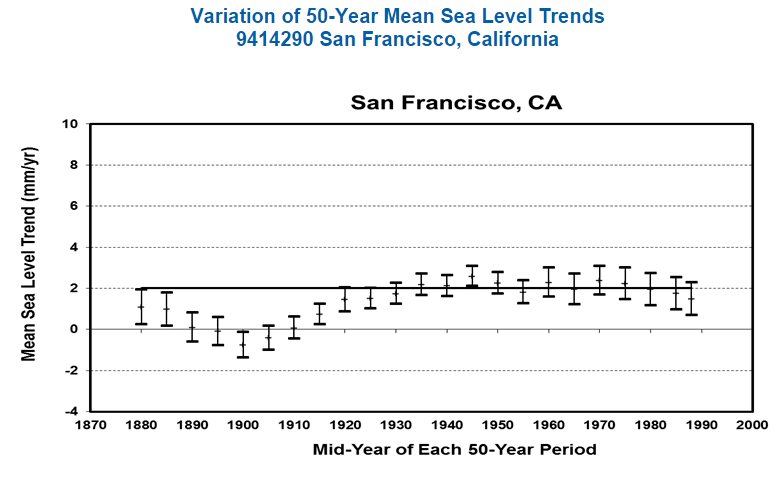
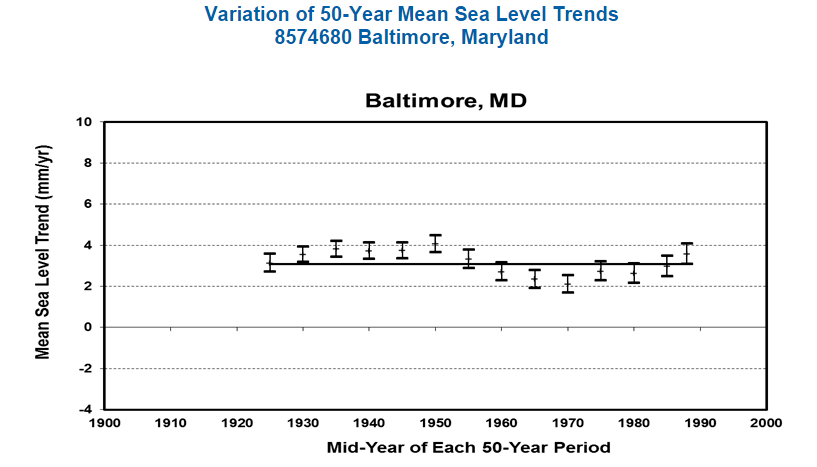
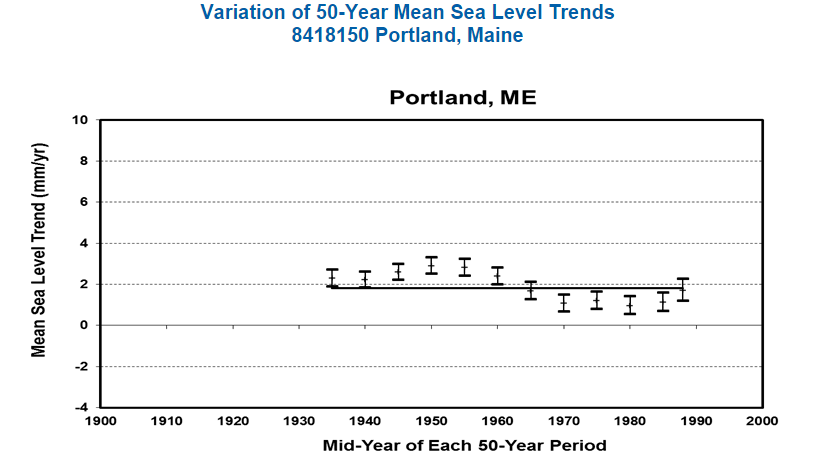
Note how Baltimore and Portland follow the sine wave
https://i2.wp.com/oi61.tinypic.com/ju7fw9.jpg
I think these people climate scientists are so stupid that maybe they deserve this. Let the scam go ahead and everybody get involved and see what happens to the next generation poverty, cold, huge debt, Most of Europe, USA Canada, Australia descend to 4th world status. Lets all become warmistas LOL
And yet the media never report the fraud.
Report what?
https://www.youtube.com/watch?v=vUkw3Dn3u-M
Nothing to see here, move along.
NASA has become notorious for Climate Fraud but I don’t believe they are the worse. There is also evidence to appropriate lunacy,,, those morons actually believe their own findings…
What do alarmists and dogs have in common?
https://i.ytimg.com/vi/zVTMKBJaLT4/hqdefault.jpg
http://www.denherdervet.com/wp-content/uploads/2013/06/yay-poop.jpg
Gees, you can almost smell the poop-breathe of that pup on the right of the second picture.
NOAA has 240 tide gauges globally, and 86% of them show less sea level rise than the claimed average..
==
University of Israel looked at those 240 gauges…and found that 65% of them showed no sea level rise at all….
http://pluto.mscc.huji.ac.il/~msdfels/wpapers/Tide%20gauge%20location.pdf
Which makes you question….what gauges are they using to calibrate the satellites??
“Which makes you question….what gauges are they using to calibrate the satellites??”
You have that entirely backward. The satellites are being used to calibrate the tide gauges. Once there’s a long enough satellite record to properly compare them, the tide gauges will be adjusted to match.
Reblogged this on Climatism and commented:
When measuring the temperature of the atmosphere, NASA and the climate crisis industry refuse to acknowledge the much more comprehensive and accurate satellite data sets, UAH and RSS, as both show no global warming at all over the past 20 years. Instead they opt for the UHI effected and massively tampered with, GISStemp land-based data set.
Yet to measure sea-level rise, they are more than happy to use satellite data, over (land-based) tidal gauge data, when a glitch in the system fits their warming bias.
Shameless cherry picking and the biggest wilful scientific scandal in history.
I really think we should let the warmistas get away with it including NOAA, NASA, BOM. I really don’t care I will be dead by the time the shit hits the fan LOL hahahahaha
what is the deal with Hitler? Yes, i know it’s popular to hate Hitler, but you should really do a little more research about what was happening in Europe prior to WWII, and maybe not believe every horror story the government institutions like to tell everyone without actually seeing any real evidence for it.
If you look at the state of our economy, you are probably wrong about that unless you’re in your 90’s or taking statins or something.
I doubt that. The shit is going to hit the fan very soon now.
Billions will die but the majority have always been incredibly stupid ninety nine % germans thought HITLER was a smart man hahah so do warmistas so lets join them
what is the deal with Hitler? Yes, i know it’s popular to hate Hitler, but you should really do a little more research about what was happening in Europe prior to WWII, and maybe not believe every horror story the government institutions like to tell everyone without actually seeing any real evidence for it.
Satellite sea level data seems to be suffering from truth decay.
http://en.wikipedia.org/wiki/Orbital_decay
Maybe someone from the US can match the charts above for Battery, Seattle, Sa Francisco, Baltimore, Portland against the Vu data from this table.
ftp://cors.ngs.noaa.gov/cors/coord/coord_08/nad83_2011_geo.comp.txt
I suspect you will find a slight subsidence on those five points.
Obama same as Chamberlain 1937 “Hitler is a great and good man” 180 million died because of this very very very stupid man. History is repeating re AGW and ISIS. Maybe these people deserve what they are going to get for their stupidity
The people backing this project seem unconcerned about sea-level rise:
http://www.designboom.com/architecture/isay-weinfeld-fasano-hotel-and-residences-at-shore-club-miami-beach-08-20-2015/?utm_campaign=daily&utm_medium=e-mail&utm_source=subscribers
It may seem repetitive to keep posting this scientific tide, temperature and historic fraud that IPCC, NOAA, NASA, BOM, etc. keep doing, but it is so staggering in its scale that we need to be constantly reminded that it really happening and that these people are douing it deliberately and criminally to fool us all.
Tony, you may have missed some of the earlier “adjustments. See –
There Is No Alarming Sea Level Rise! by Nils-Axel Mörner
the El Niño/La Niña-Southern Oscillation, a quasi-periodic climate pattern that occurs across the tropical Pacific Ocean every few years.) Therefore, a much more realistic approach is to treat that ENSO-signal as a separate event, superimposed on the long-term trend, as shown in Figure 6 (Mörner 2004). Figure 6 shows a variability (of ±10 mm) around a stable zero level (blue line) and a strong ENSO-event (yellow lines) in 1997. The trend thereafter is less clear (gray lines). This graph provides no indication of any rise over the time-period covered (Mörner 2004, 2007a, 2007c).
When the satellite altimetry group realized that the 1997 rise was an ENSO signal, and they extended the trend up to 2003, they seemed to have faced a problem: There was no sea level
rise visible, and therefore a “reinterpretation” needed to be undertaken.
Originally, it seemed that this extra, unspecified “correction” referred to the global isostatic adjustment (GIA) given as 2.4 mm/year (see, for example, Peltier 1998) or 1.8 mm/year (IPCC 2001). The zero isobase of GIA according to Peltier (1998) passed through Hong Kong, where one tide-gauge gives a relative sea level rise of 2.3 mm/year. This is exactly the value appearing in Figure 7. This tide-gauge record is contradicted by the four other records existing in Hong Kong, and obviously represents a site specific subsidence, a fact well known to local geologists.
Nevertheless, a new calibration factor has been introduced in the Figure 7 graph. At the Moscow global warming meeting in 2005, in answer to my criticisms about this “correction,” one of the persons in the British IPCC delegation said, “We had to do so, otherwise there would not be any trend.” To this I replied: “Did you hear what you were saying? This is just what I am accusing you of doing.”
http://www.21stcenturysciencetech.com/Articles_2011/Winter-2010/Morner.pdf