

Disrupting the Borg is expensive and time consuming!

Google Search
-
Recent Posts
- El Nino To The Rescue
- Bullseye!
- It’s Getting Closer
- Greenland Meltdown Scam
- Greenland Ice Update
- Wyoming Gold
- Three Years Since The Apocalypse
- Arctic Report card Summer 2026
- Elon Pushing Pushing Geoengineering
- Earth, Wind And Fire
- On The Road Again
- Vandalism At The Reflecting Pool
- Fifty Years Ago Today
- Truth Or Consequences
- US Climate Trend Maps
- Declining Spring Snow Cover In Northern New Mexico
- You Can’t Fool Mother Nature
- Cattle And The Climate
- One Atomic Bomb Per Hour
- New Video : Analyzing Oil And Gas
- Is Antarctica Melting?
- High Speed Analysis And Visualization
- El Nino To The Rescue?
- Fake News Update
- Growth Of Antarctic Sea Ice
Recent Comments
- Stuart Hamish on Three Years Since The Apocalypse
- Stuart Hamish on Cattle And The Climate
- Stuart Hamish on Cattle And The Climate
- Stuart Hamish on Cattle And The Climate
- Bob G on Bullseye!
- conrad ziefle on Bullseye!
- arn on Greenland Ice Update
- D. Boss on Bullseye!
- D. Boss on Bullseye!
- scott allen on Bullseye!
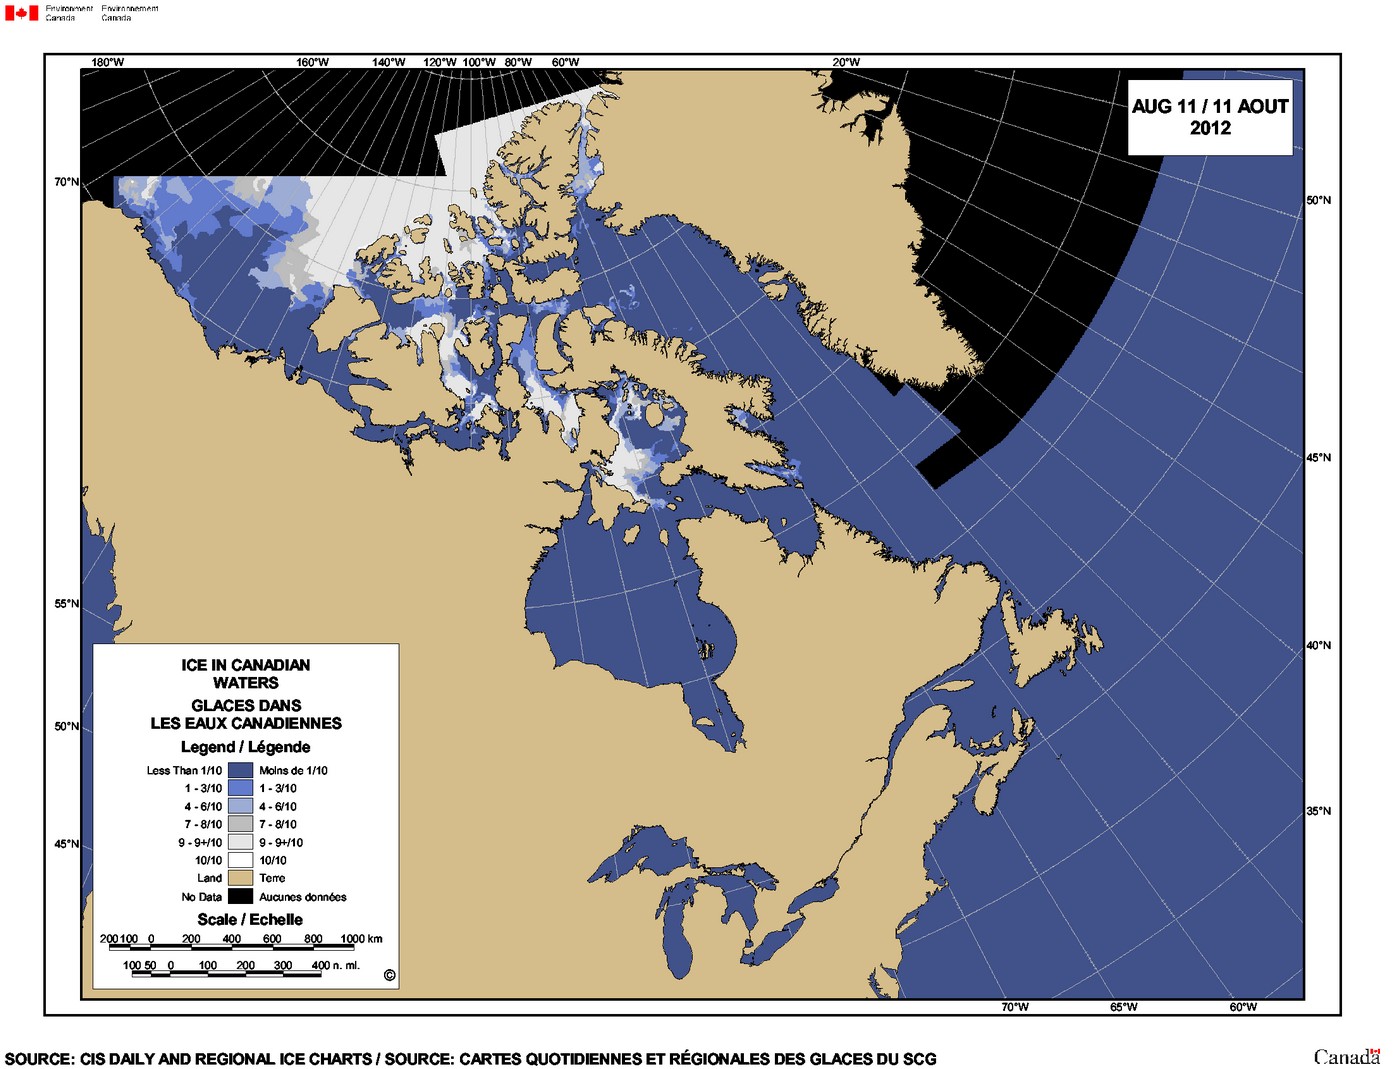
Here’s a couple ice charts from the Canadian Ice Service.
Chukchi Sea(part of it)
http://ice-glaces.ec.gc.ca/prods/WIS45CT/20120810180000_WIS45CT_0006587119.gif
The lower right of the above chart is the top center of this one for the Alaskan coast(part of it)
http://ice-glaces.ec.gc.ca/prods/WIS40CT/20120810180000_WIS40CT_0006587105.gif
Looks like 20-50% ice concentrations for these parts.
2012 already at a record low, and still heading down! 2 -3 wks to go.
http://www.iup.uni-bremen.de:8084/ssmis/extent_n_running_mean_regularF17.png
Jay Zwally