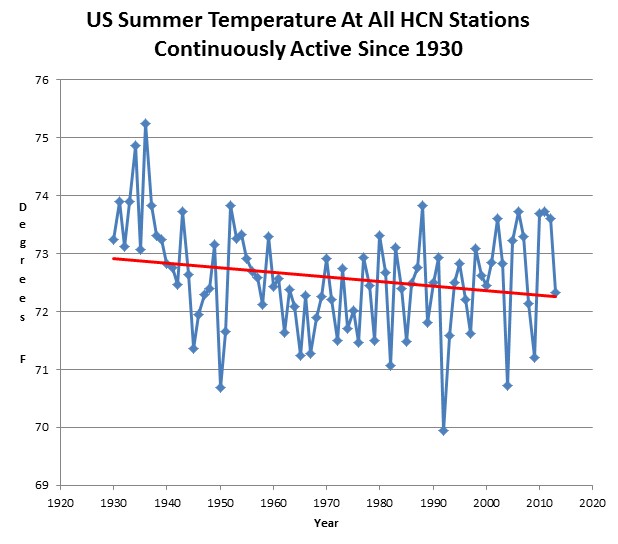
US summer temperatures have declined over the last 80 years.
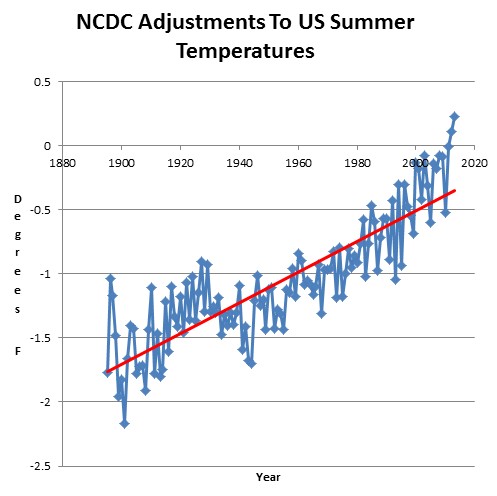
Cooler summers aren’t going to scare anyone into funding climate fraud, so NCDC has created a hockey stick of adjustments, cooling older temperatures by as much as two degrees, and warming the most recent summers in a very impressive hockey stick of data tampering.


What’s 2 degrees among friends?
You might want to put the “p” in temperature in the first headline.
I’ve often thought that you could take the high / low records database (which presumably could have no adjustments whatsoever), and from the temperature frequency distributions, determine the level of adjustment fraud going on. It wouldn’t be exact, but there is so much data I think it would be a very small error.
Oh Mann..
Piltdown Mann wouldn’t be lying to us peasants now would he ?
But…but, Steve Mosher says it’s because temperatures in the past WERE cooler and that temperatures now ARE hotter. If he was any more obtuse, he’d be a straight line.
More temp data fraud:
The adjustments made by NASA on GISS temperature data are manifest even in Australia.
Comparison between GISS and the Australian BOM data record for Alice Springs (albeit GISS is mean T and BOM is mean maximum T) shows that GISS have cooled the past by at least 1 deg C.
And the Alice Springs Airport is susceptible to UHI, meaning there was likely no warming over 60 years.
http://www.bom.gov.au/jsp/ncc/cdio/weatherData/av?p_display_type=dataGraph&p_stn_num=015590&p_nccObsCode=36&p_month=13
http://data.giss.nasa.gov/cgi-bin/gistemp/show_station.cgi?id=501943260000&dt=1&ds=14
OT from the Typhoon
but as evidence of the UHI effect in the Alice Springs temp record.
Alice Springs airport – 1950, see photo, it’s over the back, dirt strip.
http://blogs.abc.net.au/nt/2008/11/alice-stuart-tu.html
Alice Springs Airport – 2000’s
http://www.thelivingmoon.com/45jack_files/04images/Pine_Gap/Alice_Springs_Airport_001.png
Translation from a recent comment I made:
The global average temperature data sets that rely on land thermometers and re-adjustments to them, ARE NO LONGER PEER REVIEWED. They are merely updated on web sites, with massive near degree changes in past temperatures. No articles in Nature or Science appear, to be critiqued, with the re-adjustments explained in detail. NASA even then deletes old data from their archives! The published National Climatic Data Center (NCDC) data adjustment claims are miniscule compared to the *actual* multi-degree difference curves created by subtracting old from new plots up to the year the old data set stopped at.
Temperature records are no longer science, yet as they appear in IPCC reports as references as cited in this study, they *appear* to be peer reviewed literature references which they are *not*.
The y-axis are different between the two graphs. Do you have the uncorrected data set in an excel format or txt so they can be normalized? The transformation doesn’t matter because the slope in the original data is negative and the slope is positive in the transformed set. Clearly not a transformation issue with the trend.
If you count the number of stations reporting continuously from 1933 to the present day, you’ll find that the majority of the stations lie east of the 100th longitude. However, stations east of the 100th show primarily negative trends, whereas stations west of the 100th show mainly positive trends. That means that a simple average is a biased statistic. So what is different about the eastern weather stations? The answer would appear to be that 90% of the United States croplands lie in this area, and the cropland area together with irrigation has been increasing since 1930. All this is verifiable from the NCDC data and other sources.