

Disrupting the Borg is expensive and time consuming!

Google Search
-
Recent Posts
- Cattle And The Climate
- One Atomic Bomb Per Hour
- New Video : Analyzing Oil And Gas
- Is Antarctica Melting?
- High Speed Analysis And Visualization
- El Nino To The Rescue?
- Fake News Update
- Growth Of Antarctic Sea Ice
- 65 Years Of Progress!
- El Nino To The Rescue?
- Worst March Drought On Record
- ChartGL Process Control Demo
- The Biggest Money Laundering Scam
- Drought In The Headwaters Of Lake Powell
- Unrealistic Expectations Of Water Availability
- Did Bill Gates Do This?
- Worst March Drought On Record In The US
- The Real Hockey Stick Graph
- Analyzing The Western Water Crisis
- Gaslighting 1924
- “Why Do You Resist?”
- Climate Attribution Model
- Fact Checking NASA
- Fact Checking Grok
- Fact Checking The New York Times
July 2026 M T W T F S S 1 2 3 4 5 6 7 8 9 10 11 12 13 14 15 16 17 18 19 20 21 22 23 24 25 26 27 28 29 30 31 Recent Comments
- arn on Cattle And The Climate
- Bob G on Cattle And The Climate
- Robertvd on Cattle And The Climate
- Bob G on Cattle And The Climate
- Robertvd on Cattle And The Climate
- Billyjack on Cattle And The Climate
- Bob G on Cattle And The Climate
- Robertvd on Cattle And The Climate
- Robertvd on Cattle And The Climate
- Robertvd on Cattle And The Climate
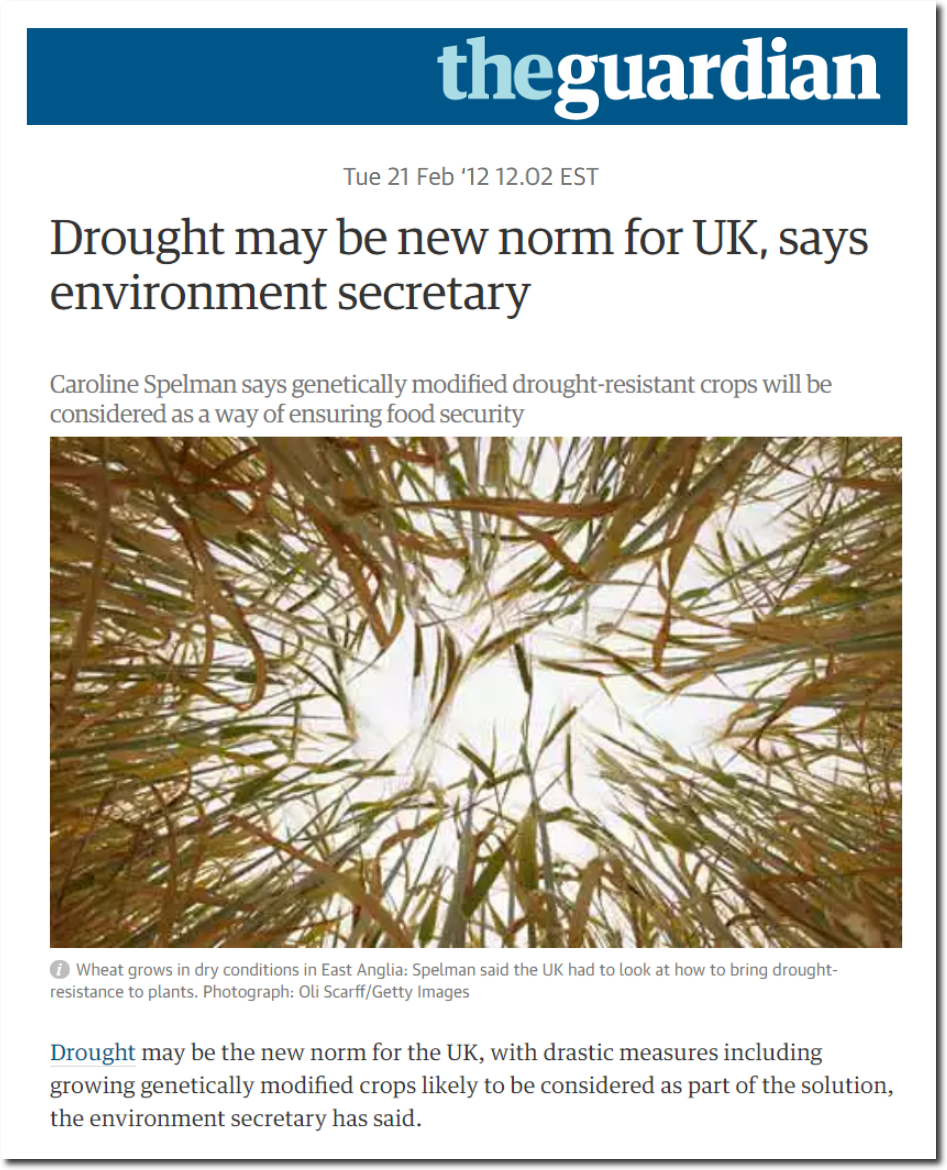
Three Years Since The Methane Catastrophe, And Six Years Since The UK Permanent Drought
Posted in Uncategorized
Leave a comment
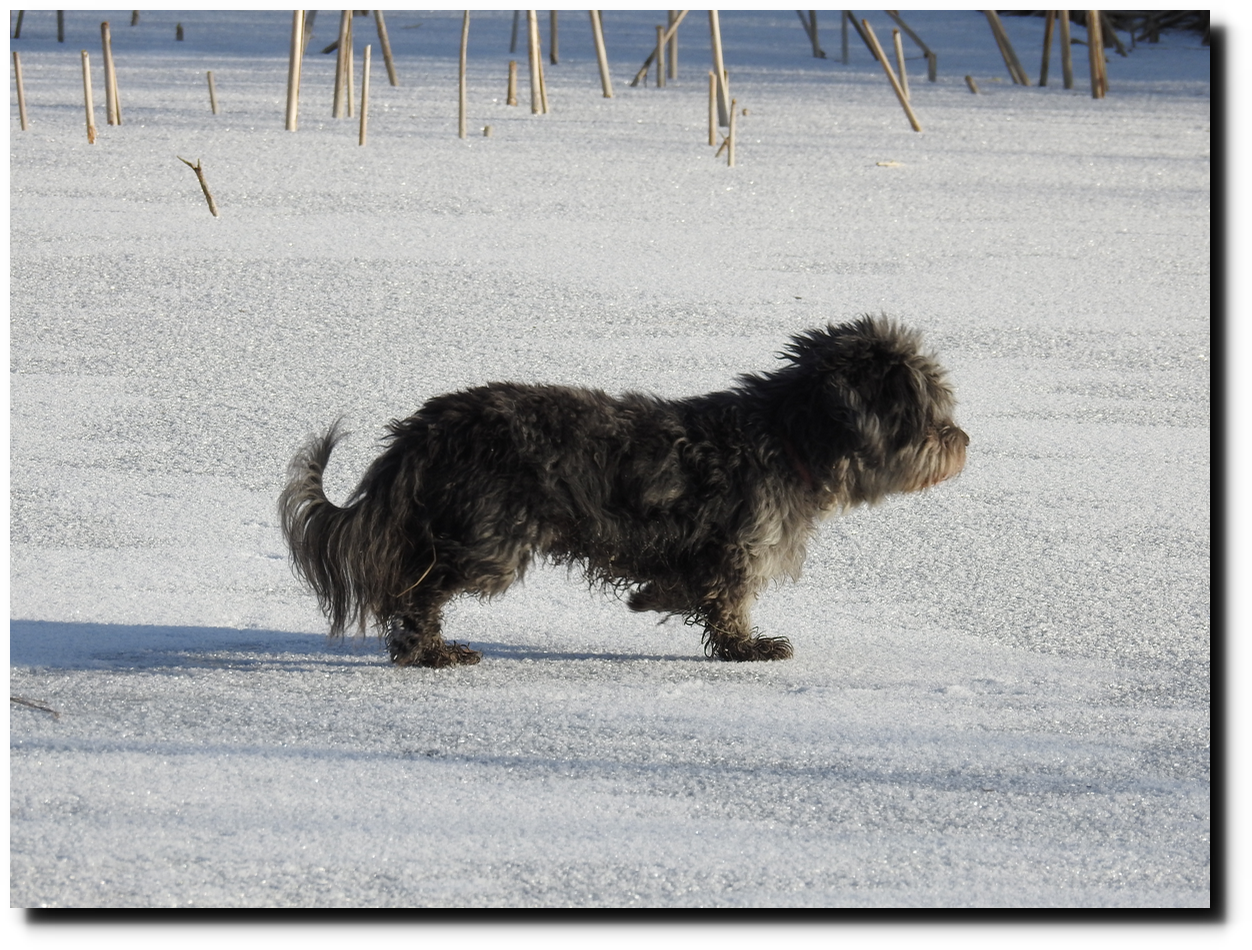
Toto Locates The Missing Arctic Ice
Climate experts say Arctic ice is disappearing at -35C. Fortunately, Toto has located it in Colorado.
Posted in Uncategorized
Leave a comment
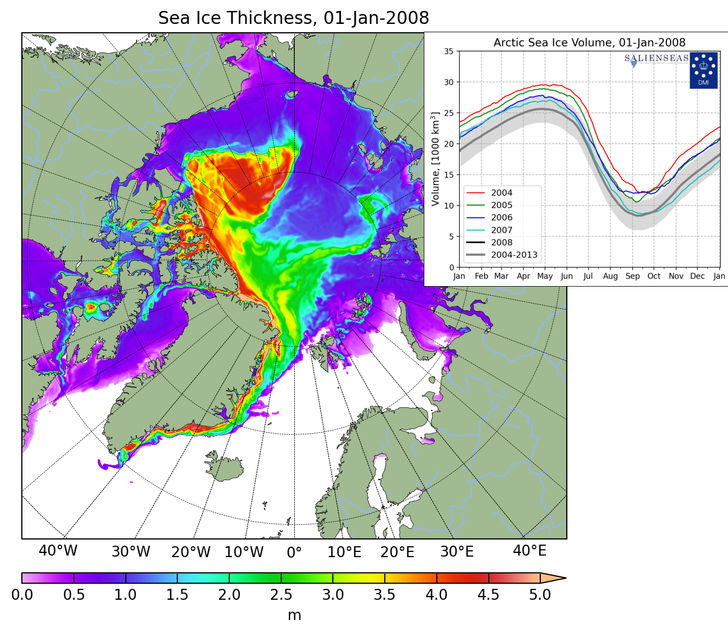
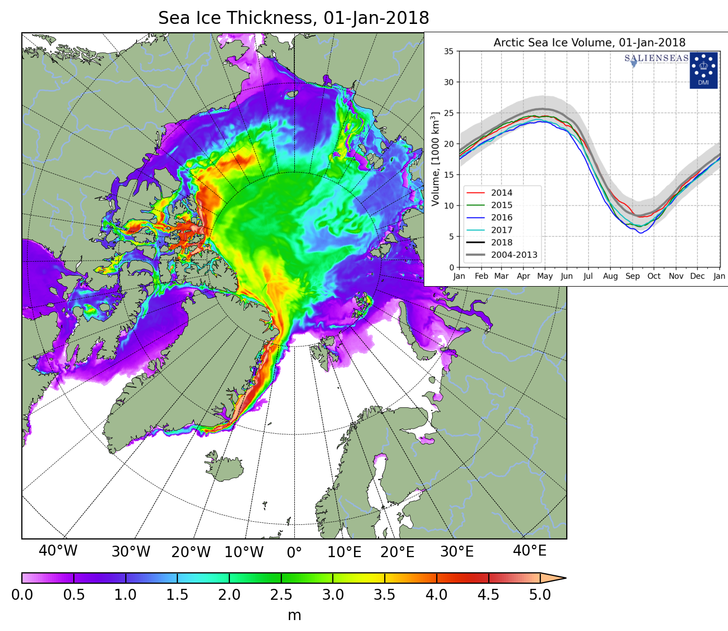
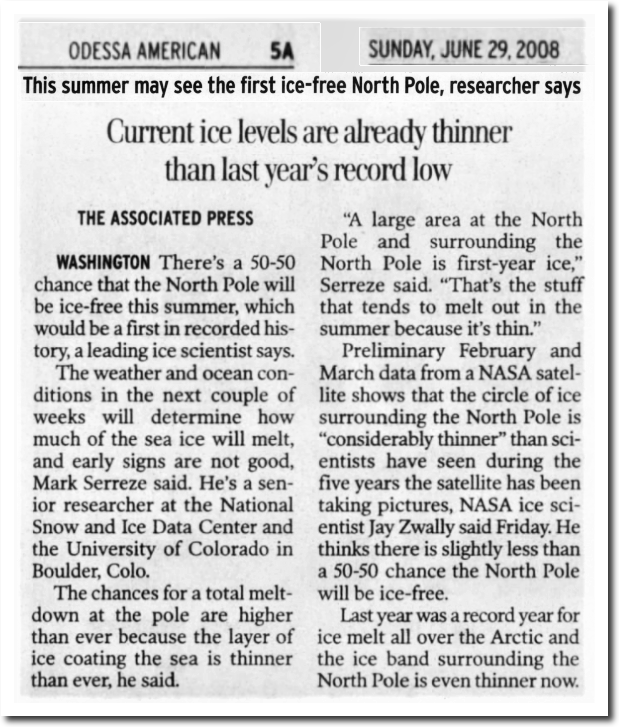
End Of Year Arctic Fraud Report
There has been a large increase in Arctic sea ice thickness and volume over the past ten years. The exact opposite of what government scientists fraudsters tell the press.
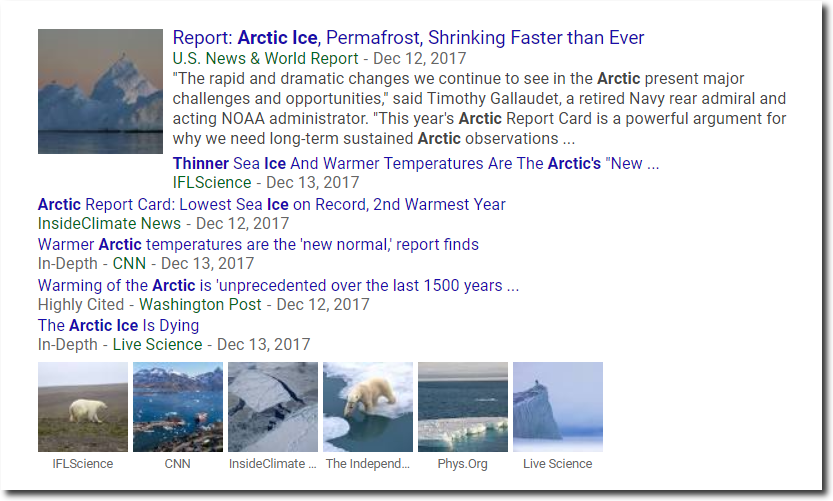
Ten years ago experts predicted the North Pole would be ice free that summer, but now (after ten years of growth) they say it is melting faster than ever.
Posted in Uncategorized
Leave a comment
Understanding The Difference Between Natural And Man-Made Temperature Swings
It can be confusing differentiating between natural 12.0°C warming, and unprecedented man-made 0.7°C warming. So I prepared this chart to help out.
Posted in Uncategorized
Leave a comment
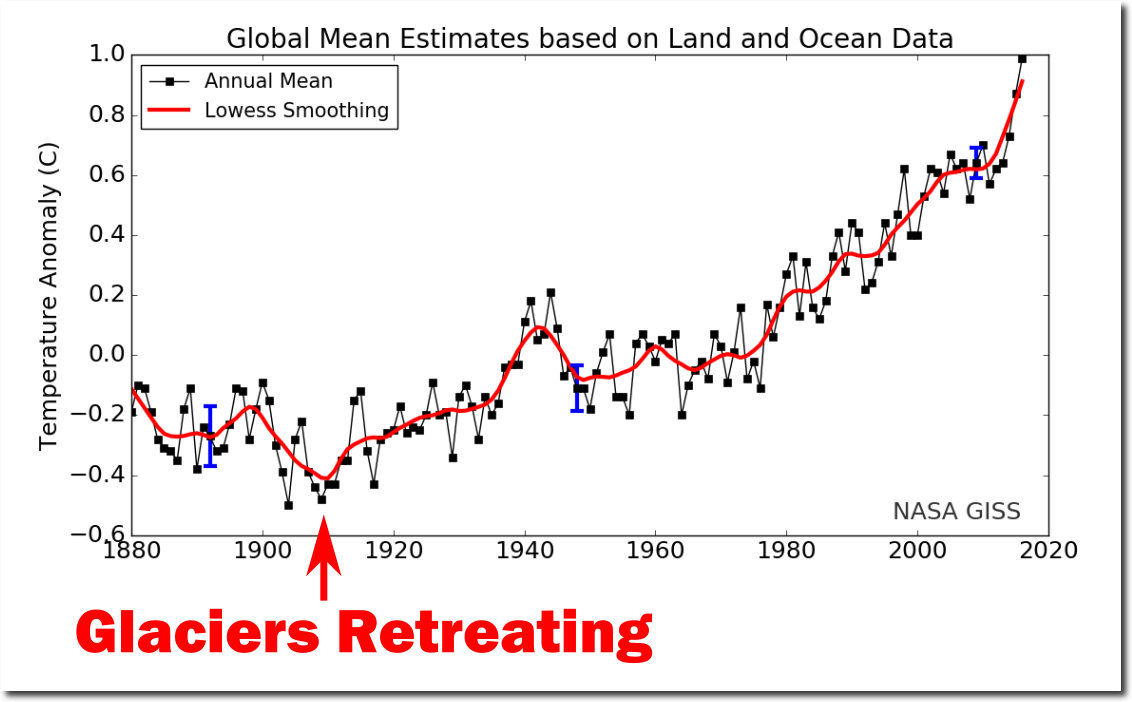
Fighting Climate Superstition
A favorite superstition of climate alarmists is that glaciers are retreating because NASA’s fake temperature graphs indicate Earth is heating up.
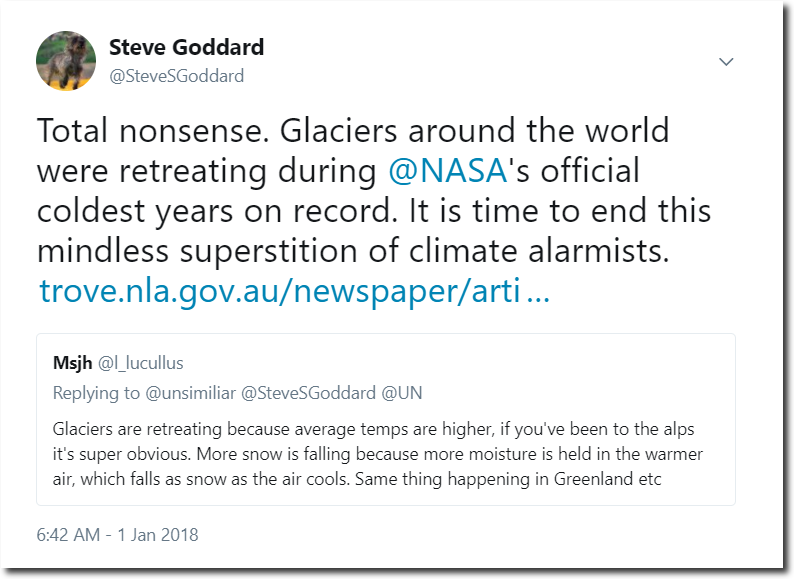
Glaciers have been retreating for 20,000 years, when Chicago was under a mile of ice – and they were retreating during NASA’s coldest years on record.

29 Oct 1910 – RECEDING GLACIERS. – Trove
Posted in Uncategorized
Leave a comment
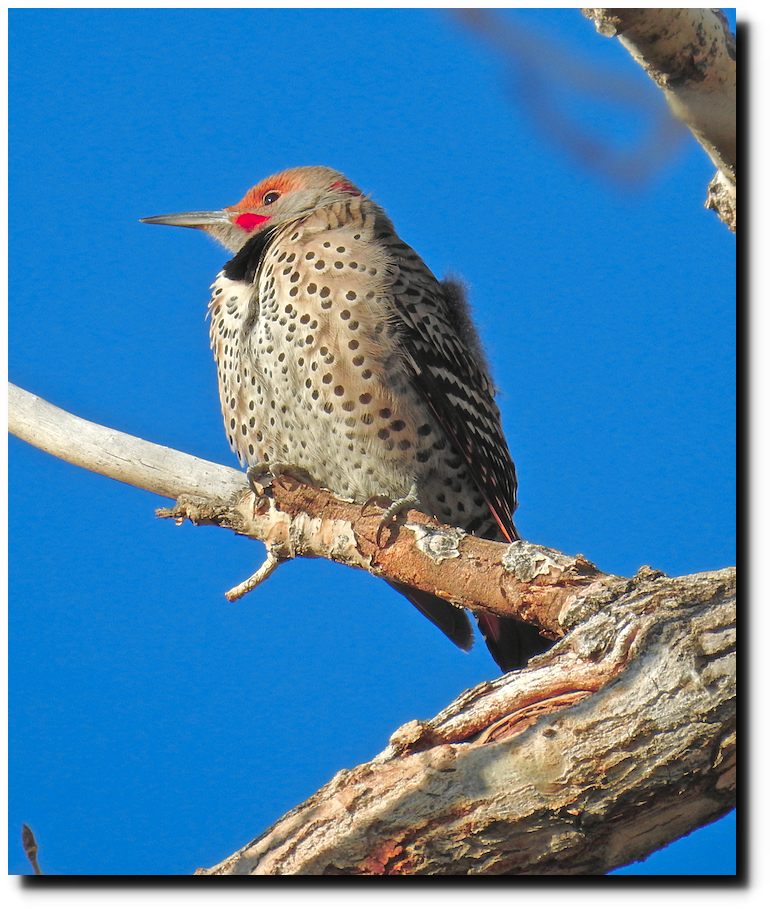
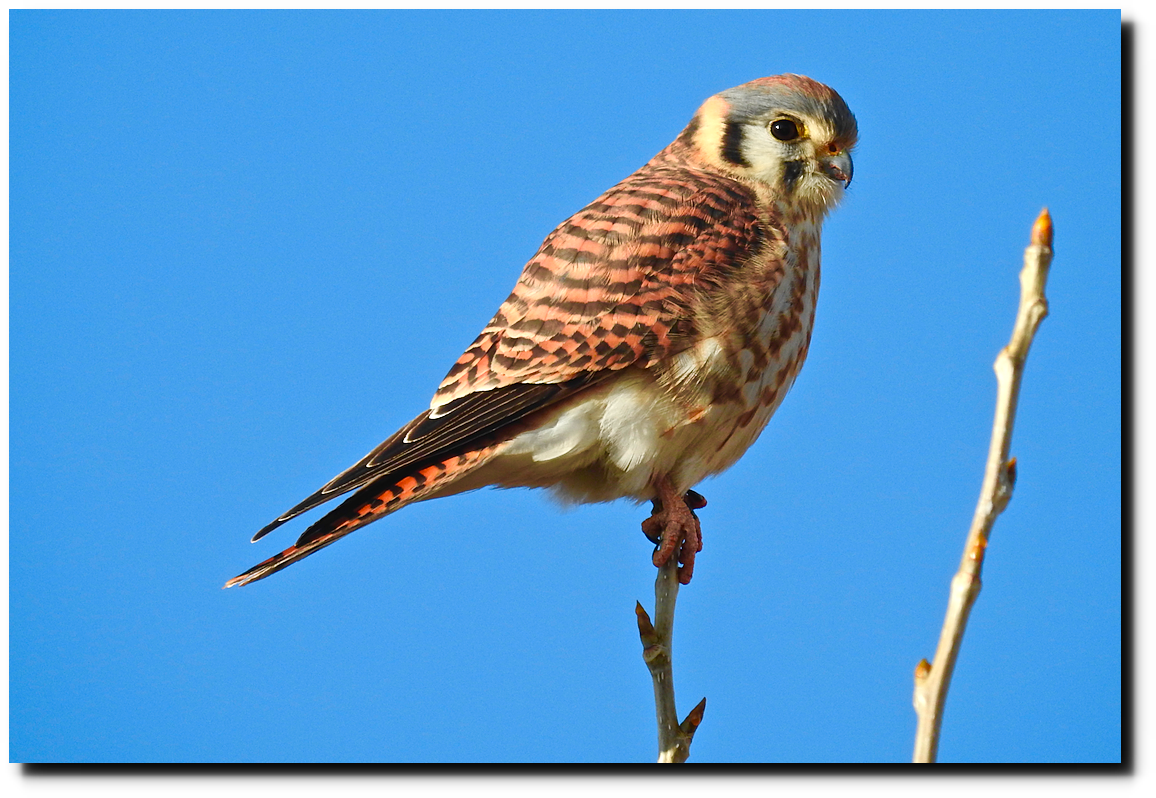
Quality – Not Quantity
We have very few birds this time of year – but they are good ones. This is what I was doing this afternoon while many stayed home and watched football on the idiot box.
Posted in Uncategorized
Leave a comment
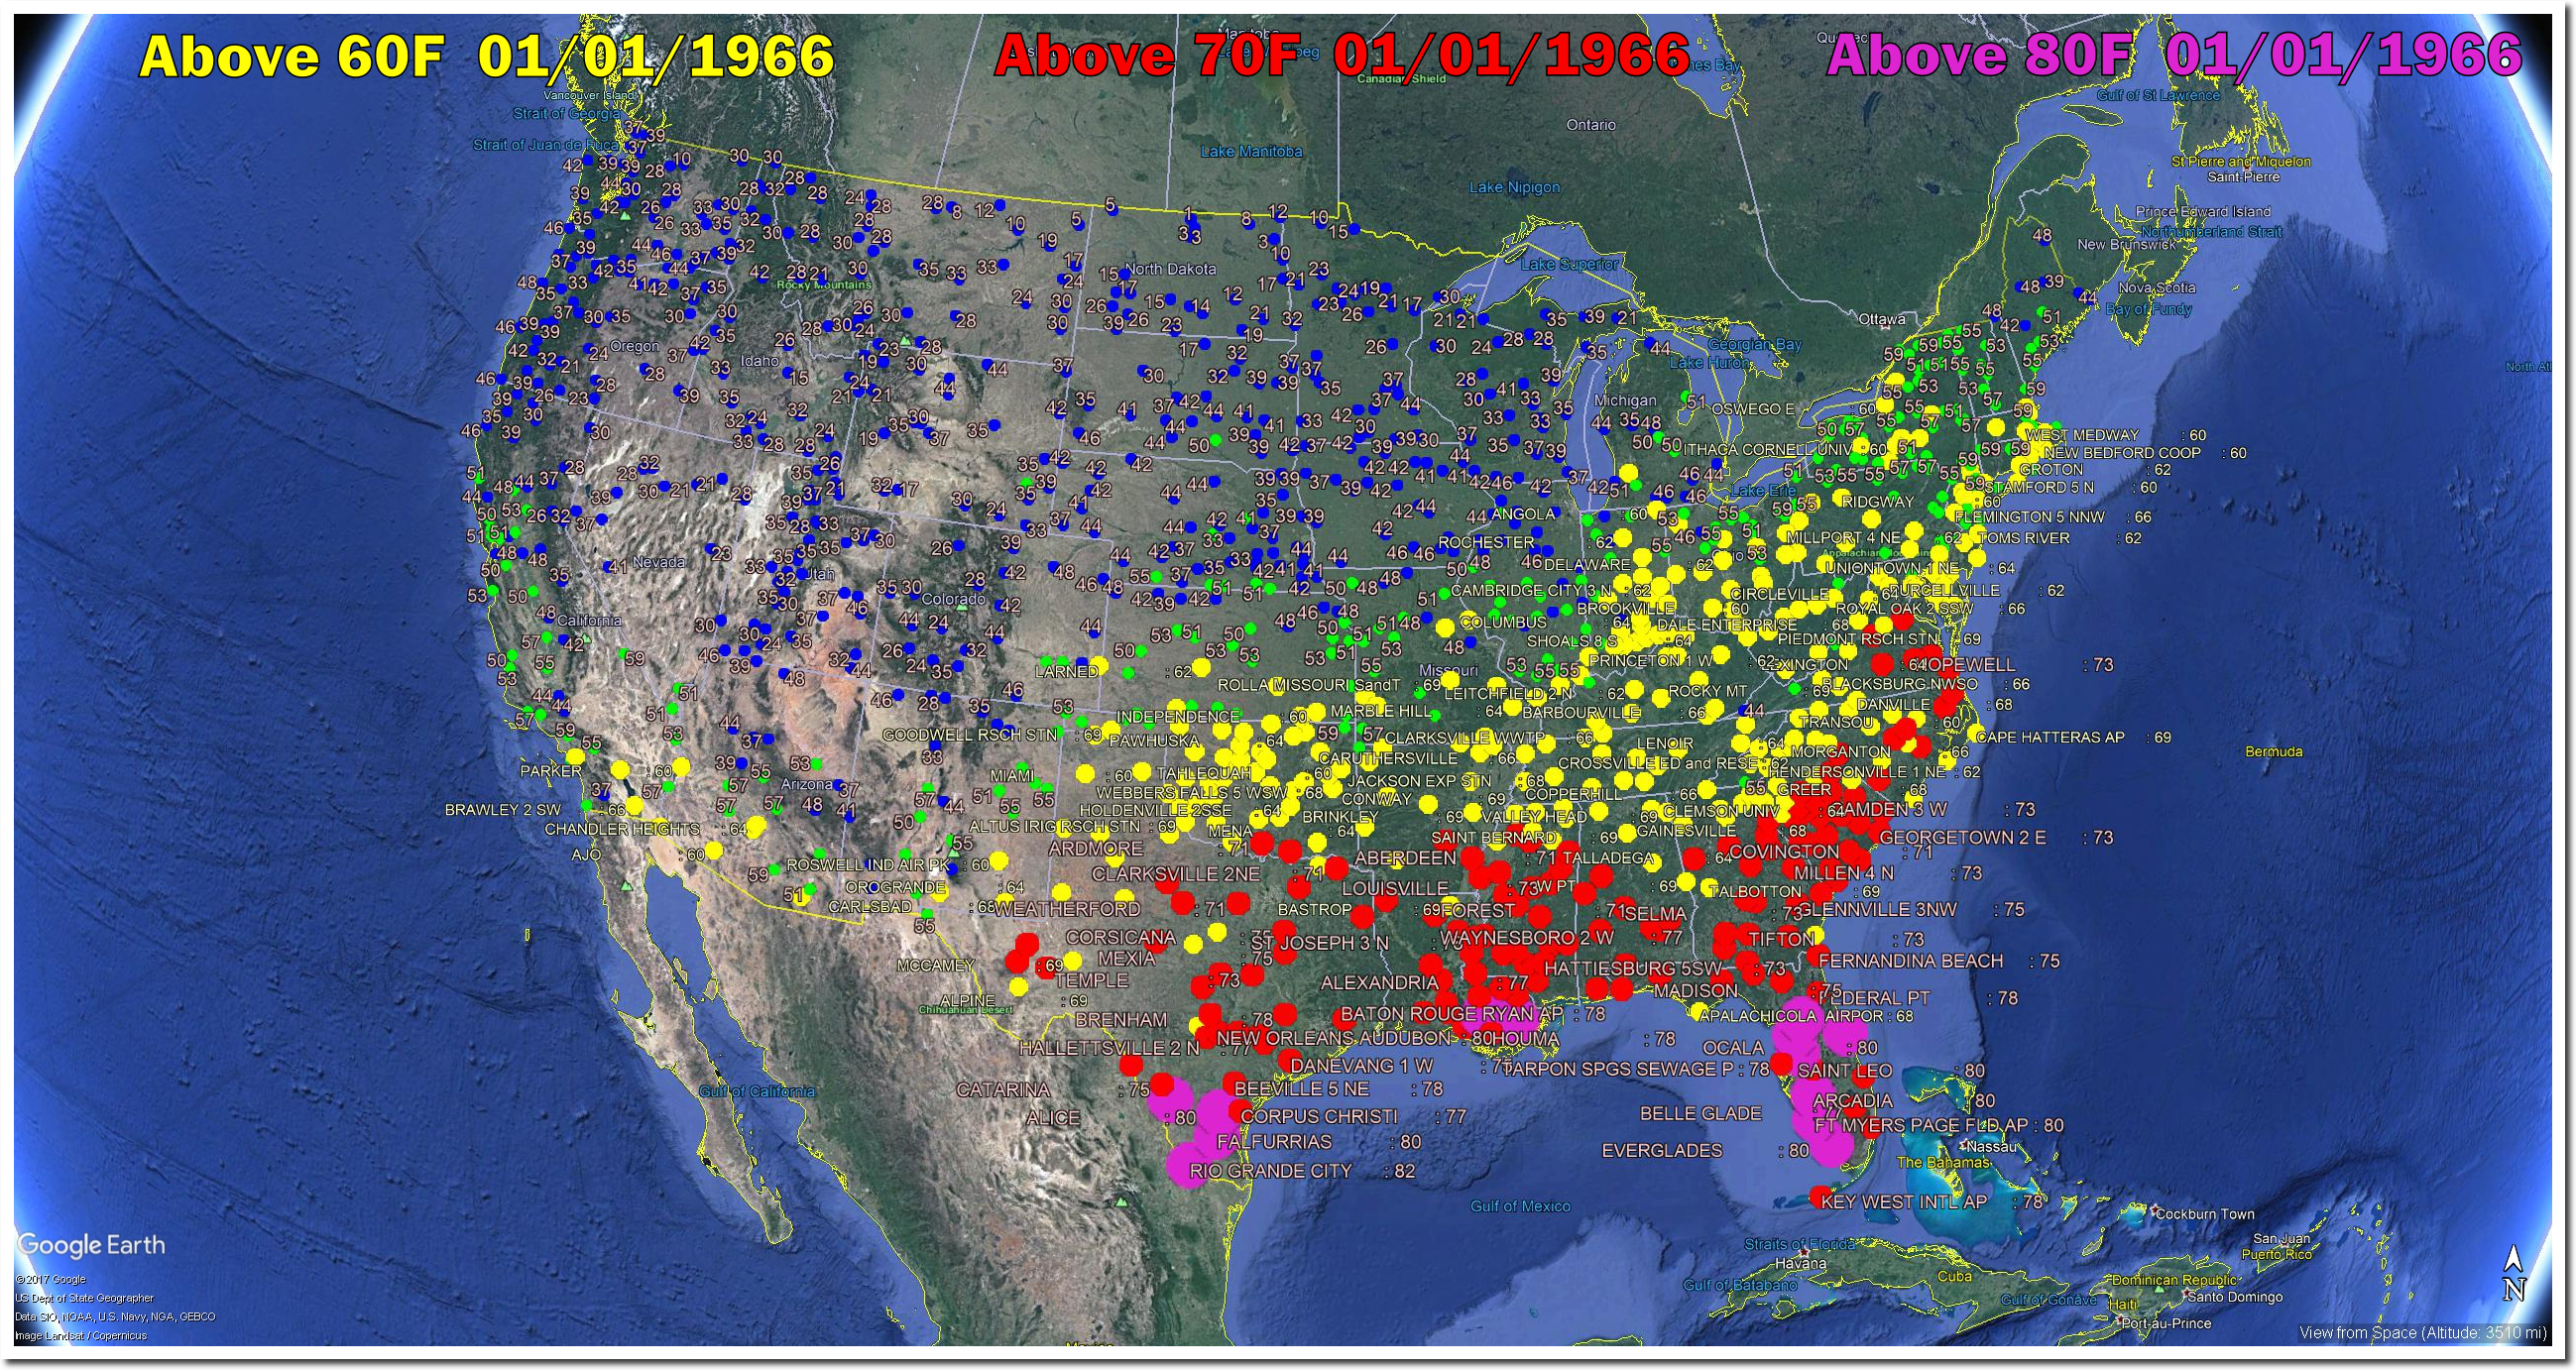
New Year’s Day 1966
The Eastern two thirds of the US is experiencing record cold today, but on this date in 1966 it was 62 degrees in Massachusetts, Rhode Island and Connecticut, 64 degrees in New York, 60 in Michigan, 69 in Ohio, 75 in Virginia, and 80 degrees in Texas and Louisiana.
Posted in Uncategorized
Leave a comment
Twenty Four Years Since Bill Clinton Ended North Korea’s Nuclear Weapons Program
Posted in Uncategorized
Leave a comment
Thirty Eight Years Since Jimmy Carter Apologized To The Islamic Dictators Of Iran
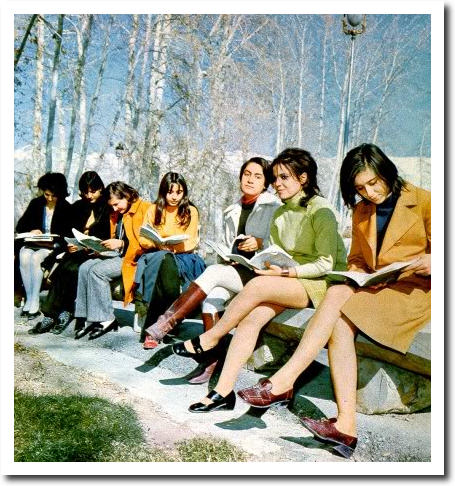
The University of Tehran before Jimmy Carter took office
Thirty five years before Barack Hussein Obama sent Iran’s Islamic dictators $billions in cash, Democrat Jimmy Carter apologized to them for US policy.
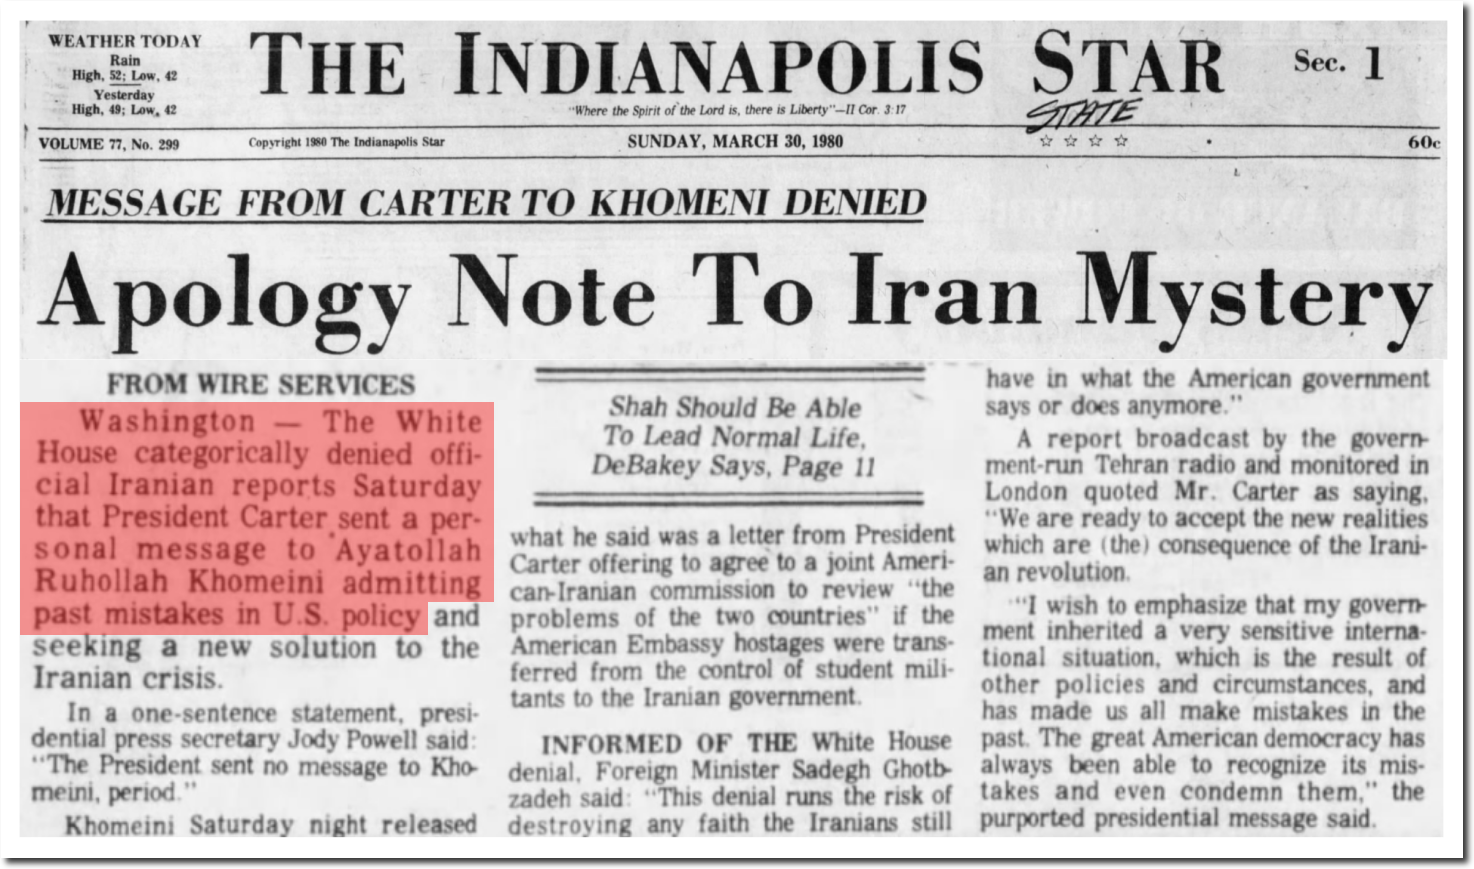
30 Mar 1980, Page 1 – The Indianapolis Star at Newspapers.com
Posted in Uncategorized
Leave a comment
Distinguishing Between Natural And Man-Made Sea Level Rise
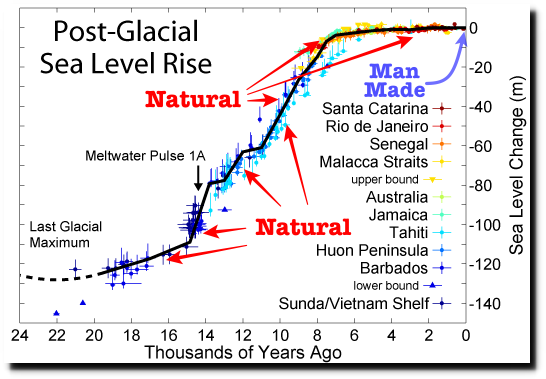
File:Post-Glacial Sea Level.png – Wikimedia Commons
But my graph isn’t quite accurate. The IPCC implied in 1990 that there was no convincing evidence man has any impact on sea level.
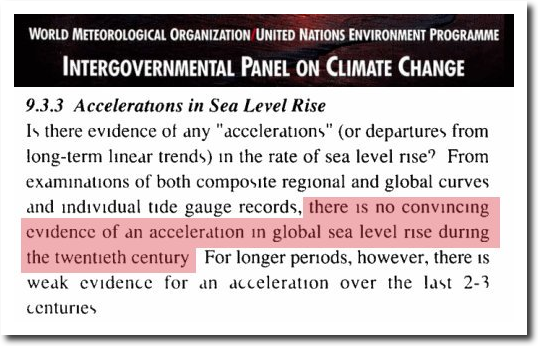
https://www.ipcc.ch/ipccreports/far/wg_I/ipcc_far_wg_I_chapter_09.pdf
Posted in Uncategorized
Leave a comment