

Disrupting the Borg is expensive and time consuming!

Google Search
-
Recent Posts
- You Can’t Fool Mother Nature
- Cattle And The Climate
- One Atomic Bomb Per Hour
- New Video : Analyzing Oil And Gas
- Is Antarctica Melting?
- High Speed Analysis And Visualization
- El Nino To The Rescue?
- Fake News Update
- Growth Of Antarctic Sea Ice
- 65 Years Of Progress!
- El Nino To The Rescue?
- Worst March Drought On Record
- ChartGL Process Control Demo
- The Biggest Money Laundering Scam
- Drought In The Headwaters Of Lake Powell
- Unrealistic Expectations Of Water Availability
- Did Bill Gates Do This?
- Worst March Drought On Record In The US
- The Real Hockey Stick Graph
- Analyzing The Western Water Crisis
- Gaslighting 1924
- “Why Do You Resist?”
- Climate Attribution Model
- Fact Checking NASA
- Fact Checking Grok
Recent Comments
- Bob G on You Can’t Fool Mother Nature
- Ivan G Wainwright on You Can’t Fool Mother Nature
- conrad ziefle on You Can’t Fool Mother Nature
- Bob G on You Can’t Fool Mother Nature
- Gordon Vigurs on You Can’t Fool Mother Nature
- arn on Cattle And The Climate
- Bob G on Cattle And The Climate
- Robertvd on Cattle And The Climate
- Bob G on Cattle And The Climate
- Robertvd on Cattle And The Climate
New Video : Summer Temperatures Plummet – As Climate Scientists Ramp Up Their Lies
Posted in Uncategorized
Leave a comment
Current Ice-Free Arctic Forecast
If current trends continue, the Arctic will be ice-free at 12;39 PM on December 14 – with temperatures of -30C.
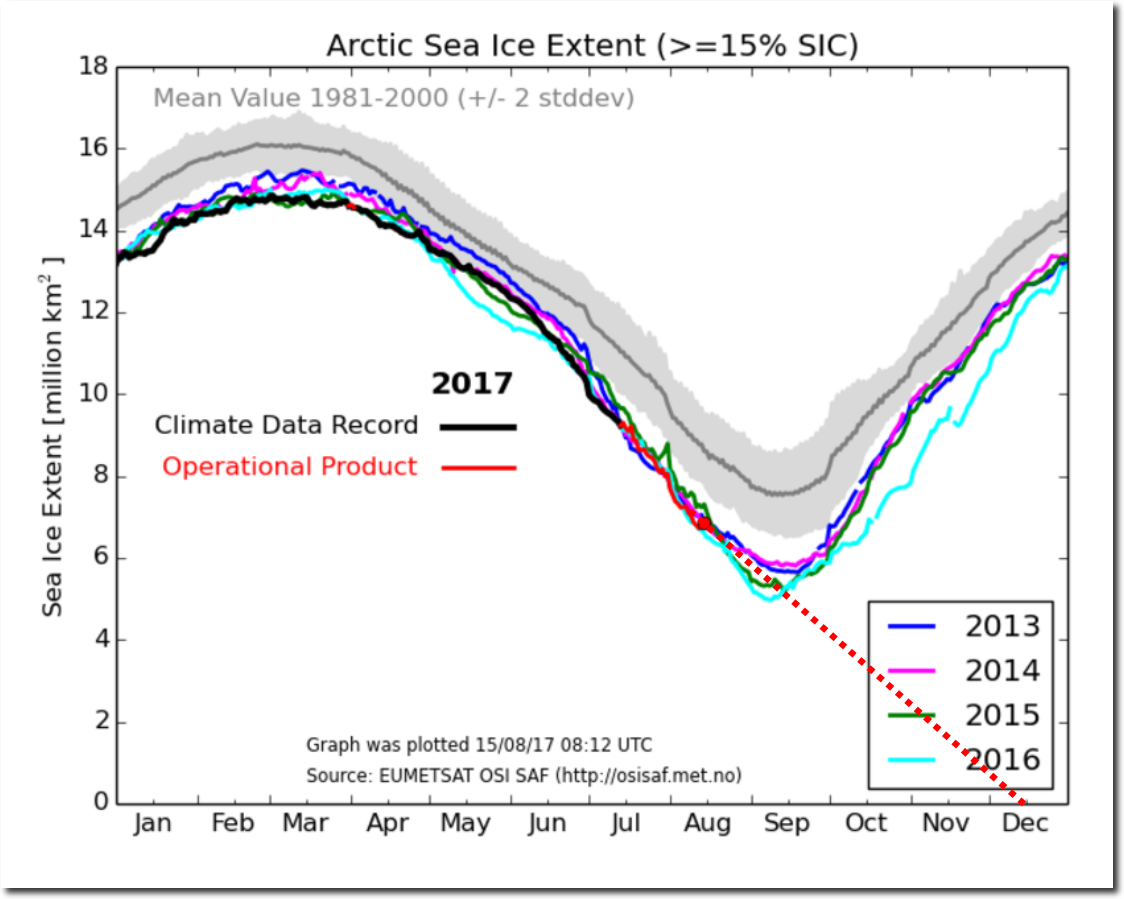
Ocean and Ice Services | Danmarks Meteorologiske Institut
Remember last week, when Arctic experts were certain that winter-like storms would break up the ice, and that they would be able to blame it on global warming?
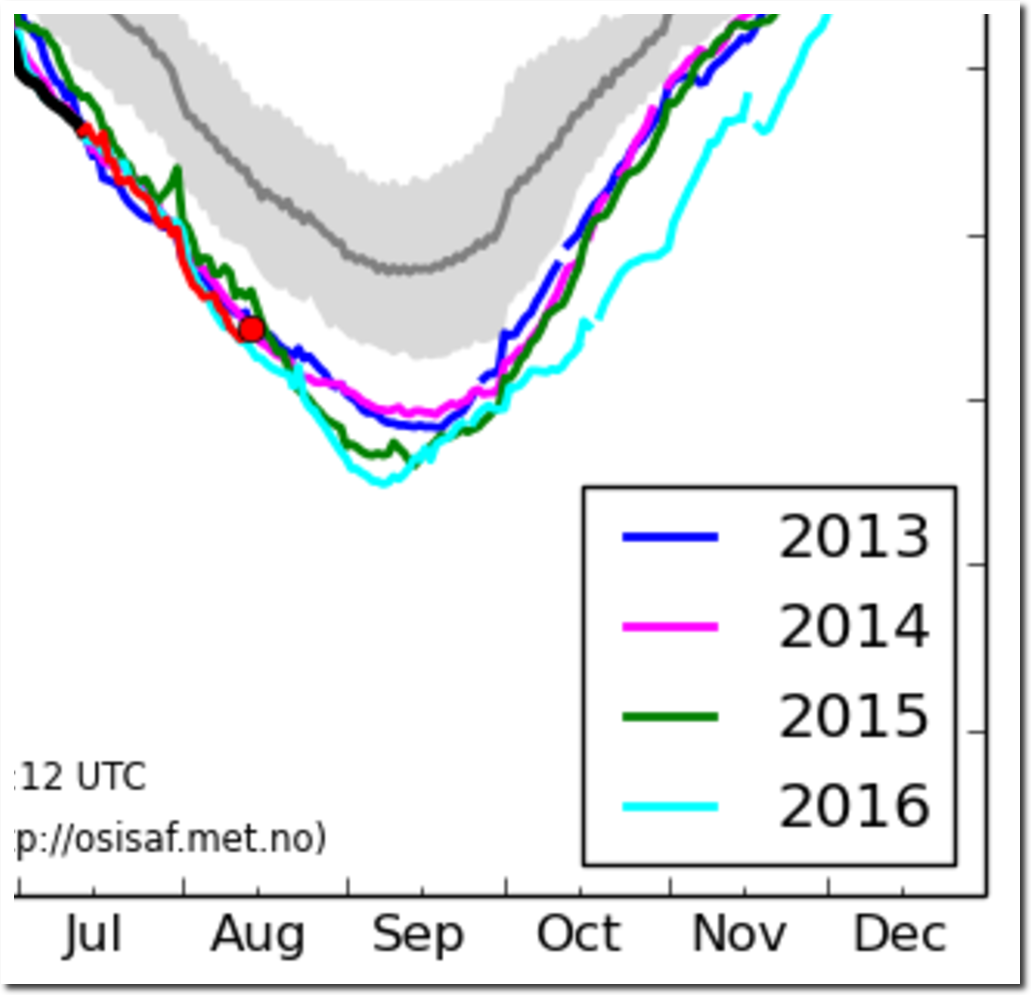
They can’t predict next week, but their 30 year forecasts are rock solid. 97% of scientists agree.
Posted in Uncategorized
Leave a comment
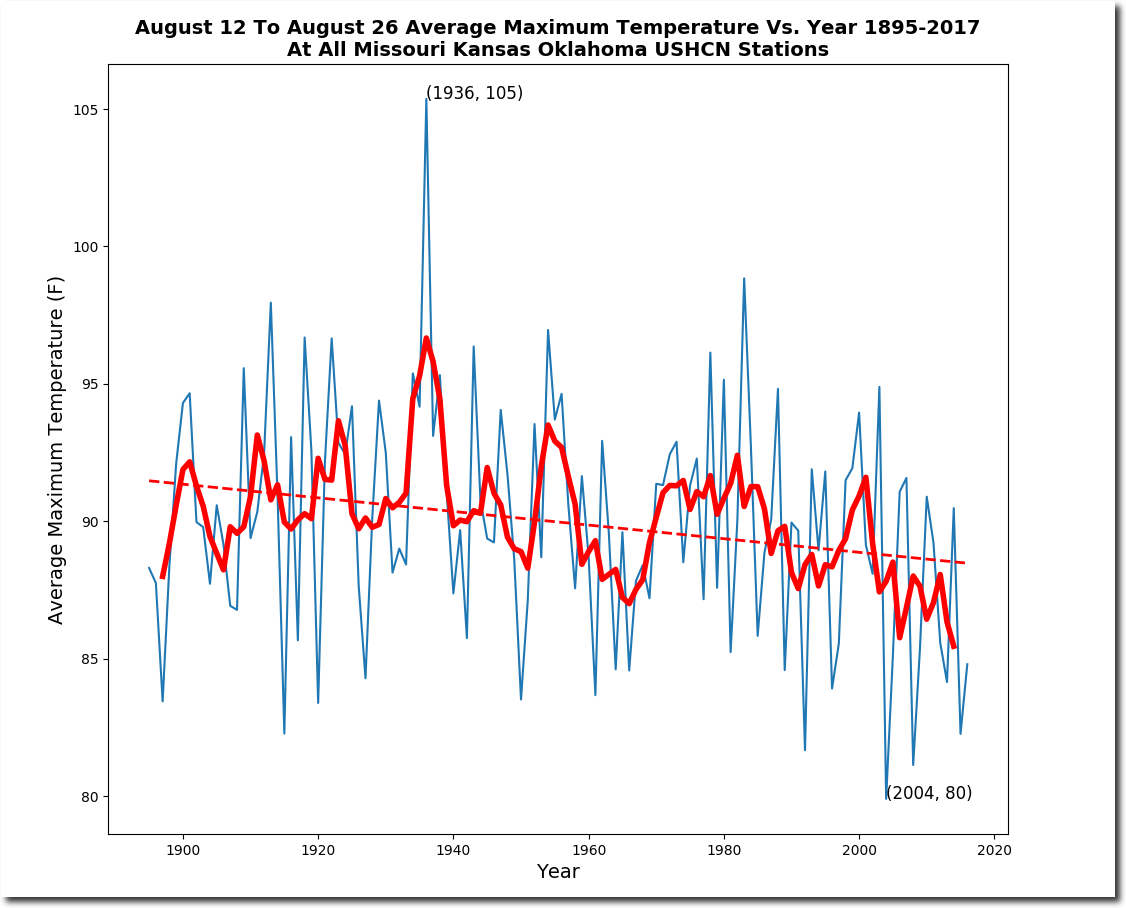
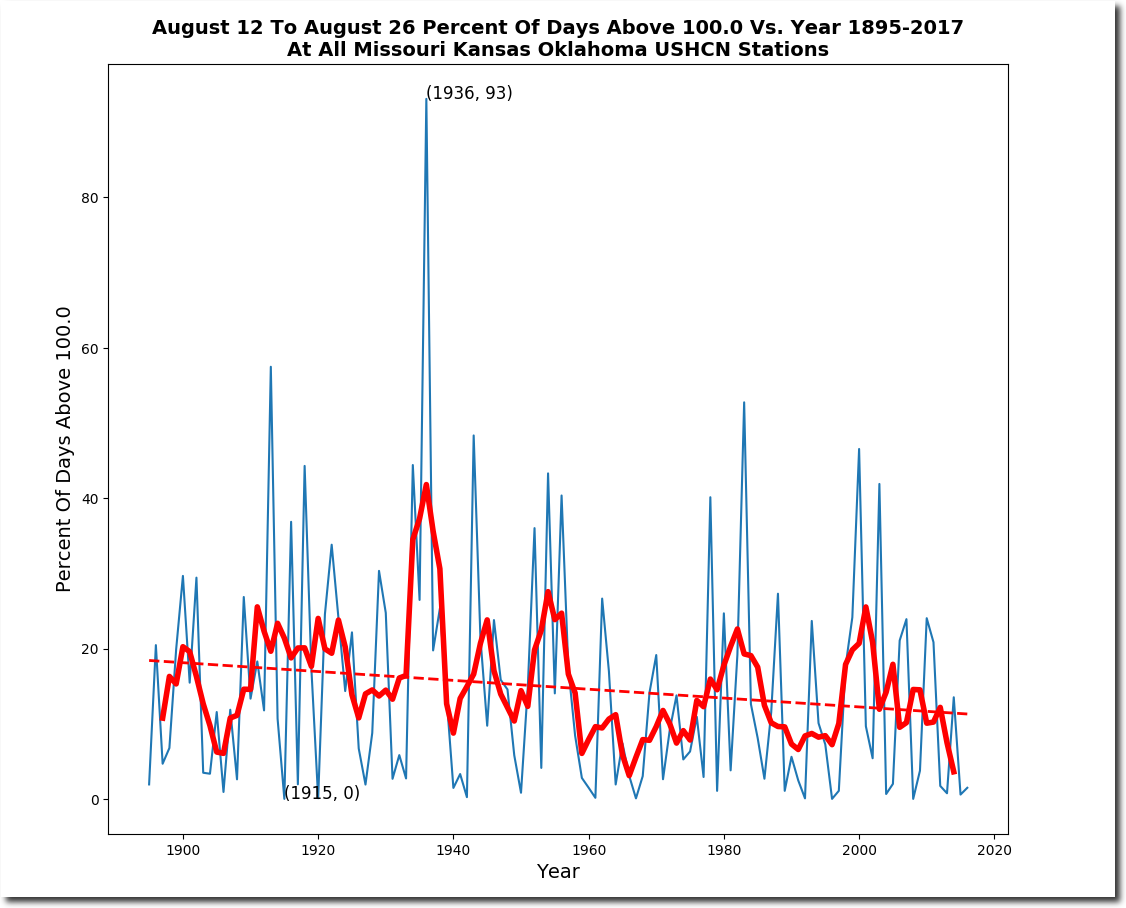
Just How Hot Was It?
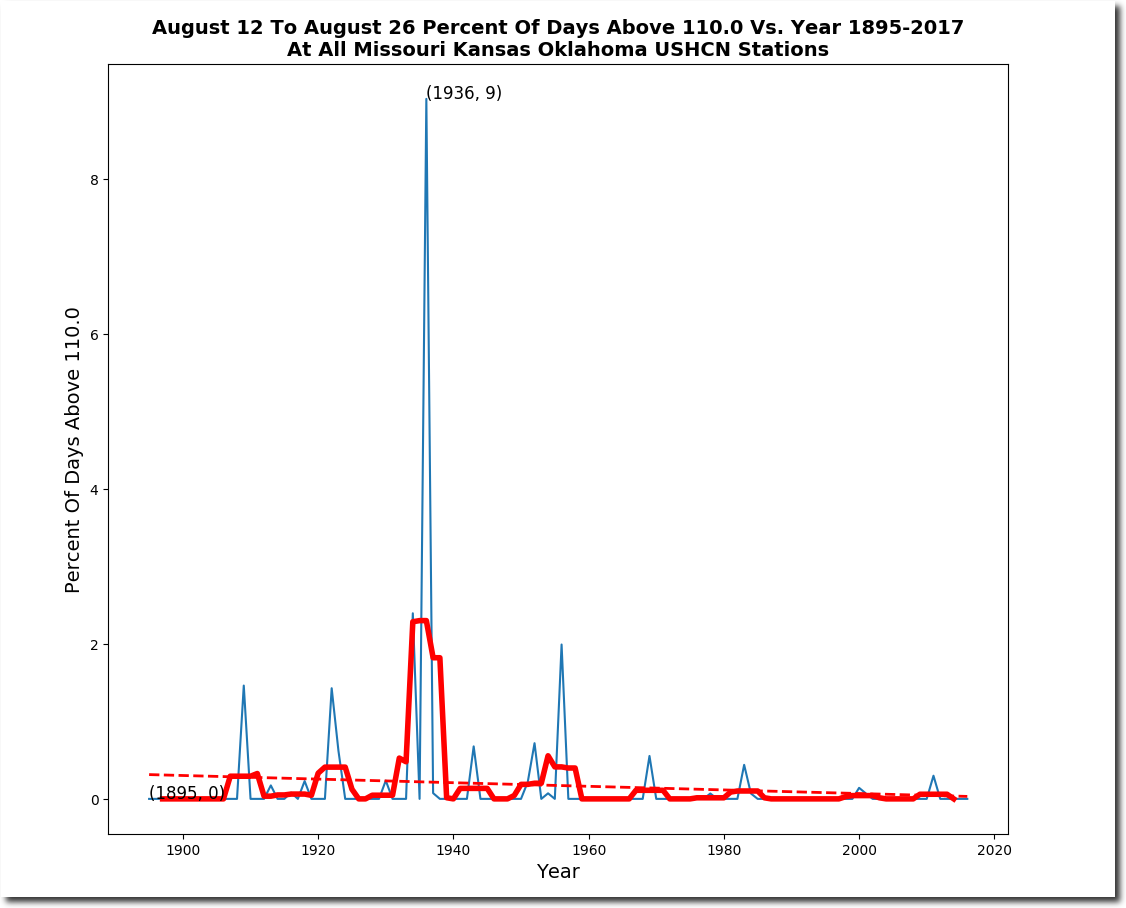
During the two weeks from August 12-August 26, 1936 Missouri, Kansas and Oklahoma afternoon temperatures averaged 105F, and 93 percent of days were over 100F. Nine percent of days were over 110F.
Posted in Uncategorized
Leave a comment
Found A Bug
Get your new ghcn.py here (Mac/Linux users) and ghcn.exe here (Windows users)
The bug was causing successive plots to degrade. Please update to the new version and overwrite the old files.
Posted in Uncategorized
Leave a comment
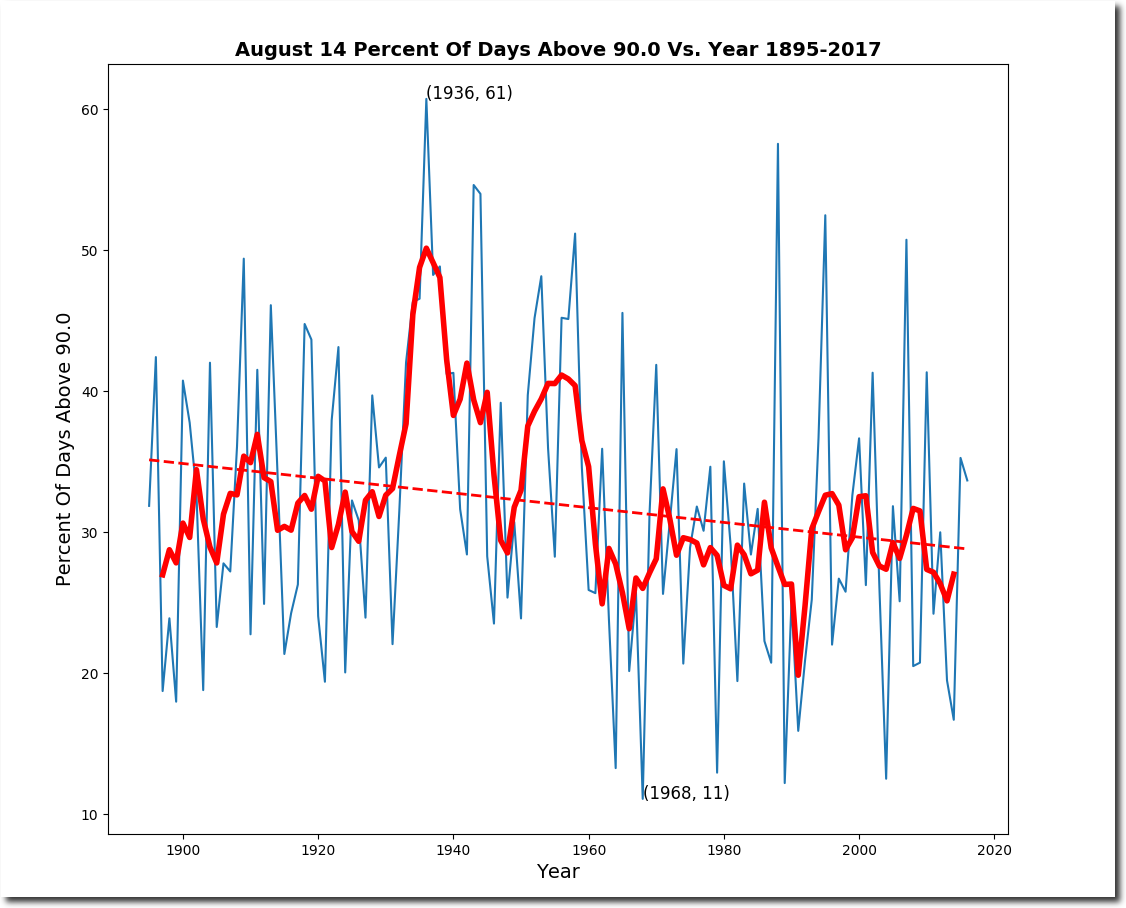
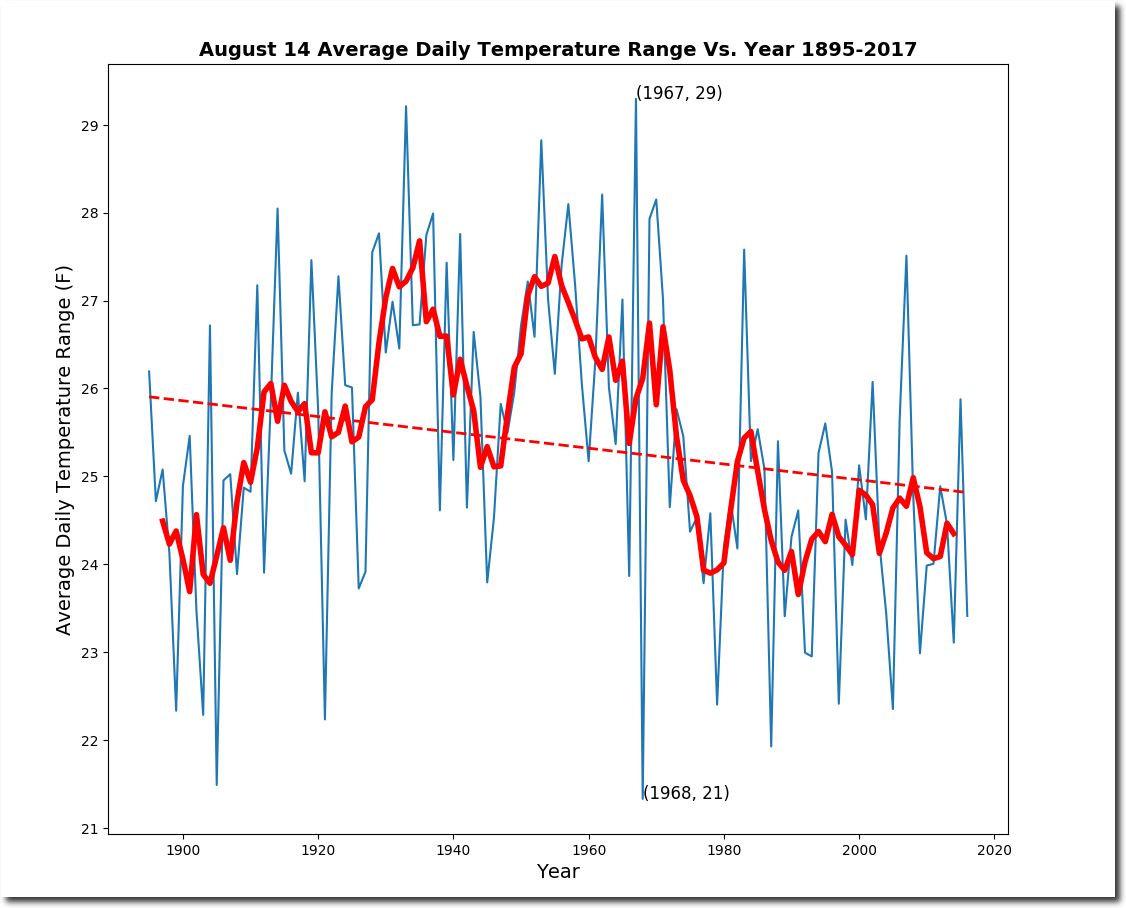
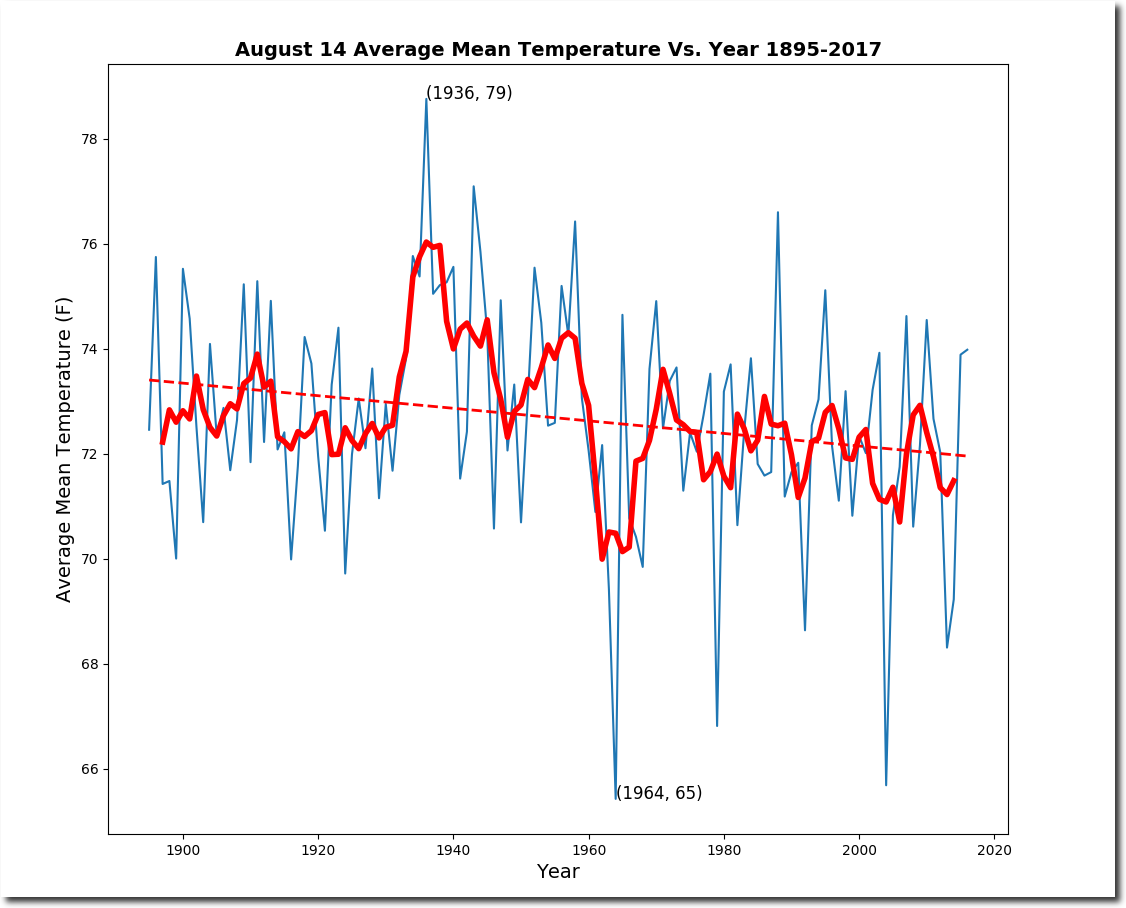
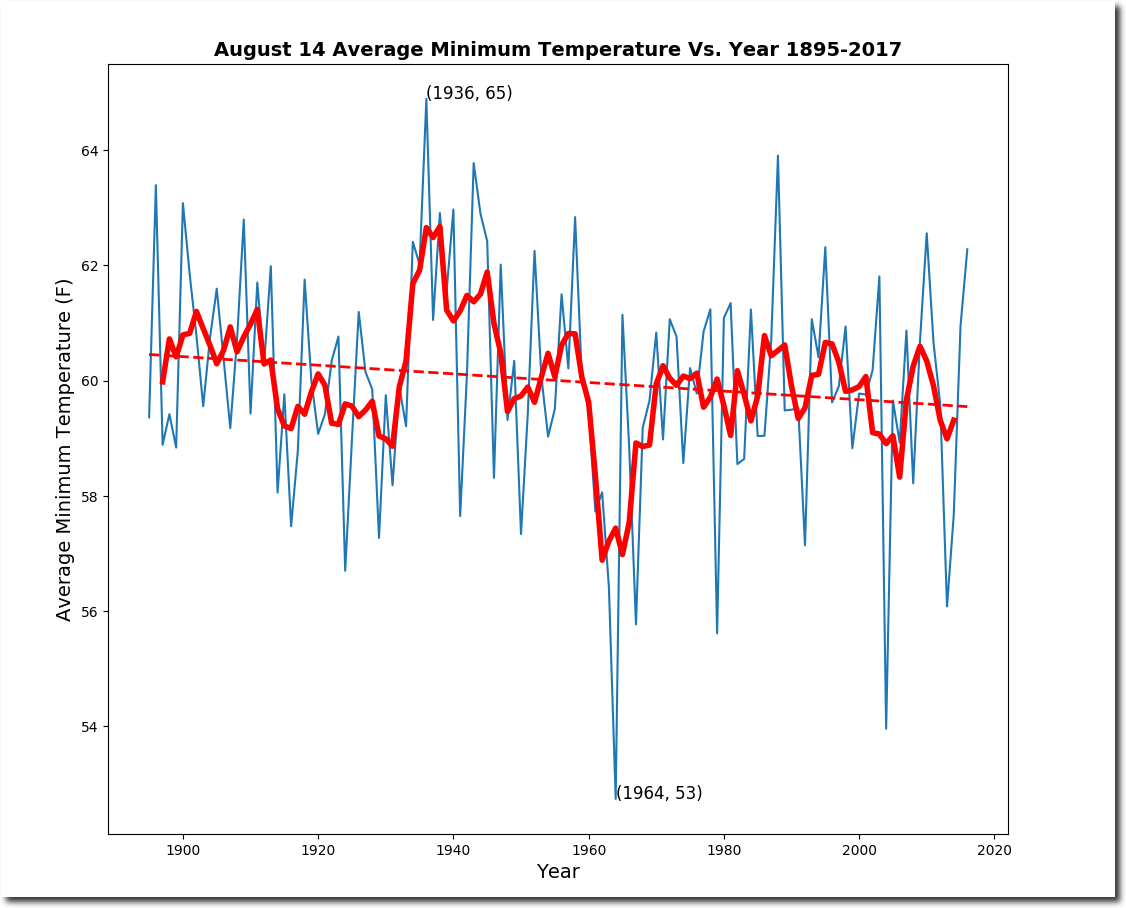
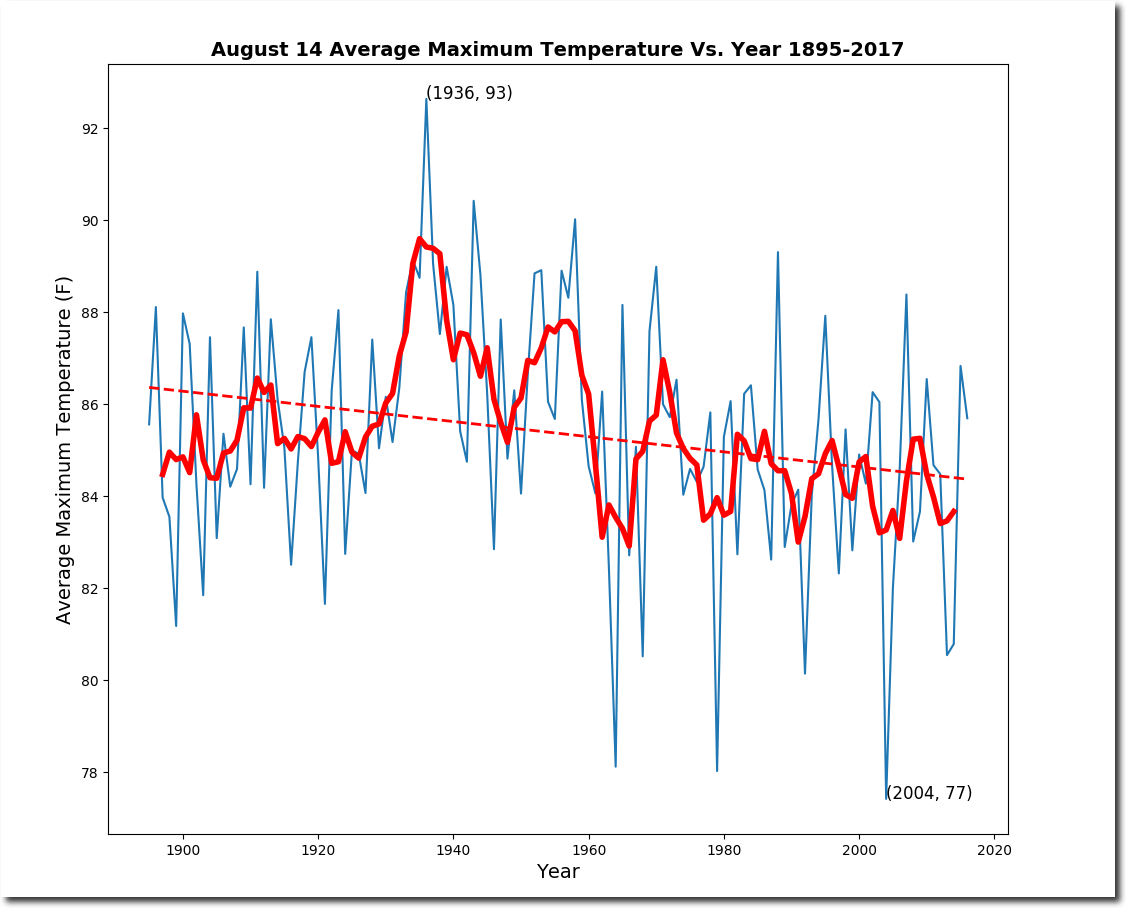
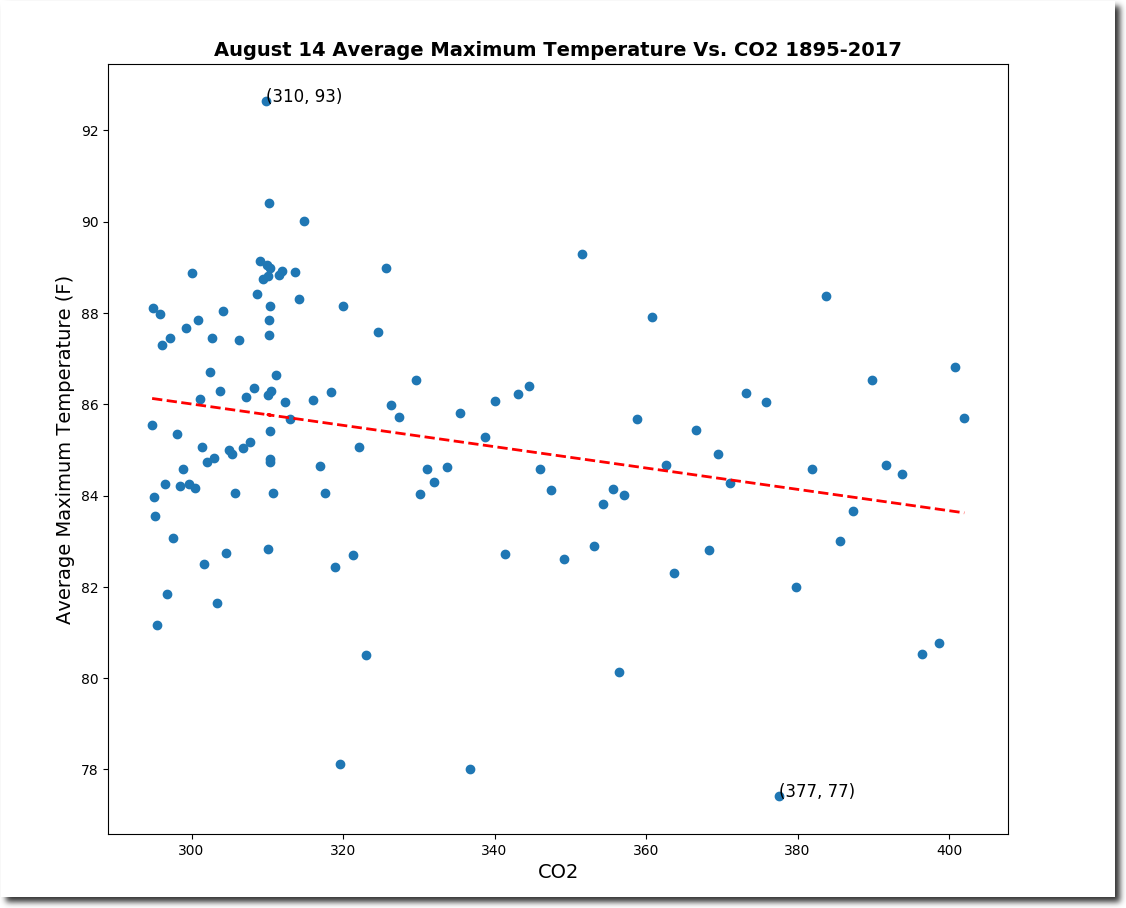
Plummeting August 14 Temperatures In The US
Peak, minimum, and maximum temperatures are declining.
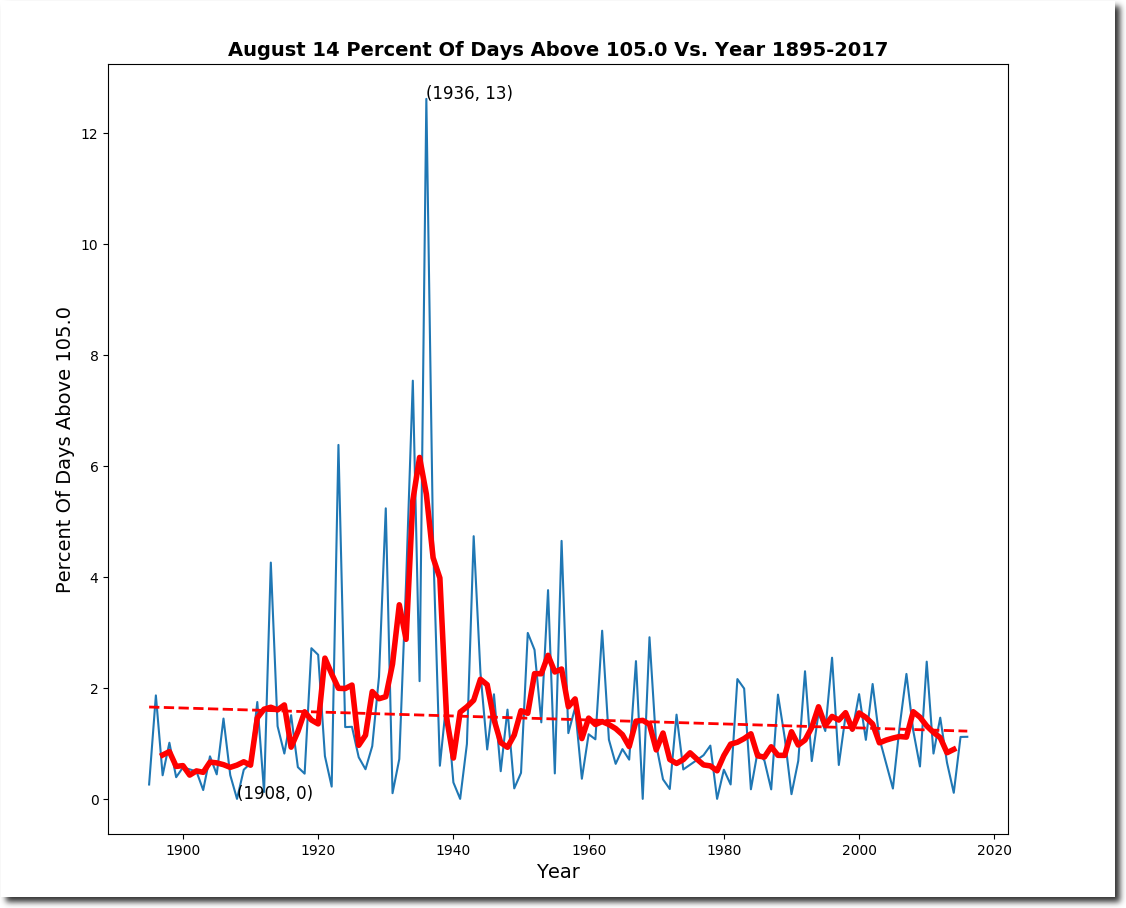
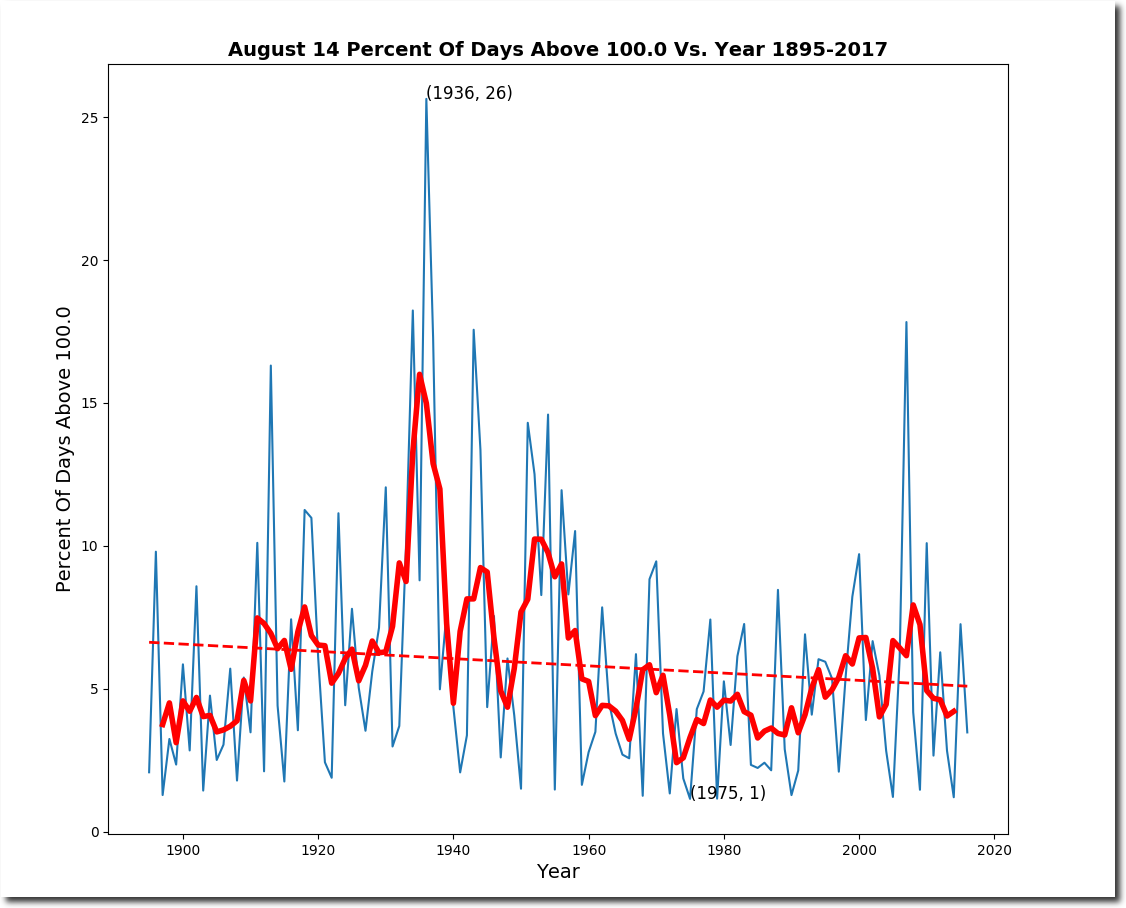
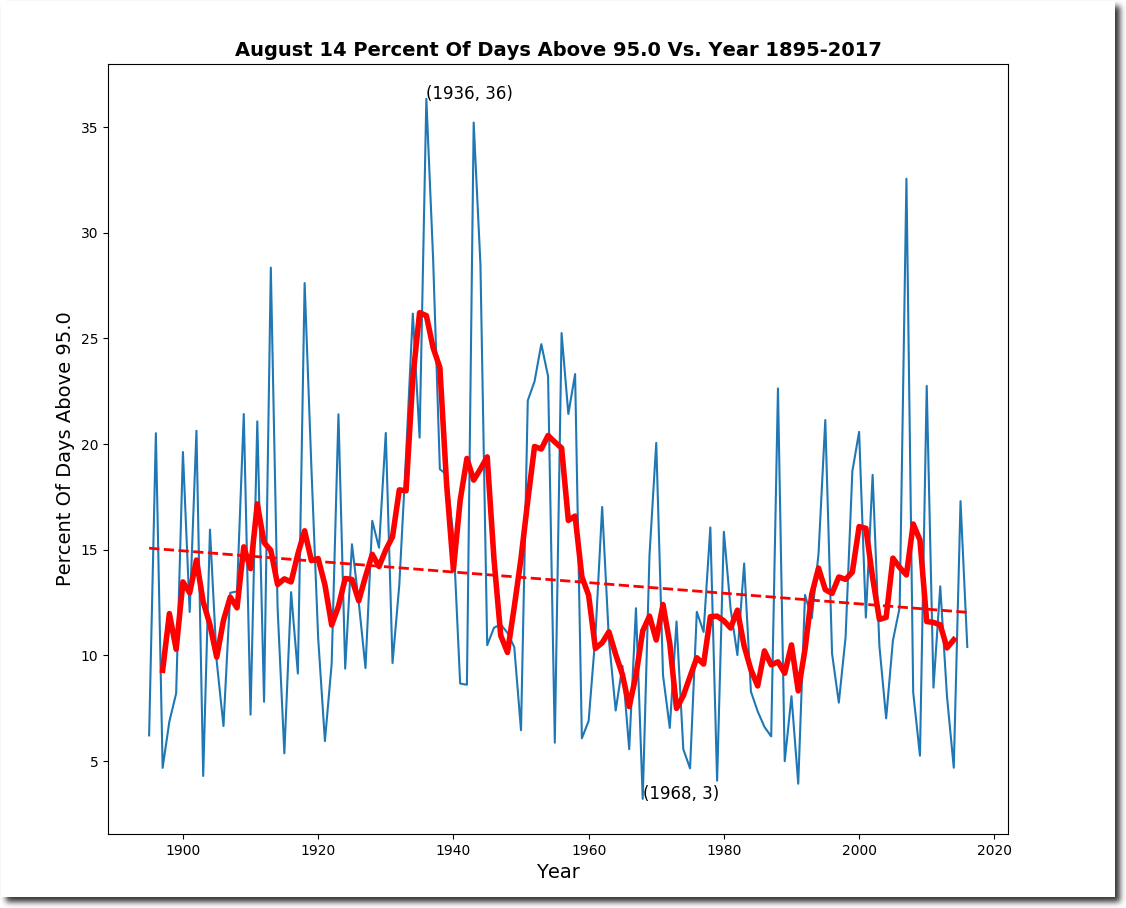
1967 had the largest temperature range, and 1968 had the smallest.
Posted in Uncategorized
Leave a comment
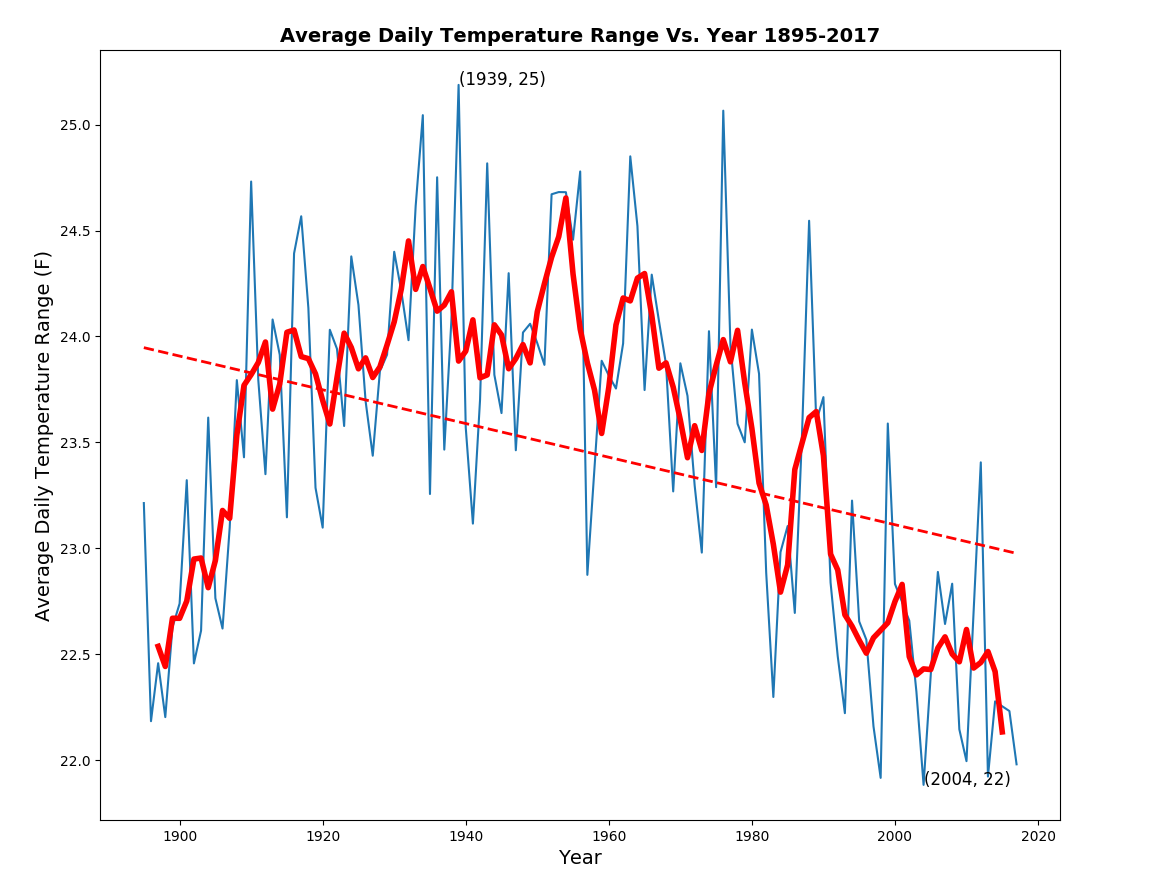
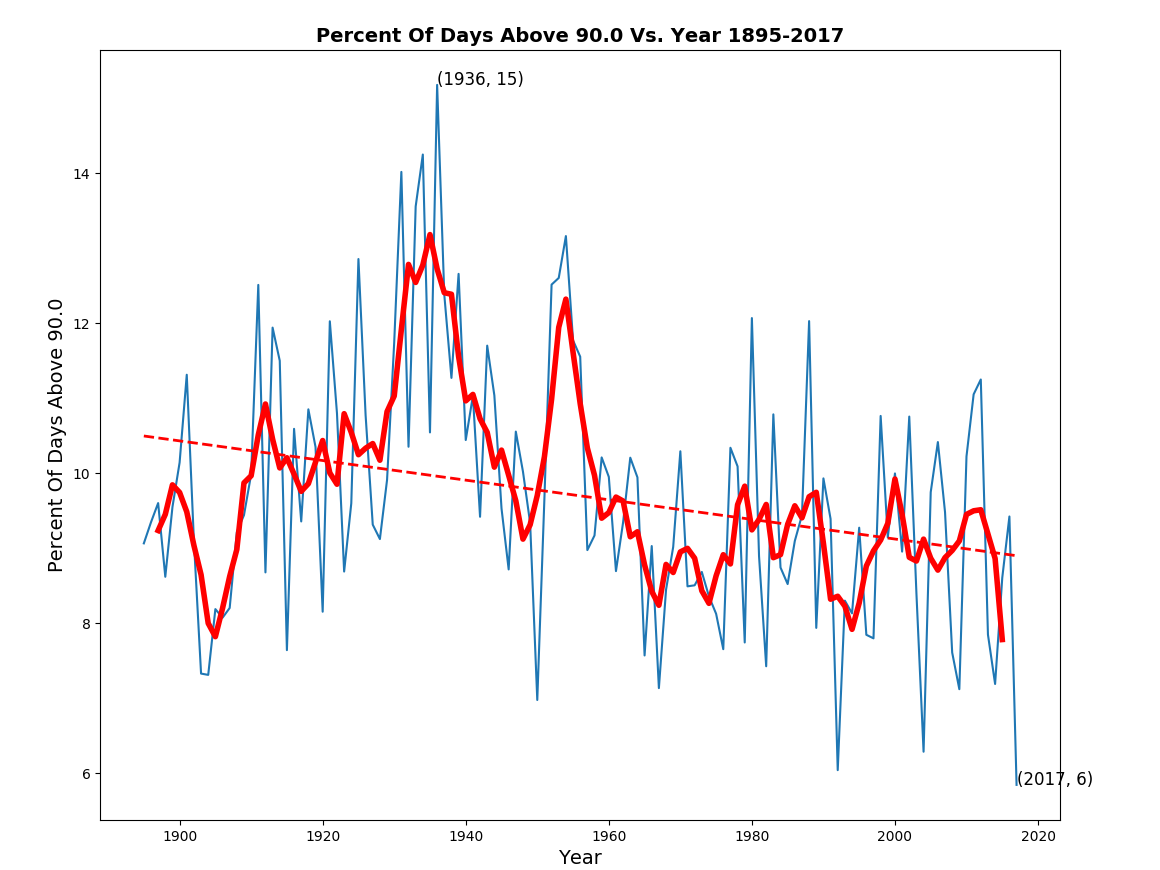
US Climate Getting Less Extreme
The frequency of hot days and cold nights is decreasing, as is the average daily temperature range. In other words, the climate is getting less extreme.

Posted in Uncategorized
Leave a comment
The Incredible Heat Of August 14, 1936
August 14 temperatures peaked in the US in 1936, then plummeted to a record low in 2004.
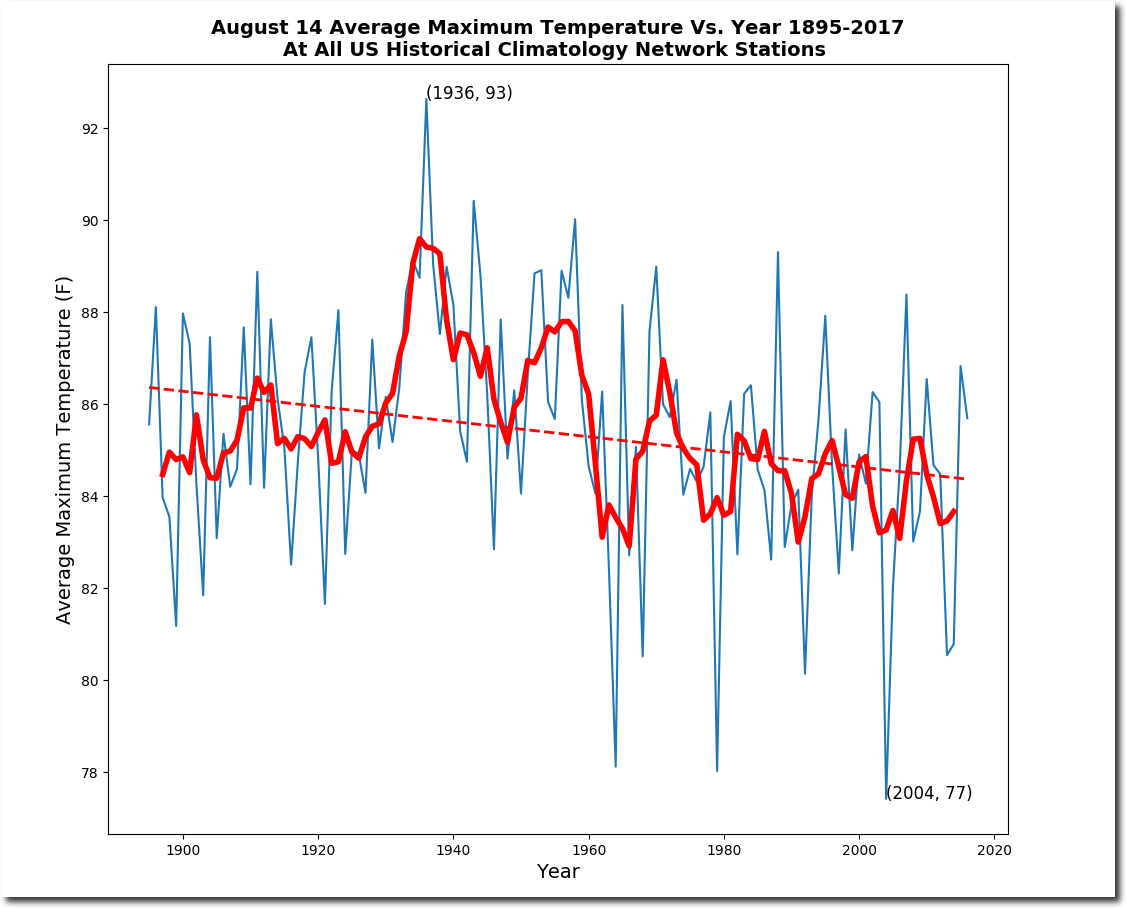
The heatwave of August 14, 1936 killed many people and brought temperatures up to 120 degrees.
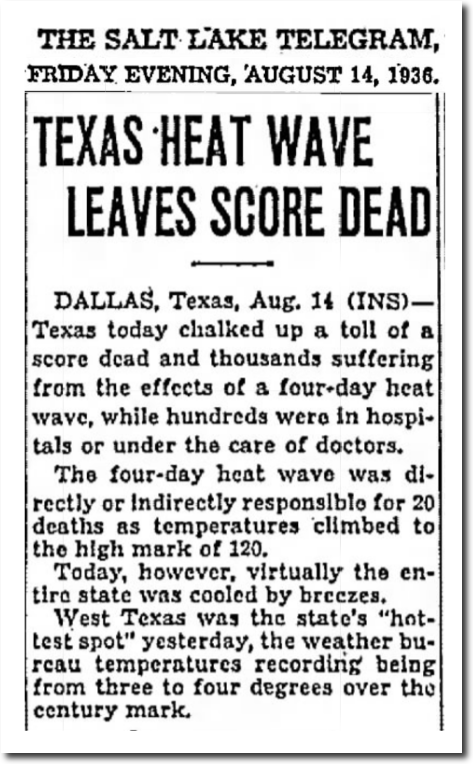
14 Aug 1936, 3 – Salt Lake Telegram
The entire central portion of the US was over 100 degrees, with Kansas at 115 degrees..
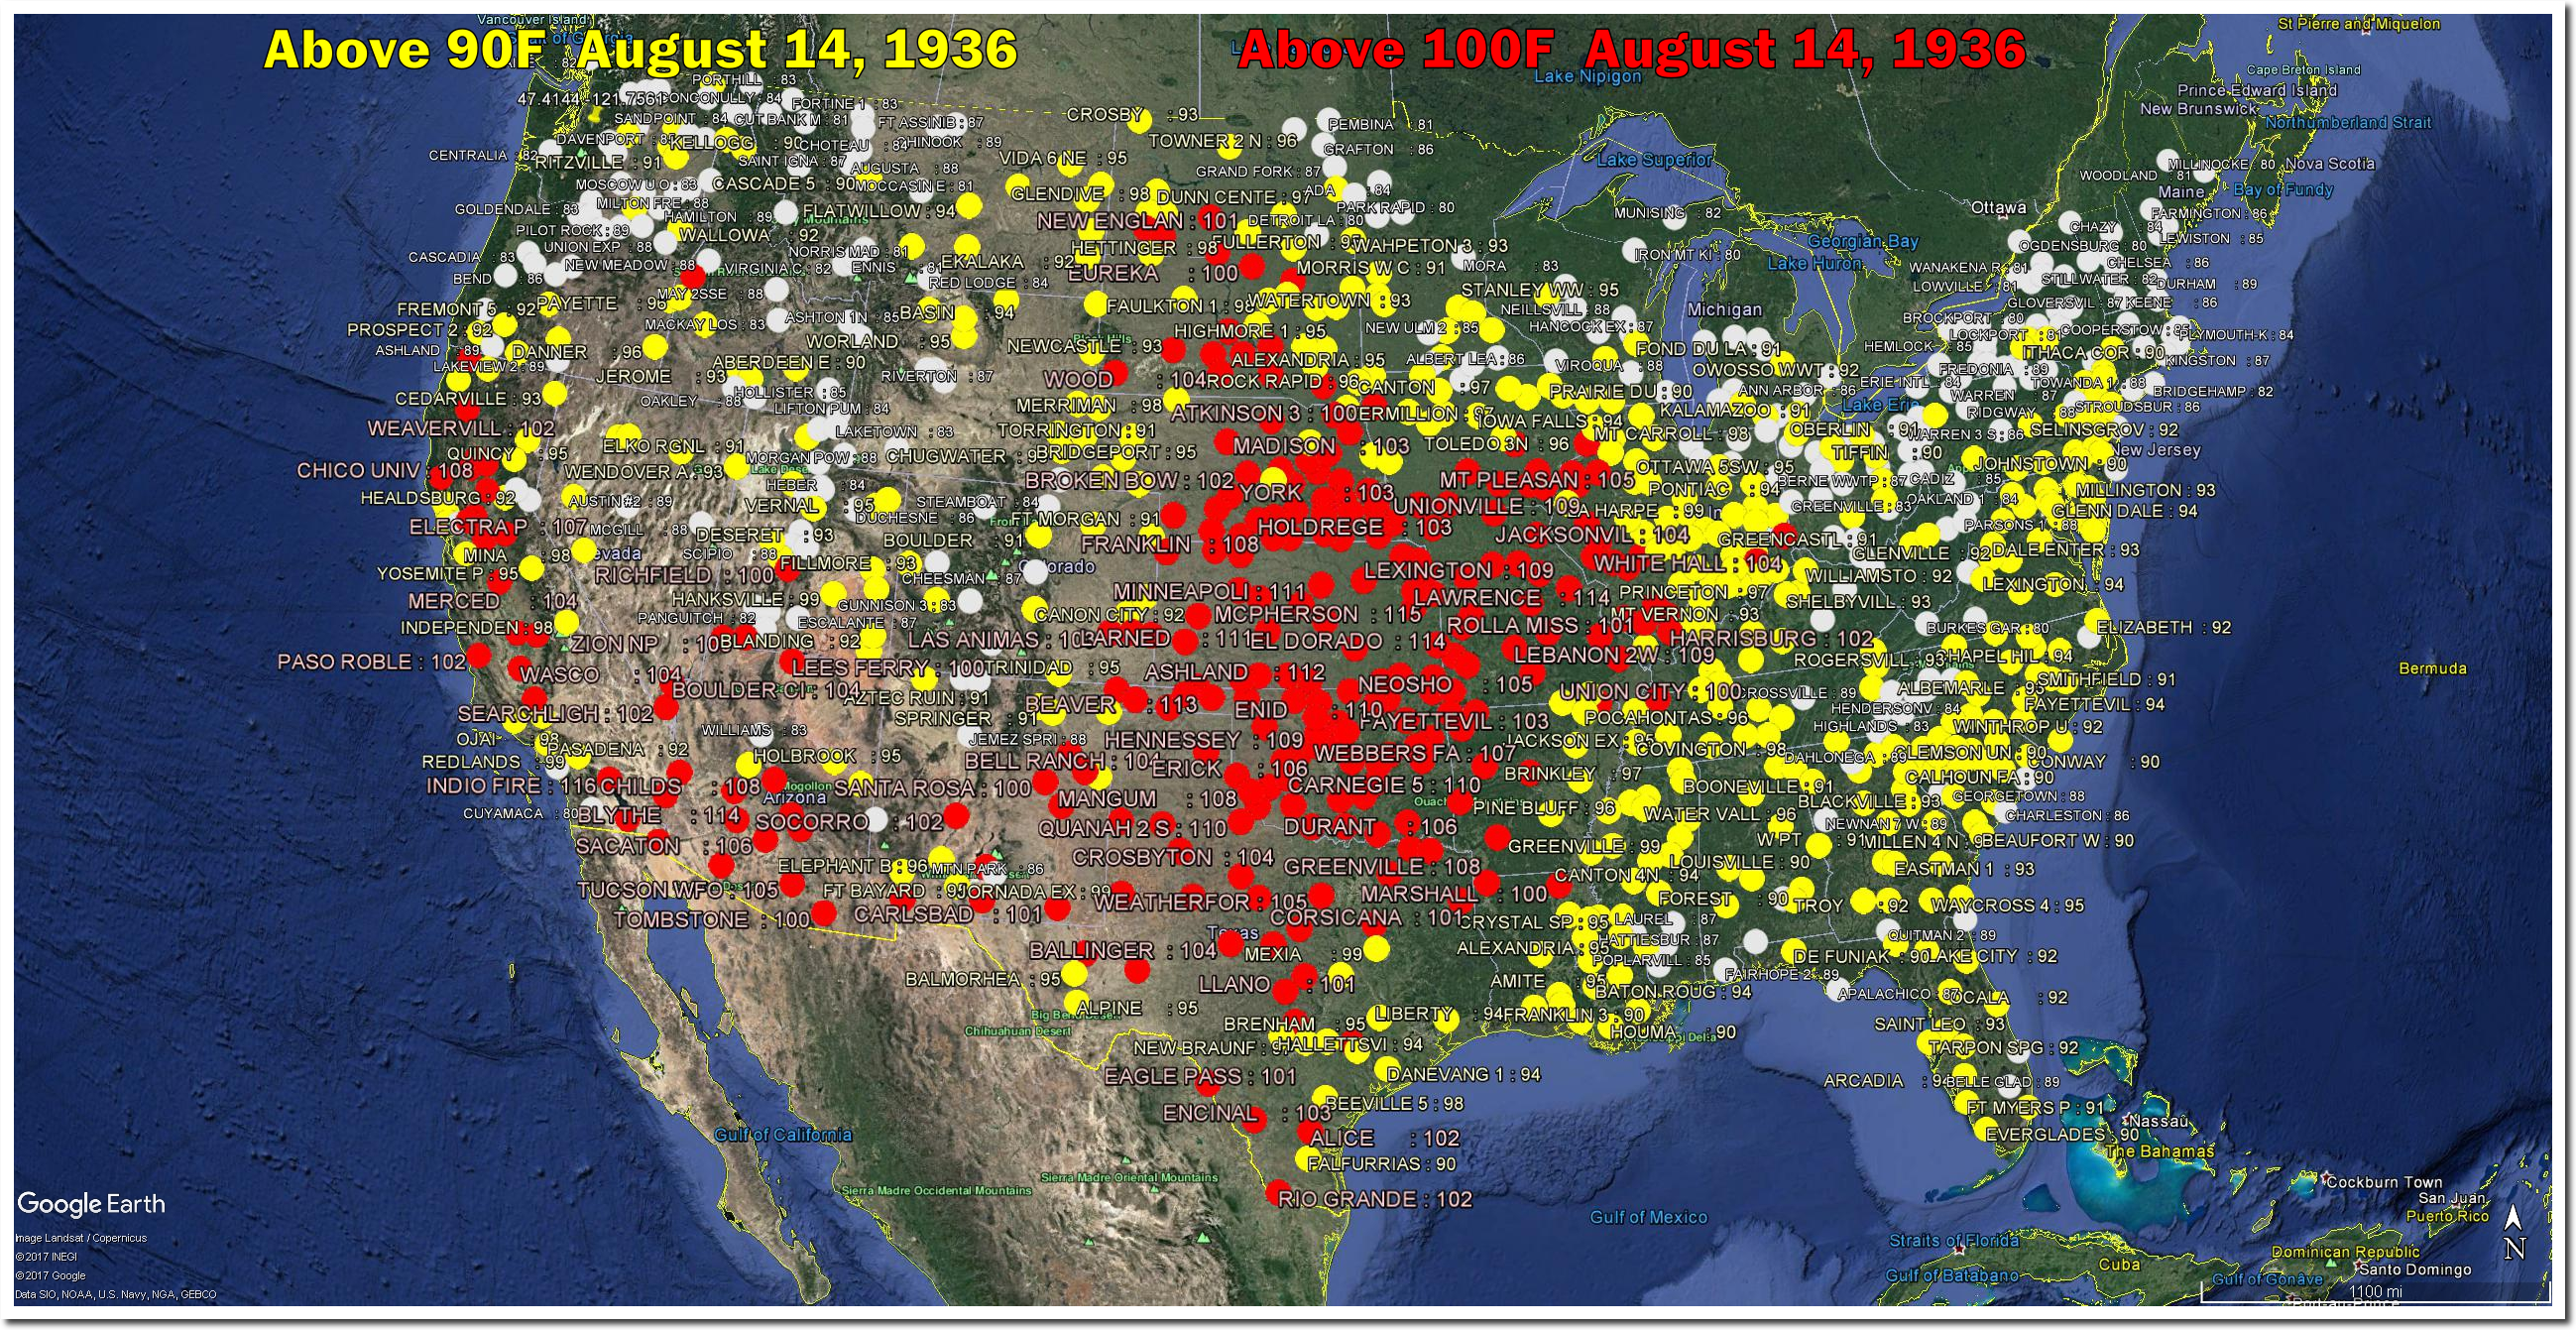
If this happened now climate scientists would say they were 100% certain it was your fault, and demand immediate world communism to solve the problem.
Posted in Uncategorized
Leave a comment
Understanding Climate Math
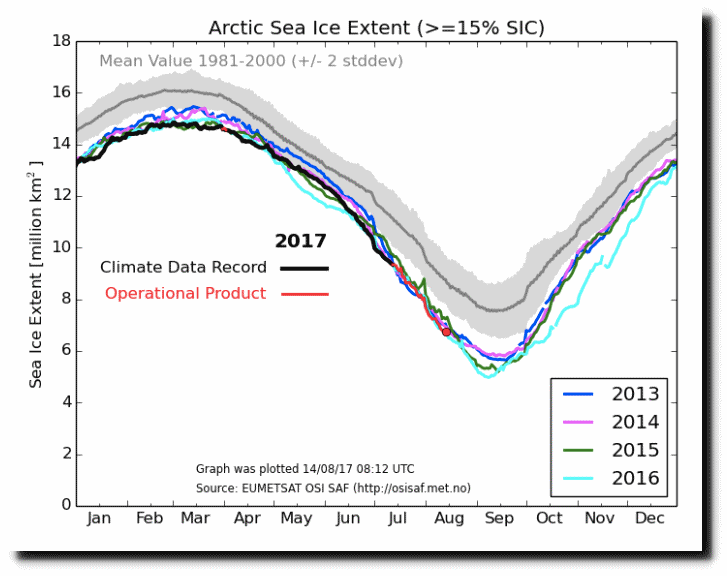
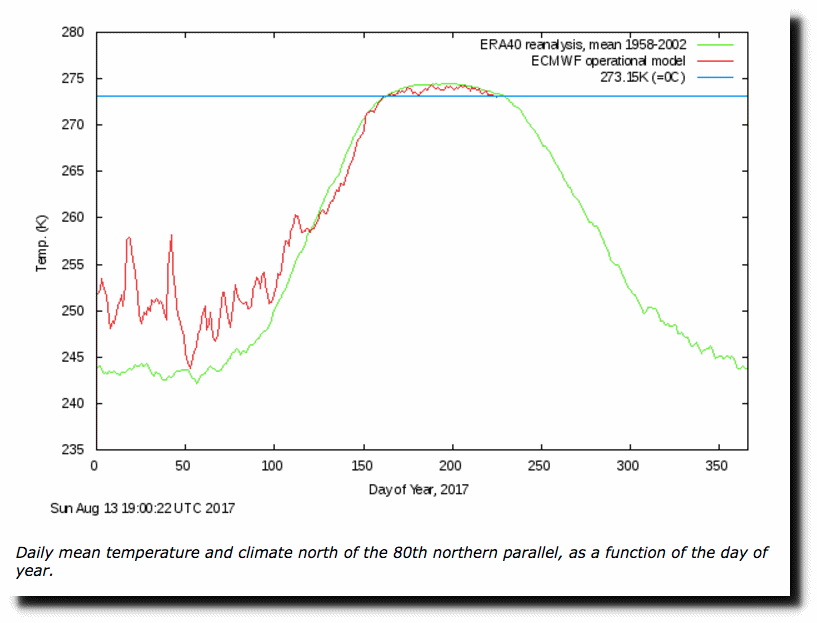
There is more ice than the area of Texas and temperatures are below freezing, but it is all going to melt in the next two weeks. And if you don’t believe it, you are an evil fossil fuel funded denier seeking to destroy the planet.
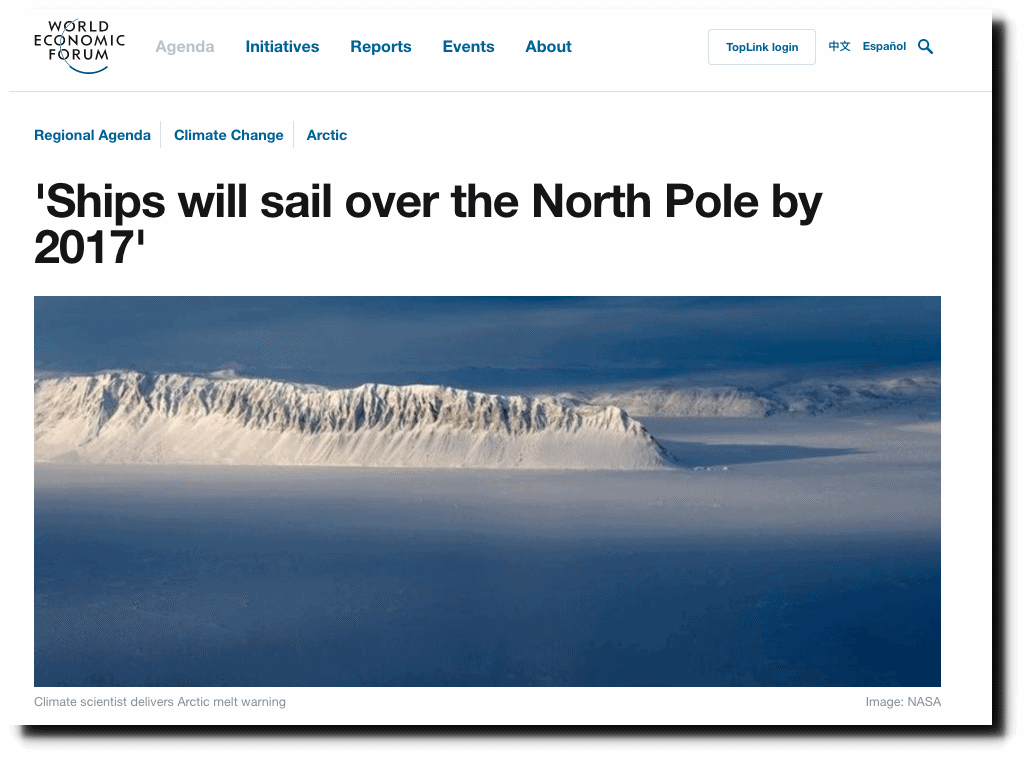
‘The North Pole could ice-free by next summer’ | World Economic Forum
Ocean and Ice Services | Danmarks Meteorologiske Institut
Posted in Uncategorized
Leave a comment