Collusion Between Mann, Hansen And Schmidt To Create The Hockey Stick

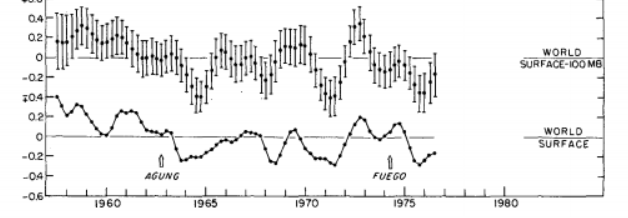
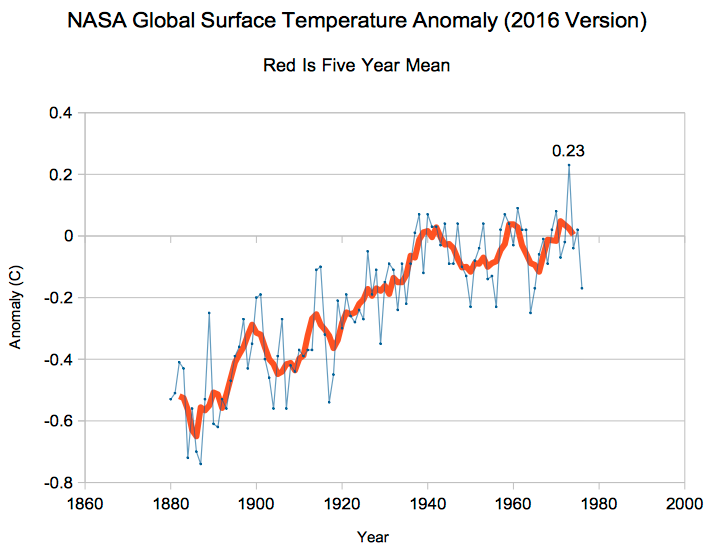
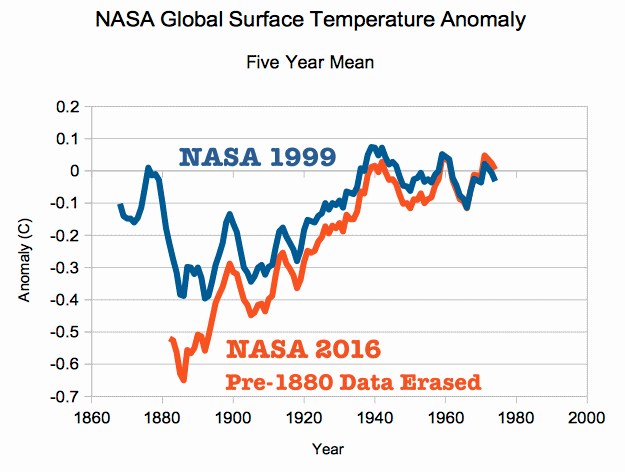
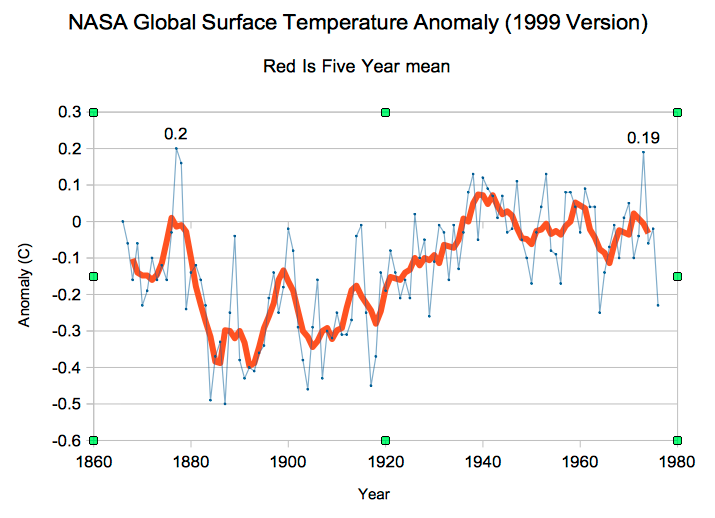
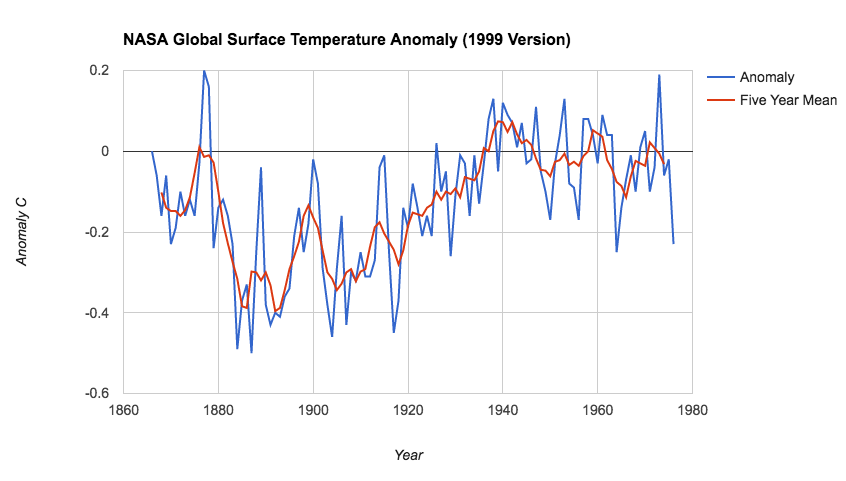
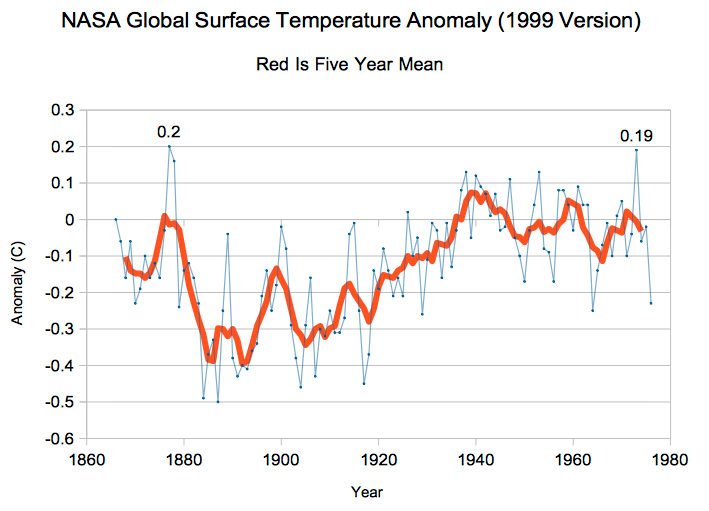
As of 1999, NASA showed no net warming from the 1870’s to the 1970’s, and showed 1877 as the warmest year from 1866 to 1976.

Screen Shot 2016-08-28 at 8.51.57 AM

Archived from: http://www.giss.nasa.gov/data/gistemp/GLB.Ts.txt

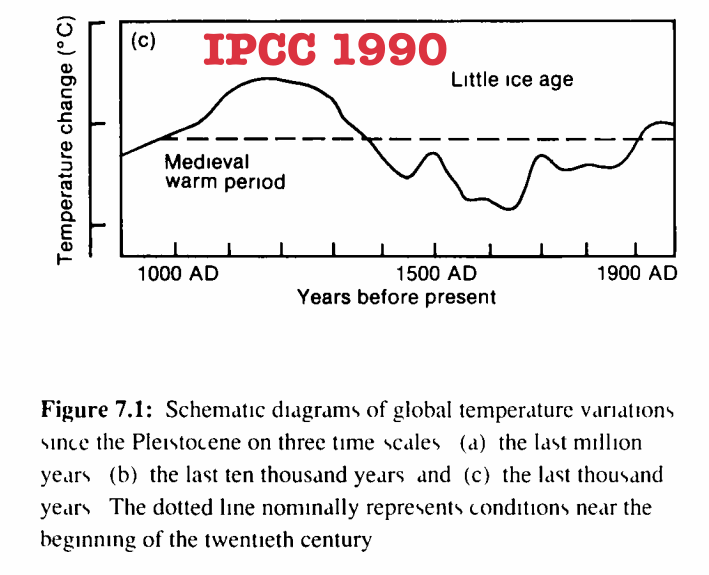
The IPCC showed that the warmest period of the last thousand years was in the 13th century, and that all recent warming occurred before the year 1940.

Screen Shot 2016-08-28 at 8.55.12 AM

ipcc_far_wg_I_chapter_07.pdf

There was no evidence of a human influence on climate, and that was no use for funding or political influence. So the decision was made to get rid of the Medieval Warm Period, and create a hockey stick of recent warming.

IPCC participant Jay Overpeck said in his email to Professor Deming, “We have to get rid of the Medieval Warm Period.”

http://drtimball.com/

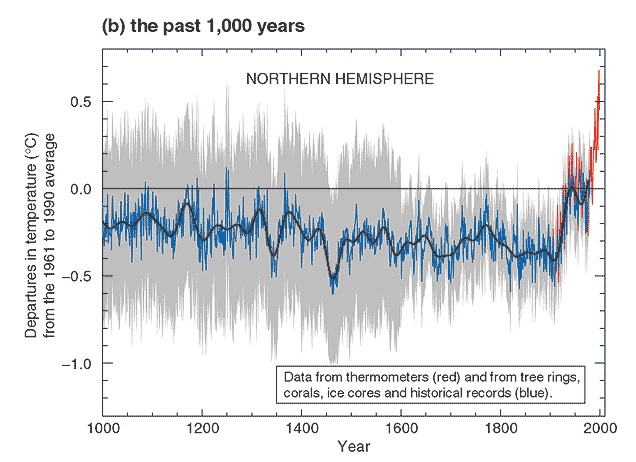
Michael Mann was up to the task, and he did exactly what Overpeck wanted him to do – he erased the Medieval Warm Period.

hockey stick mann

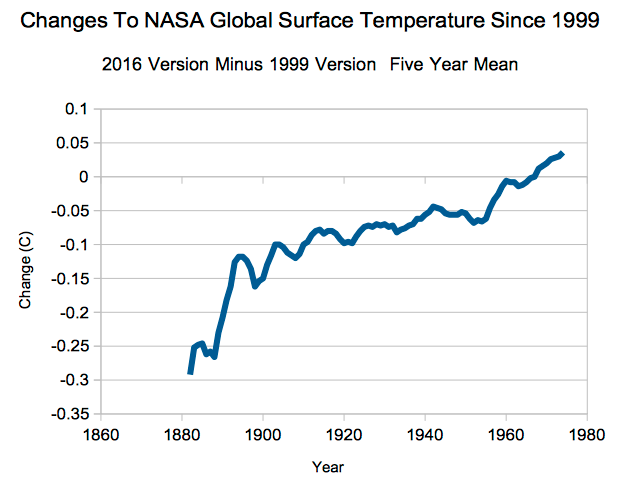
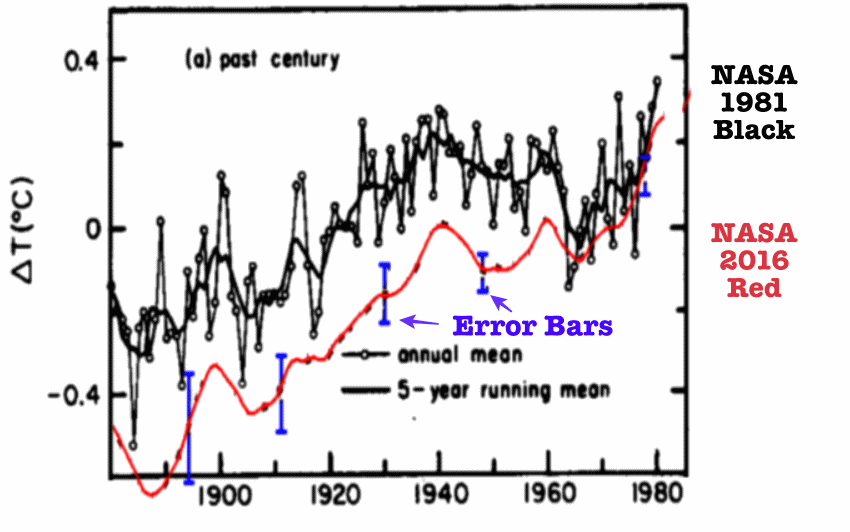
But that wasn’t enough to make the Hockey Stick. Mann needed some help from his buddies at NASA, James Hansen and Gavin Schmidt. They had to create about 0.6C warming from 1850 to 1976 – which they did by altering their own data.

Screen Shot 2016-08-28 at 8.52.22 AM

Hansen and Schmidt erased all of the warm years before 1880, and massively cooled all of the remaining years before 1970.

Screen Shot 2016-08-28 at 6.46.18 AM

Hansen and Schmidt created the blade of the hockey stick by tampering with their own data, just as Mann did with the proxy data to get rid of the MWP and LIA.

Screen Shot 2016-08-28 at 6.45.49 AM

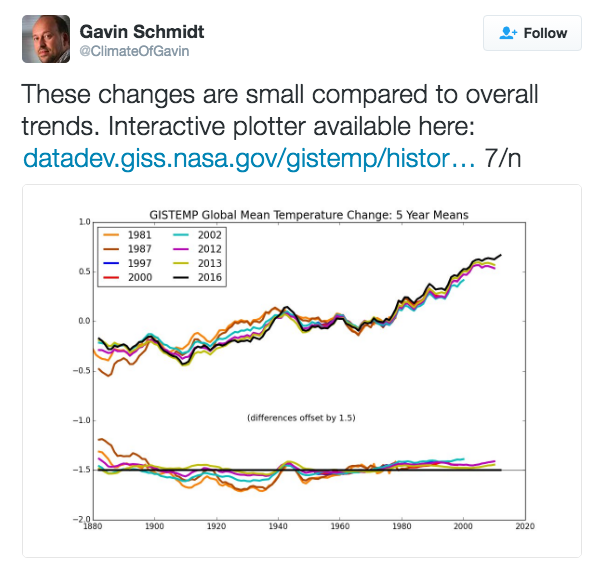
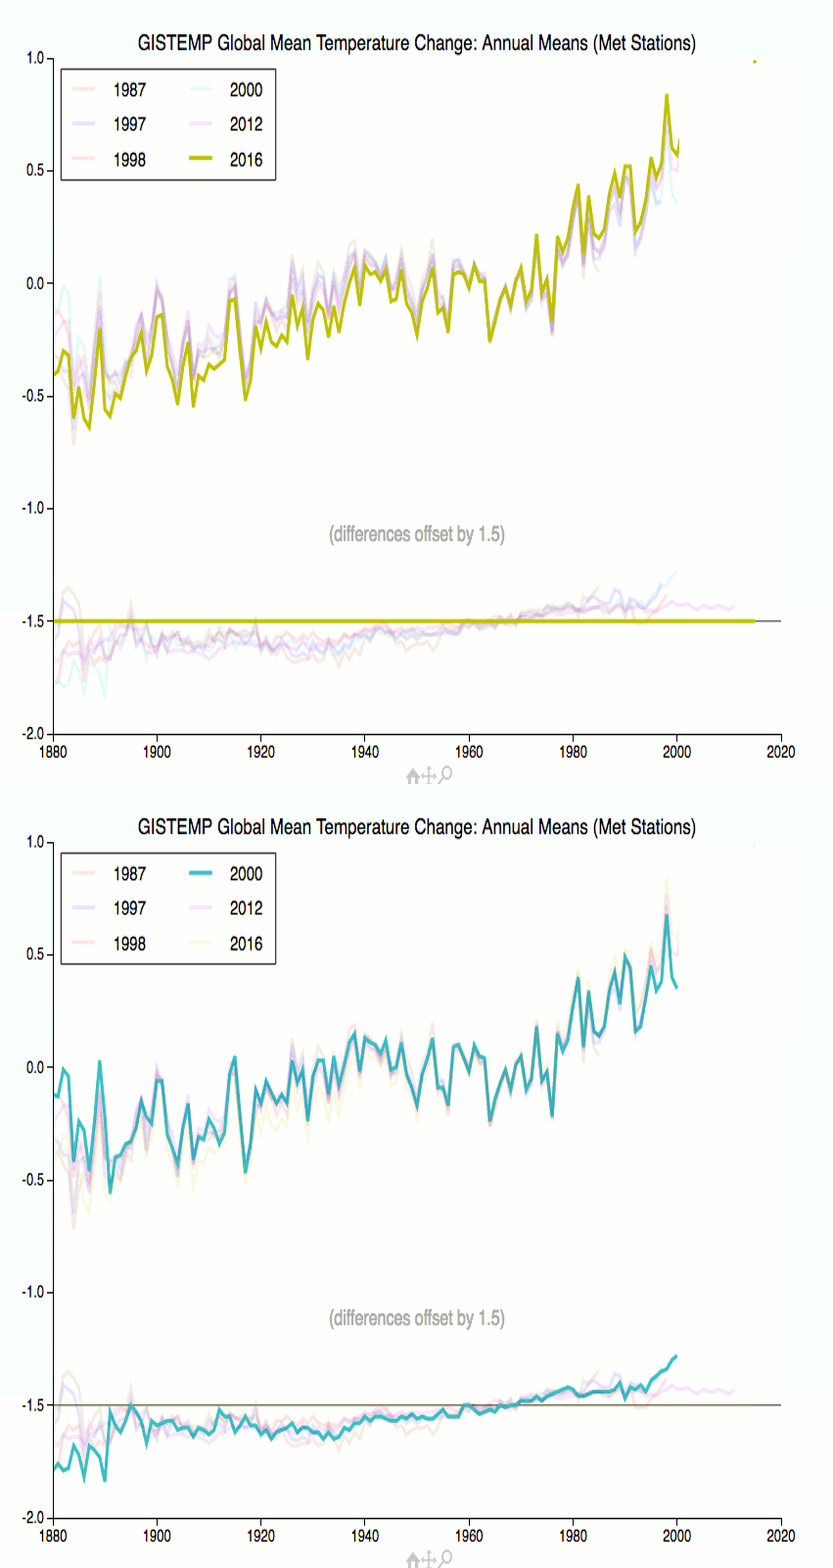
The massive climate fraud we are currently experiencing didn’t just happen.  It required two decades of planning and collusion to make it happen. Gavin says that is is no big deal that he nearly doubled 1880 to 1999 warming, hid the pre-1880 warmth, adjusted data far outside of his own error bars, and declared hottest year ever by a couple of hundredths of a degree.

Screen Shot 2016-08-28 at 10.52.10 AM

GISS-2000-2016

Data.GISS: GISTEMP HISTORY

2016-08-23100722-1

Posted in Uncategorized | Leave a comment

1935 – Most Powerful Hurricane In US History, And Alaskan Glaciers Retreating Miles Per Year

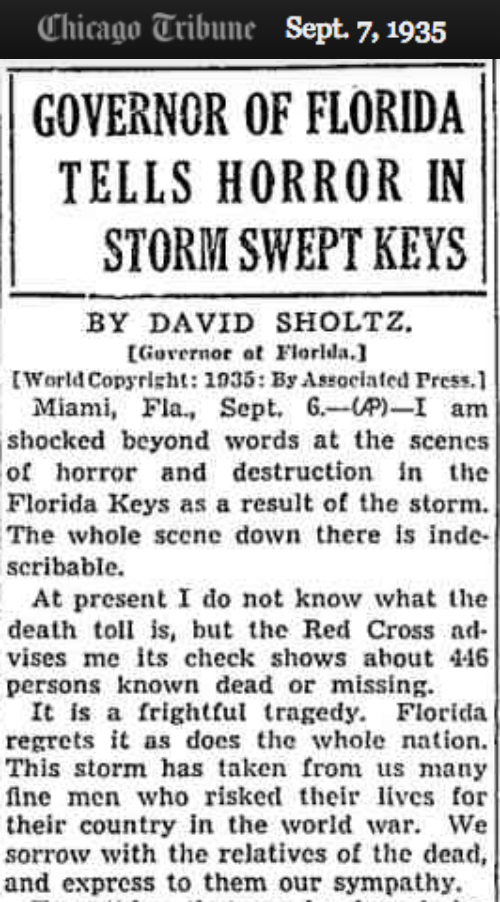
Labor Day 1935, the most powerful hurricane in US history struck Florida.

Screen Shot 2016-08-27 at 11.01.23 PM-down

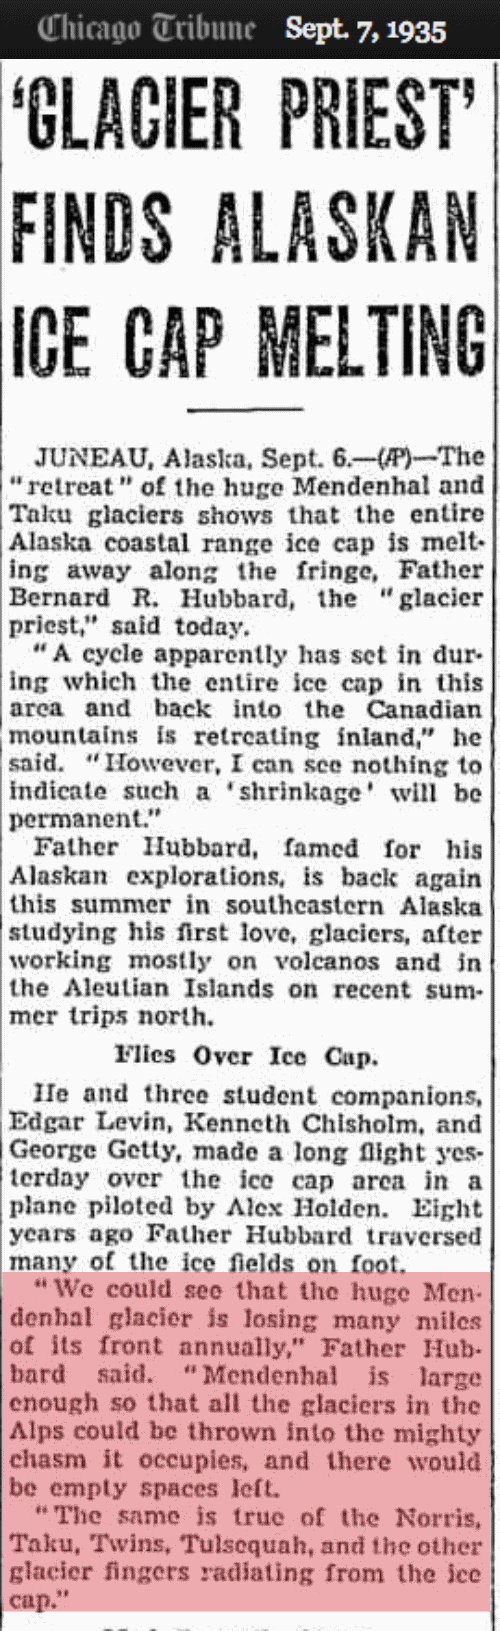
On the same day, it was reported that Alaska’s glaciers were retreating miles per year.

Screen Shot 2016-08-27 at 11.01.23 PM-down

September 7, 1935 – TWO MORE VESSELS KEPT FROM SAILING BY SEAMEN’S STRIKE | Chicago Tribune Archive

NASA says that 1935 was one of the 50 coldest years on record.

Posted in Uncategorized | Leave a comment

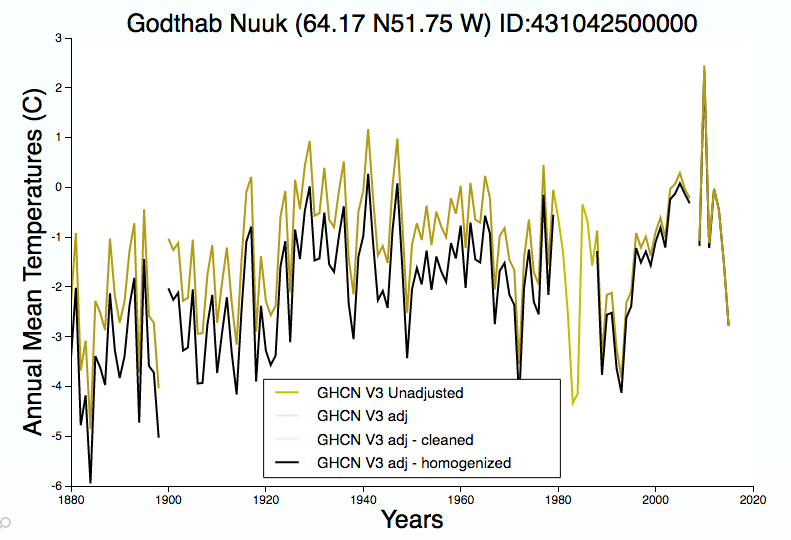
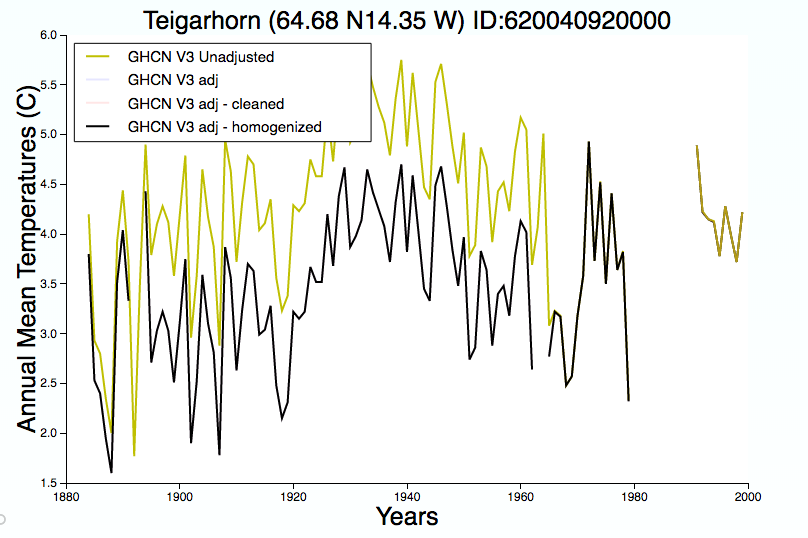
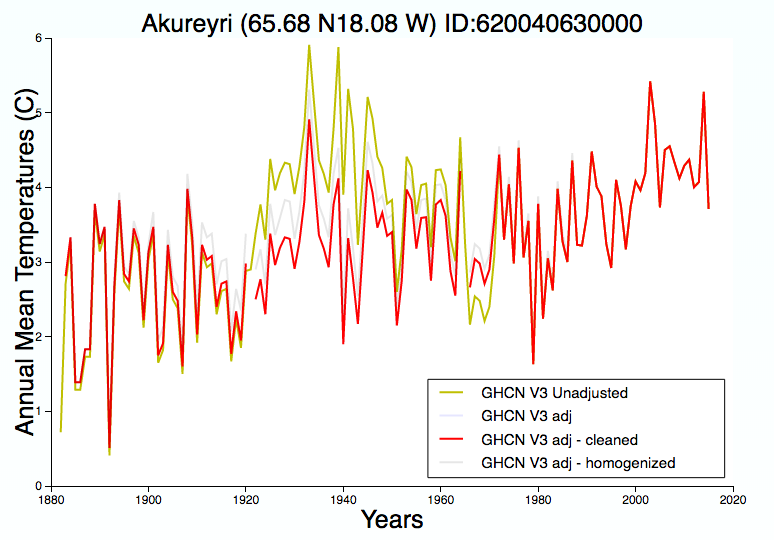
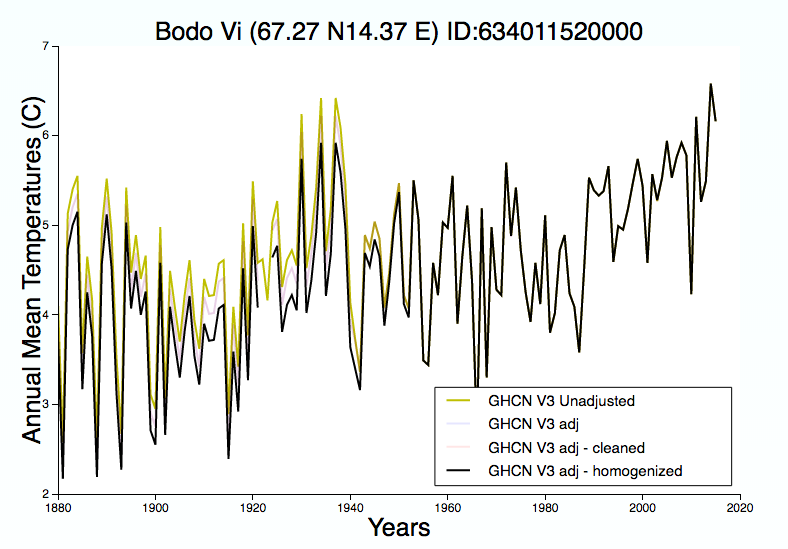
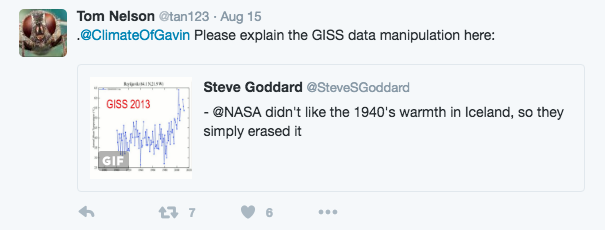
Gavin – Making The 1940’s Warmth Disappear In The Arctic

Screen Shot 2016-08-28 at 10.12.46 AM-down

potentialtrends.pdf

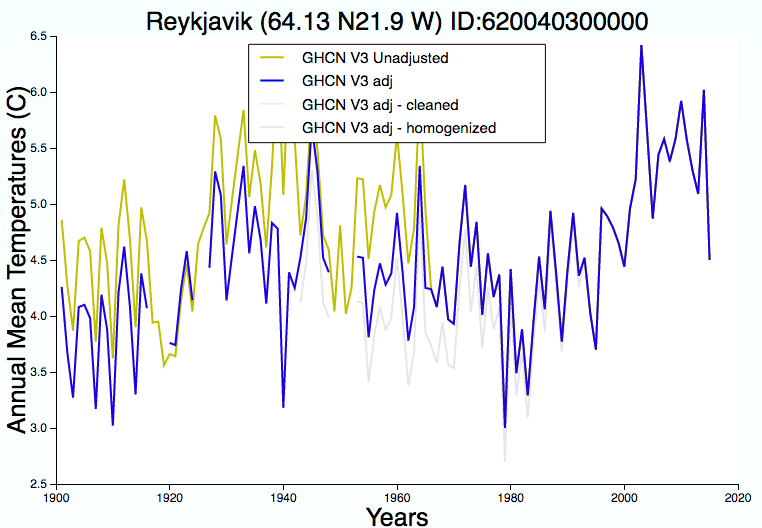
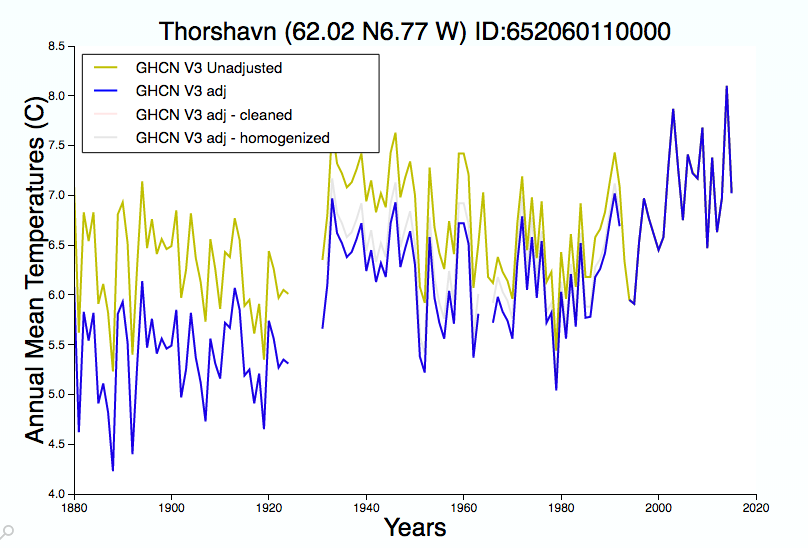
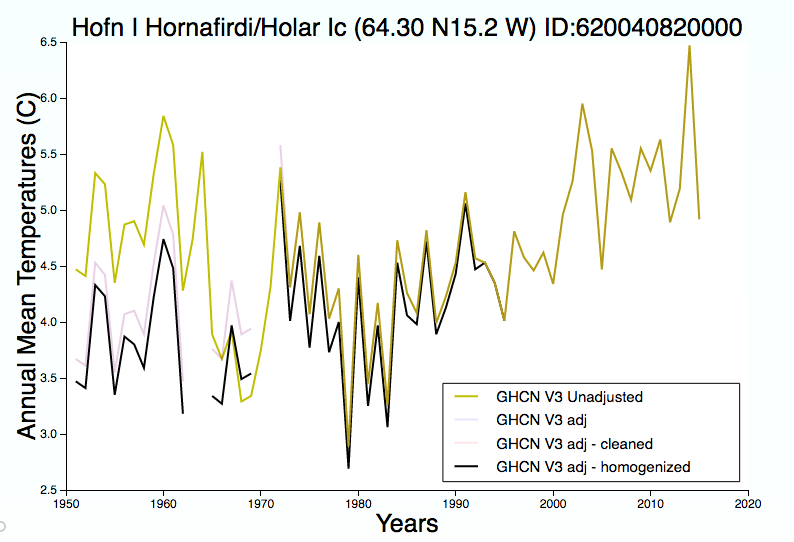
Thermometers show that the Arctic was just as warm or warmer around 1940. This destroys the global warming scam, so Gavin Schmidt simply made the earlier warmth disappear.  All of these graphs are generated from the GISS website.

Tan color in the graphs is the measured thermometer data.

Screen Shot 2016-08-28 at 5.36.04 AM Screen Shot 2016-08-28 at 4.56.27 AM Screen Shot 2016-08-28 at 4.55.55 AMScreen Shot 2016-08-28 at 5.54.30 AMScreen Shot 2016-08-28 at 5.32.48 AMScreen Shot 2016-08-28 at 5.31.00 AMScreen Shot 2016-08-28 at 5.30.06 AMScreen Shot 2016-08-28 at 5.28.58 AMScreen Shot 2016-08-28 at 5.26.23 AM

Screen Shot 2016-08-28 at 5.28.26 AM

Screen Shot 2016-08-28 at 5.52.55 AM

Posted in Uncategorized | Leave a comment

BBC Slimeballs

According to the trash at the BBC – millionaires living the American dream are victims of racial injustice, and people who want to enforce existing US law are waging war on “immigrants.”

Screen Shot 2016-08-27 at 10.44.41 PM

Posted in Uncategorized | Leave a comment

Corrupting Indiana

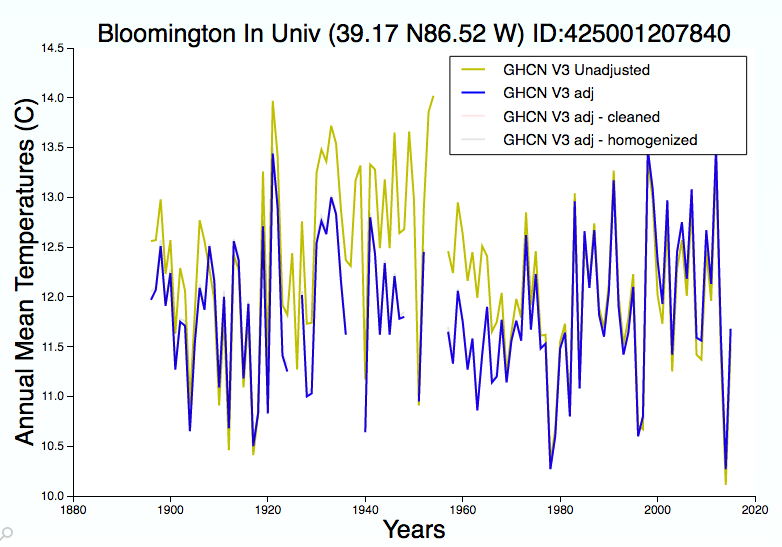
Indiana was very warm from the 1930’s through the 1950’s. It has since cooled several degrees and never warmed back up again.

BLOOMINGTONINUNIV_IN_AverageMeanTemperature_Jan_Dec_1896_2015

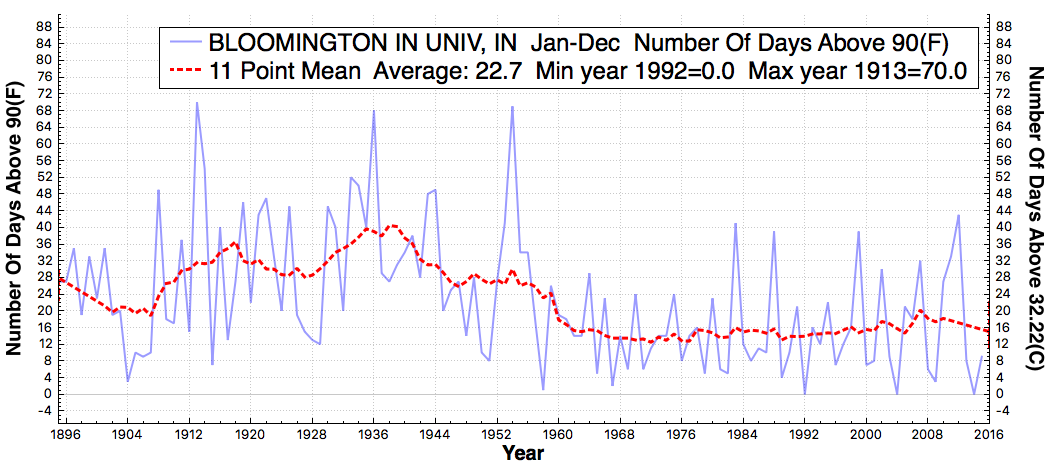
The number of 90 degree days has dropped in half since the 1930’s.

BLOOMINGTONINUNIV_IN_#DaysAboveMaximumTemperatureThreshold90F_Jan_Dec_1896_2015

This cooling didn’t suit NASA’s agenda, so they massively cooled Indiana’s past in order to create the appearance of warming.

Screen Shot 2016-08-28 at 8.32.25 AM

Data.GISS: GISS Surface Temperature Analysis

Posted in Uncategorized | Leave a comment

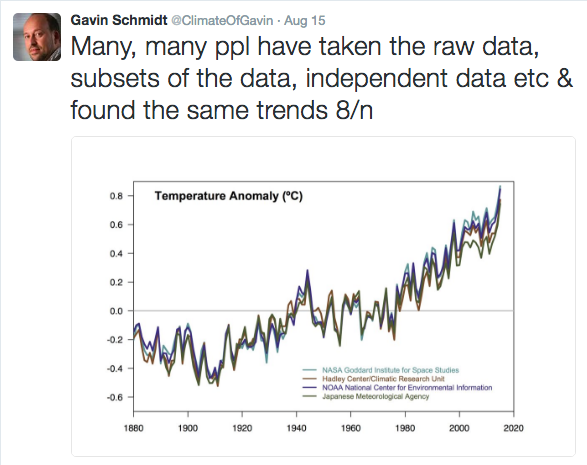
Gavin Lying About Data Independence

Gavin claims the data sets from different agencies are independent.

Screen Shot 2016-08-28 at 5.37.35 PM

But when cornered by obvious fraud, he blames NOAA – who will propagate it through the other data sets.

Screen Shot 2016-08-28 at 5.36.41 PM Screen Shot 2016-08-28 at 5.36.20 PM

Obviously the data sets are not independent and everyone is colluding.  NASA doesn’t even agree with NASA.

2016-08-23100722-1

Hansen 1981

Screen Shot 2016-08-28 at 6.46.18 AM

1999 data

Screen Shot 2016-08-28 at 6.45.49 AM

Independent data sets don’t look anything like the NASA data.

Screen Shot 2016-08-23 at 5.10.41 AM

14 Jul 1974, Page 1 – Lincoln Evening Journal

Cct3DOKUEAAUFQh

Science News  March 1, 1975

Posted in Uncategorized | Leave a comment

NASA Exaggerating Global Warming By 2X

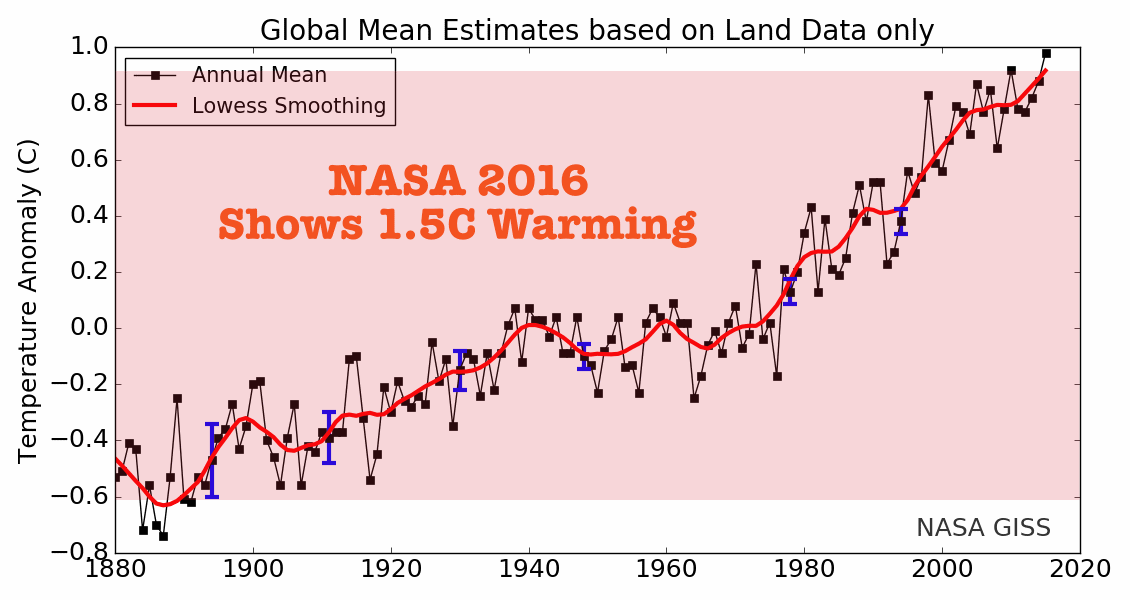
NASA currently shows a total of 1.5C warming in their land only temperature record.

graph (3)

graph.png (1130×600)

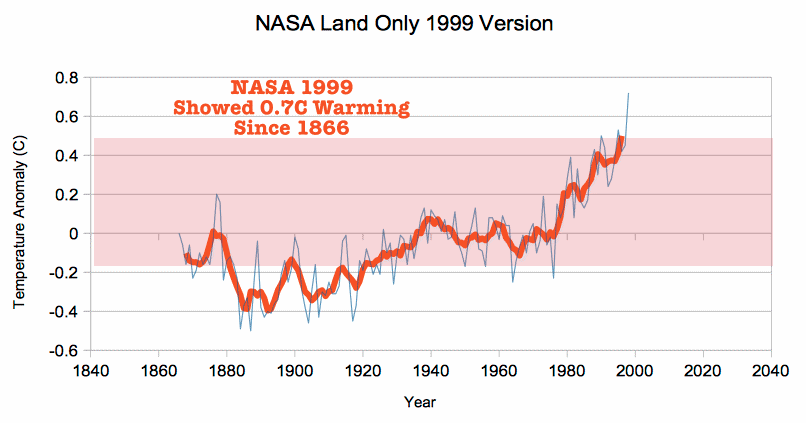
But the 1999 version of their data showed about 0.7C warming from 1866 to 1998.

Screen Shot 2016-08-28 at 3.50.21 PM

Archived from: http://www.giss.nasa.gov/data/gistemp/GLB.Ts.txt

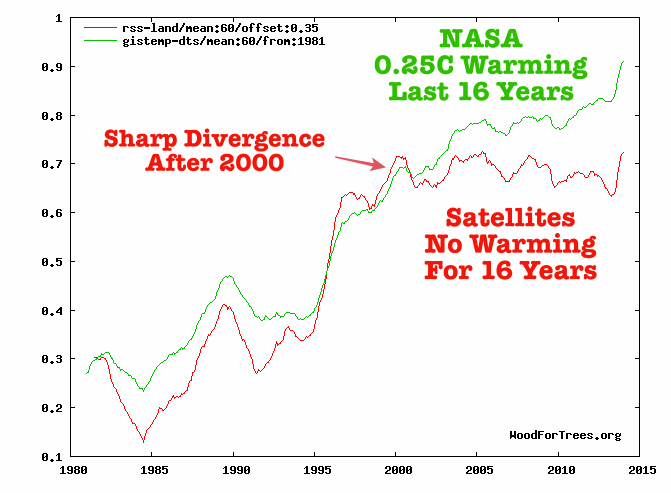
NASA clearly does not agree with NASA, so which version is correct? A good way to check is by comparing the NASA data with satellites. Through the year 1999, NASA surface temperatures agreed with satellite temperatures – but have diverged sharply since then. NASA shows continued warming since the year 2000, but satellites show none.

Screen Shot 2016-08-28 at 2.08.40 PM

Wood for Trees: Interactive Graphs

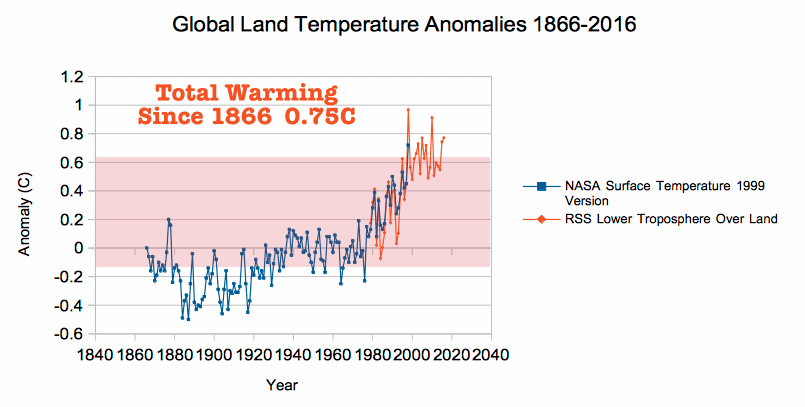
This makes the post-2000 NASA data look very suspect. If we splice the satellite data on to the last reliable NASA surface temperatures from 1999, we see a total of 0.75C warming over the past 150 years – half of what NASA is currently showing for their entire data set.

Screen Shot 2016-08-28 at 5.06.03 PM

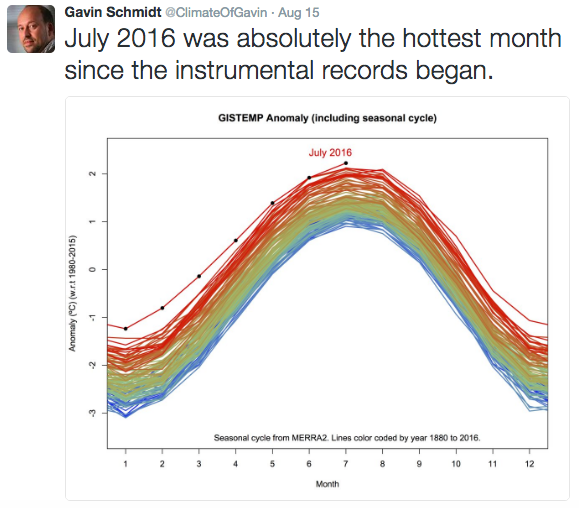
Gavin claims that July 2016 “was absolutely the hottest month since the instrumental records began.

Screen Shot 2016-08-28 at 4.19.59 PM

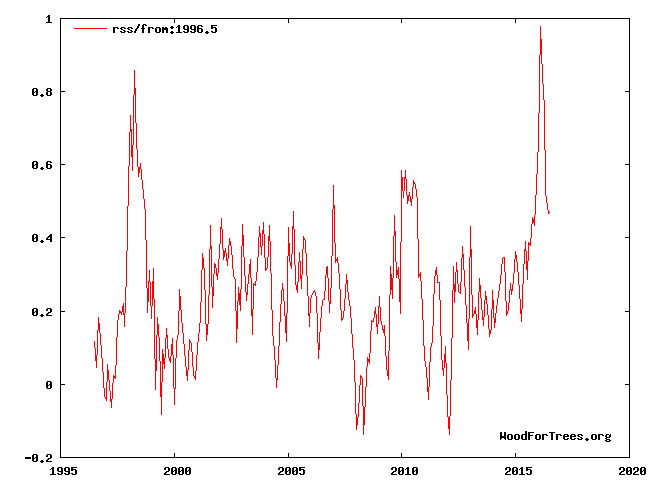
The instrumental satellite record showed that Gavin was absolutely not telling the truth. July was nowhere near as warm as 1998 or 2010.

Screen Shot 2016-08-28 at 4.21.51 PM

Wood for Trees: Interactive Graphs

Gavin’s claims of record heat are simply not defensible. He is claiming records by tiny margins – which are much larger than the discrepancies with more accurate techniques.

Posted in Uncategorized | Leave a comment

Brian Cox Junk Science – Part 3

Screen Shot 2016-08-23 at 7.54.22 AM-down

Brian Cox says the graph he was photographed with above, was made by the people who put men on the moon – and therefore must be correct. His claim is ridiculous and unscientific at many levels, but particularly for these three reasons :

  1. The small group of people at the Goddard Institute for Space Studies (GISS) who made that graph, have nothing to do with the space program.
  2. Many of the NASA people who did actually put men on the moon have expressed concern about the quality of the work at GISS.
  3. Most importantly, the graph is incorrect. Wildly incorrect – as I will show below.

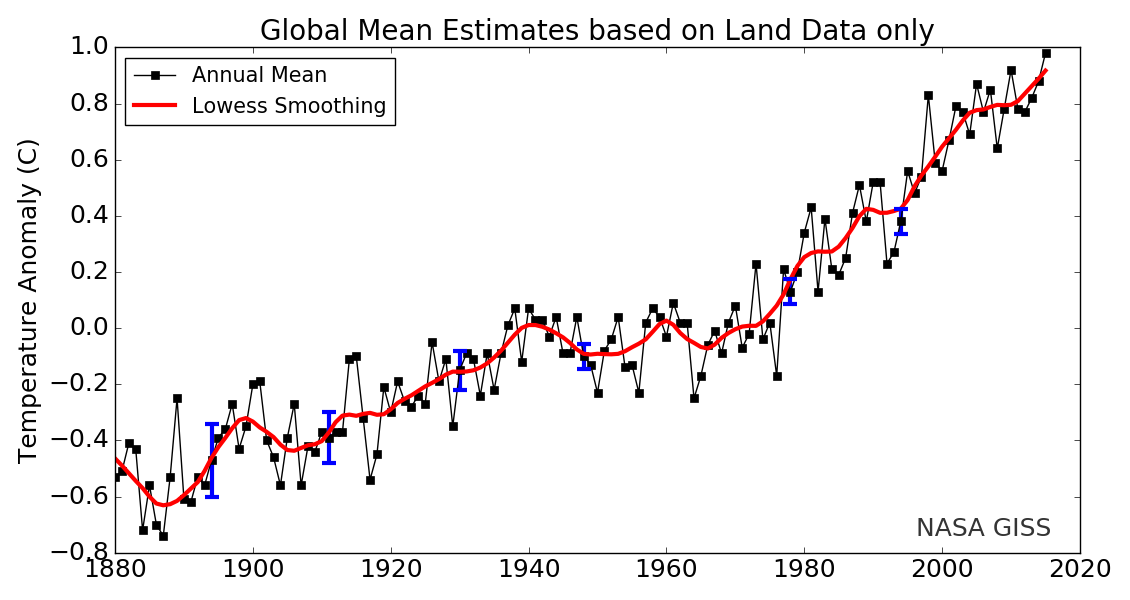
The current version of GISS land temperatures shows a slight warming from 1940 to 1970.
graph (2)

graph.png (1130×600)

In 1974, the National Center for Atmospheric Research reported a 0.4C global cooling from 1940 to 1970.
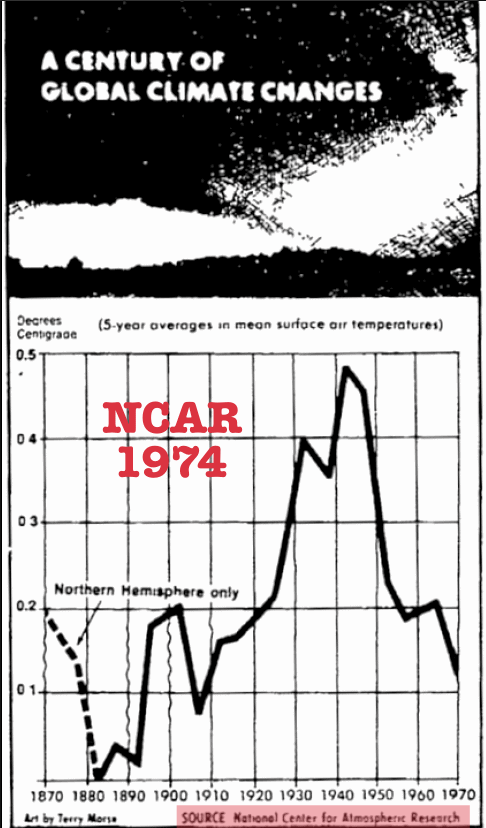
Screen Shot 2016-08-23 at 5.10.41 AM

14 Jul 1974, Page 1 – Lincoln Evening Journal

In 1975, The National Academy of Sciences reported the same 1940-1970 cooling.
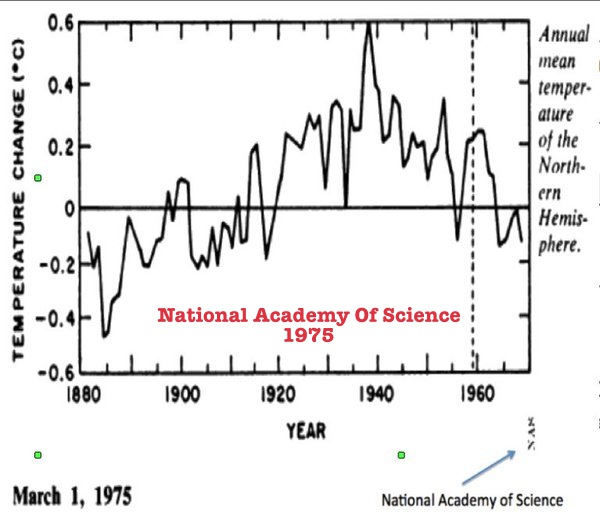
Cct3DOKUEAAUFQh

Science News  March 1, 1975

In 1961, there was unanimous consensus among scientists that the world was cooling.
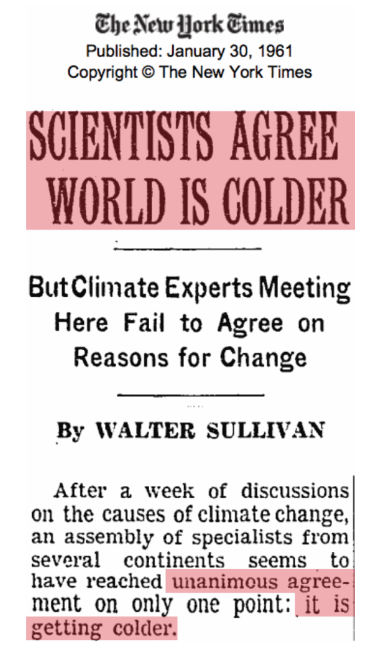
Screen Shot 2016-08-27 at 5.55.23 PM

TimesMachine: January 30, 1961 – NYTimes.com

In 1978, experts said there was no end in sight to the 30 year long cooling trend for all reliable data (i.e. north of 20S latitude.) This was confirmed  by surface temperatures as well as radiosonde temperatures in the atmosphere.

Screen Shot 2016-08-23 at 11.08.27 PM-down

International Team of Specialists Finds No End in Sight to 30?Year Cooling Trend in Northern Hemisphere – The New York Times

NOAA reported this cooling for both land and atmospheric temperatures.
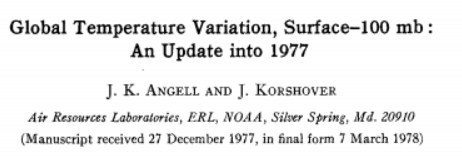
2016-05-09063602

2016-05-09062919

Angell NOAA 1978

In 1979, experts from NOAA and NCAR said it was indisputable that Earth had cooled since World War II.

Screen Shot 2016-08-27 at 6.18.51 PM-down

Lakeland Ledger – Google News Archive Search

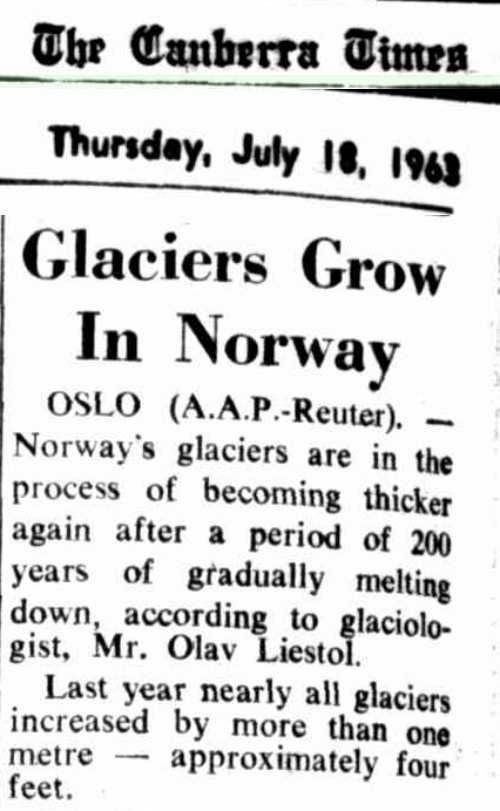
Glaciers were growing in Norway for the first time in 200 years.
Screen Shot 2016-08-27 at 9.35.57 PM-down

Glaciers Grow In Norway

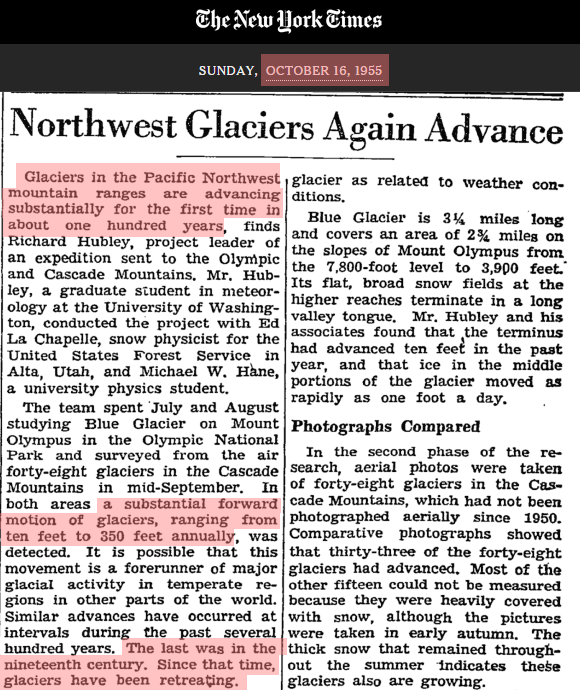
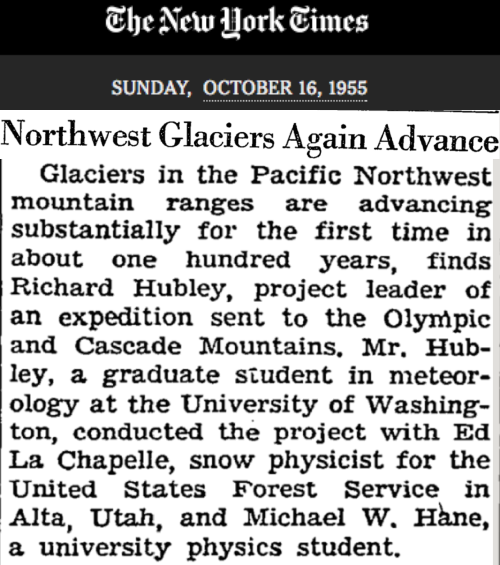
Glaciers in the Pacific Northwest were advancing for the first time in 100 years.
Screen Shot 2016-08-27 at 9.41.05 PM-down  
 Northwest Glaciers Again Advance – The New York Times

The Arctic was getting colder, and Arctic sea ice was expanding.

Screen Shot 2016-08-27 at 9.46.24 PM-down

U.S. and Soviet Press Studies of a Colder Arctic;

In 1989 NOAA’s Tom Karl, the head of the National Climatic Data Center, said that Earth cooled from 1921 to 1979. NASA now shows substantial warming during that period.
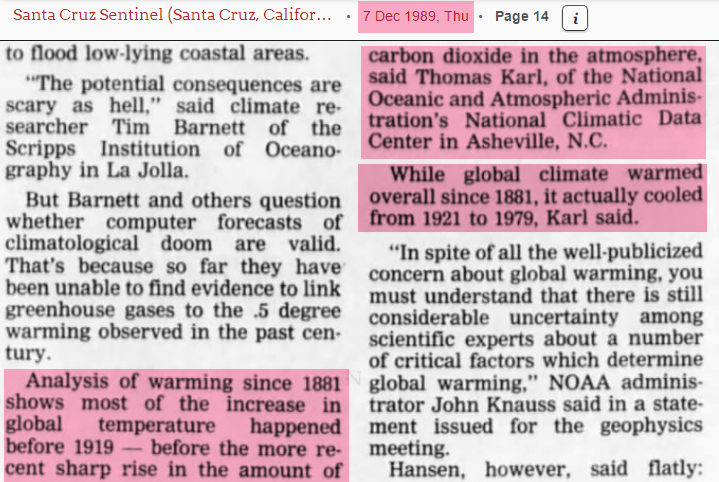
Image-131-1 (1)

7 Dec 1989, Page 14

So what happened to this post-1940 cooling which was overwhelmingly documented and was supported by 100% of scientists at the time?

NASA used to show it, but they gradually erased it over time – and now they have turned it into warming. Blatant data tampering by James Hansen and Gavin Schmidt at NASA.
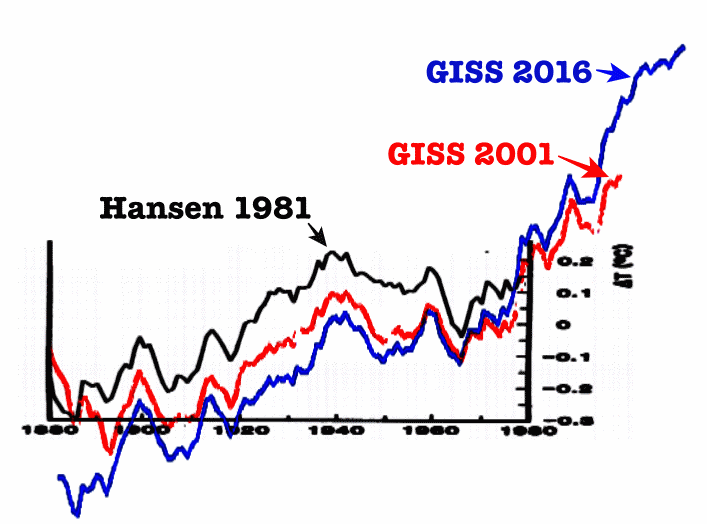
2016-05-09050642

1981: 1981_Hansen_etal_1.pdf    2001: Fig.A.ps     Current: Fig.A.gif

The removal of the post 1940 cooling was not accidental, and was in fact premeditated. In Climategate E-mails, the hockey team made clear their desire to manipulate the temperature record and remove the post-1940 cooling – without any pretense of justification.

From: Tom Wigley <[email protected]>
To: Phil Jones <[email protected]>
Subject: 1940s
Date: Sun, 27 Sep 2009 23:25:38 -0600
Cc: Ben Santer <[email protected]>

So, if we could reduce the ocean blip by, say, 0.15 degC,
then this would be significant for the global mean — but
we’d still have to explain the land blip.

It would be good to remove at least part of the 1940s blip, but we are still left with “why the blip”.

di2.nu/foia/1254108338.txt

In another Climategate E-mail, Phil Jones said that much of the southern hemisphere data was “mostly made up.

date: Wed Apr 15 14:29:03 2009
from: Phil Jones <[email protected]> subject: Re: Fwd: Re: contribution to RealClimate.org
to: Thomas Crowley <[email protected]>

Tom,

The issue Ray alludes to is that in addition to the issue
of many more drifters providing measurements over the last
5-10 years, the measurements are coming in from places where
we didn’t have much ship data in the past. For much of the SH between 40 and 60S the normals are mostly made up as there is very little ship data there.

Cheers
Phil

di2.nu/foia/foia2011/mail/2729.txt

The 1940’s land blip described by Tom Wigley no longer exists. Gavin Schmidt at NASA has since entirely removed it. In order to believe Gavin Schmidt’s graph, you would have to believe that every other scientist who studied the temperature record before him was incompetent.

Brian Cox held up a fraudulent graph and attributed it to people who had nothing to do with it, and in fact specifically questioned the quality of the work being done by the people behind it. Brian Cox misled the people of Australia, and I am headed down there to help sort it out, and restore scientific integrity.

Posted in Uncategorized | Leave a comment

More Time Lapse Fun

Posted in Uncategorized | Leave a comment

More Climate Chaos Video

Screen Shot 2016-08-26 at 7.02.25 PM Screen Shot 2016-08-26 at 7.03.03 PM

Posted in Uncategorized | Leave a comment