
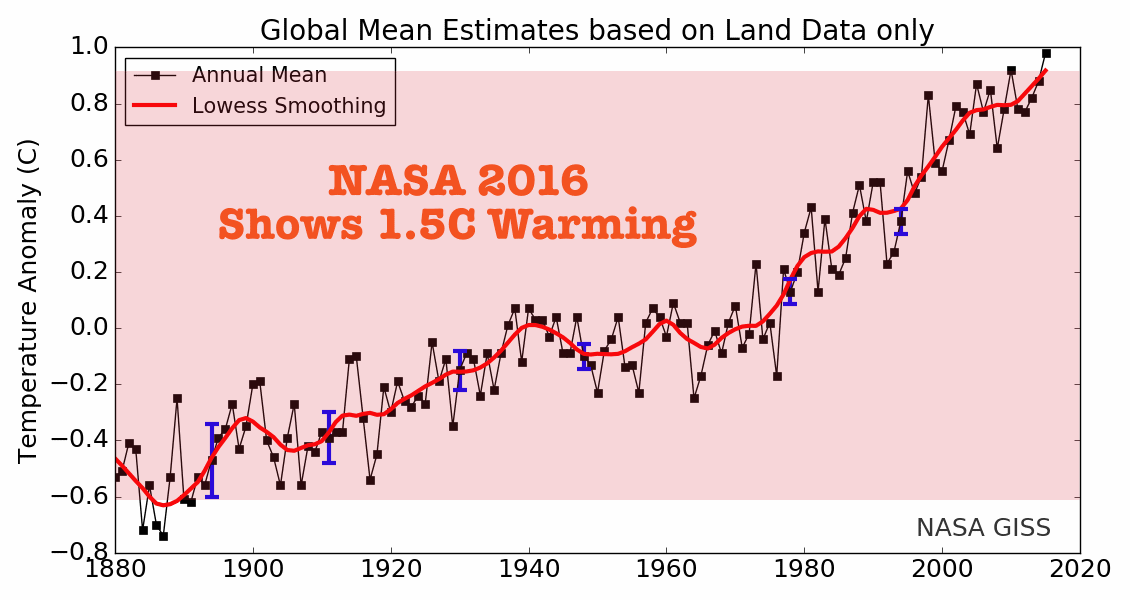
NASA currently shows a total of 1.5C warming in their land only temperature record.
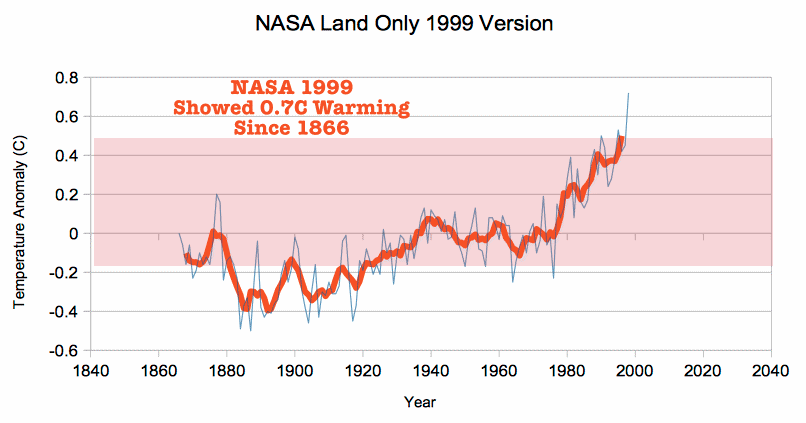
But the 1999 version of their data showed about 0.7C warming from 1866 to 1998.
Archived from: http://www.giss.nasa.gov/data/gistemp/GLB.Ts.txt
NASA clearly does not agree with NASA, so which version is correct? A good way to check is by comparing the NASA data with satellites. Through the year 1999, NASA surface temperatures agreed with satellite temperatures – but have diverged sharply since then. NASA shows continued warming since the year 2000, but satellites show none.
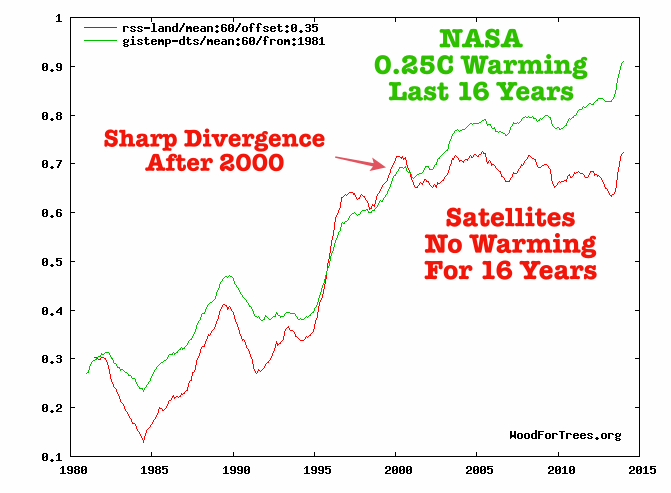
Wood for Trees: Interactive Graphs
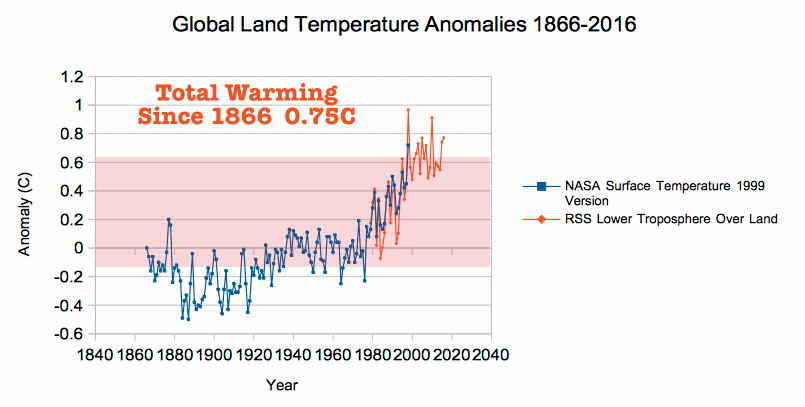
This makes the post-2000 NASA data look very suspect. If we splice the satellite data on to the last reliable NASA surface temperatures from 1999, we see a total of 0.75C warming over the past 150 years – half of what NASA is currently showing for their entire data set.
Gavin claims that July 2016 “was absolutely the hottest month since the instrumental records began.”
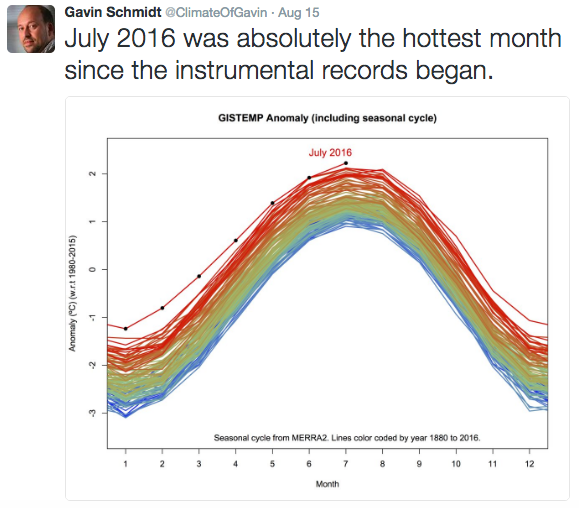
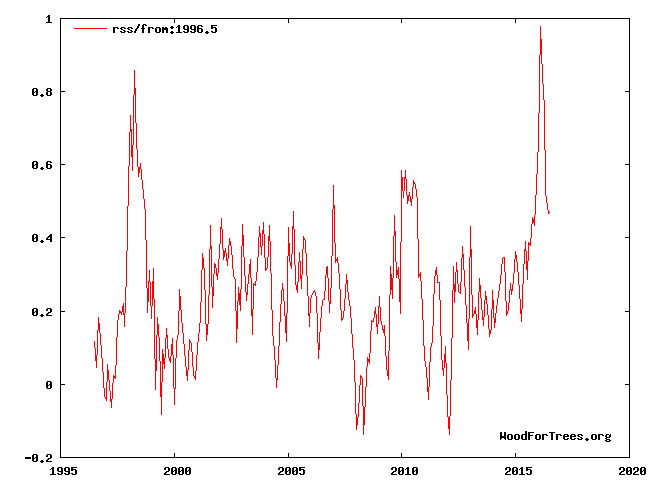
The instrumental satellite record showed that Gavin was absolutely not telling the truth. July was nowhere near as warm as 1998 or 2010.
Wood for Trees: Interactive Graphs
Gavin’s claims of record heat are simply not defensible. He is claiming records by tiny margins – which are much larger than the discrepancies with more accurate techniques.
