
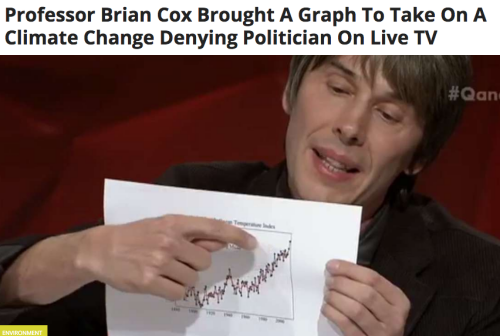
Brian Cox says the graph he was photographed with above, was made by the people who put men on the moon – and therefore must be correct. His claim is ridiculous and unscientific at many levels, but particularly for these three reasons :
- The small group of people at the Goddard Institute for Space Studies (GISS) who made that graph, have nothing to do with the space program.
- Many of the NASA people who did actually put men on the moon have expressed concern about the quality of the work at GISS.
- Most importantly, the graph is incorrect. Wildly incorrect – as I will show below.
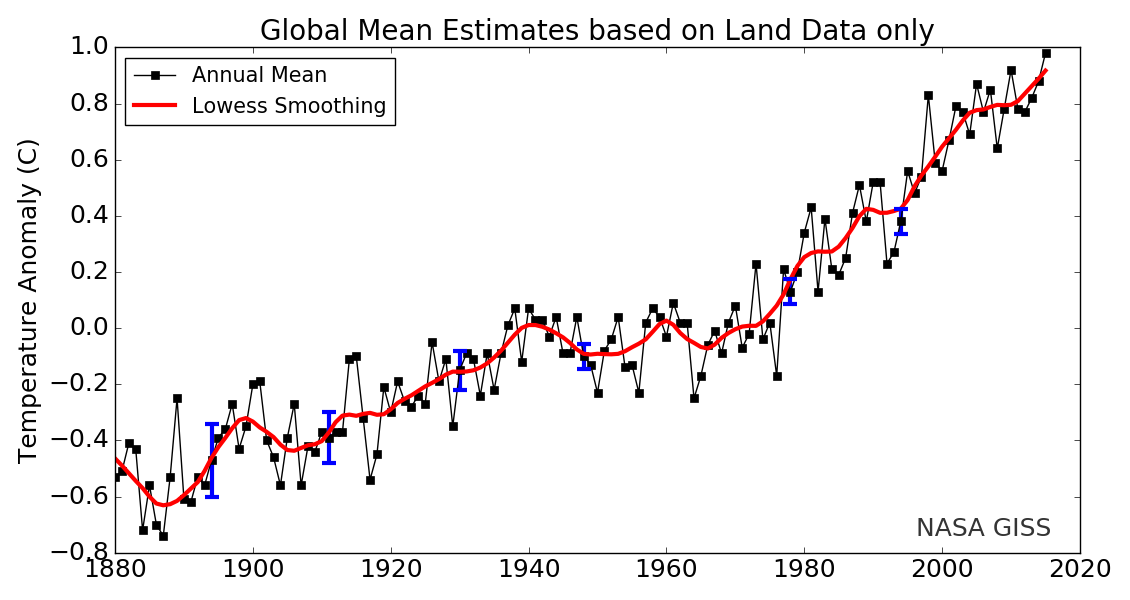
The current version of GISS land temperatures shows a slight warming from 1940 to 1970.
In 1974, the National Center for Atmospheric Research reported a 0.4C global cooling from 1940 to 1970.
14 Jul 1974, Page 1 – Lincoln Evening Journal
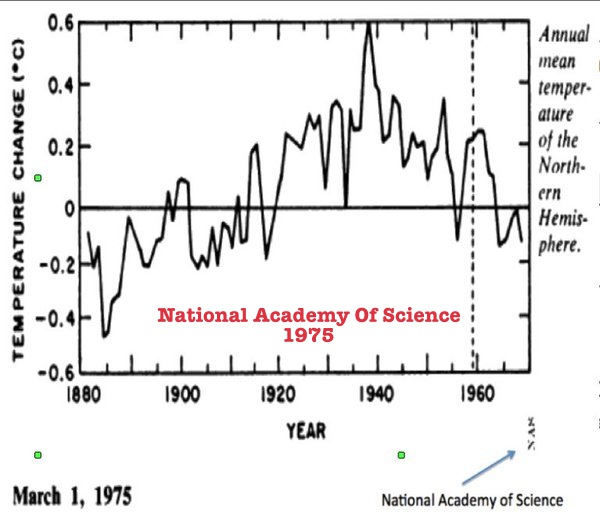
In 1975, The National Academy of Sciences reported the same 1940-1970 cooling.
In 1961, there was unanimous consensus among scientists that the world was cooling.
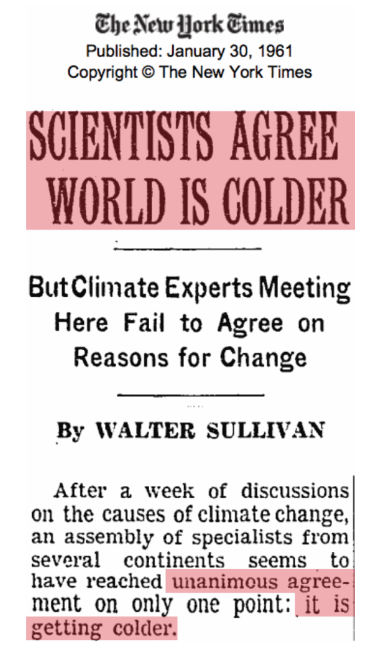
TimesMachine: January 30, 1961 – NYTimes.com
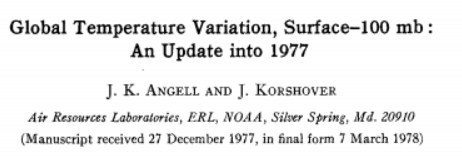
In 1978, experts said there was no end in sight to the 30 year long cooling trend for all reliable data (i.e. north of 20S latitude.) This was confirmed by surface temperatures as well as radiosonde temperatures in the atmosphere.

NOAA reported this cooling for both land and atmospheric temperatures.
In 1979, experts from NOAA and NCAR said it was indisputable that Earth had cooled since World War II.

Lakeland Ledger – Google News Archive Search
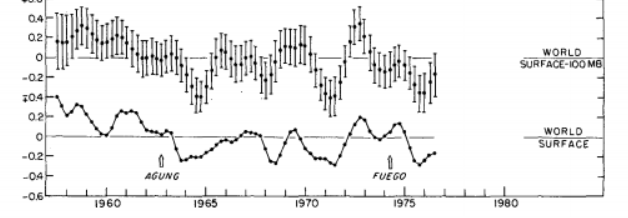
Glaciers were growing in Norway for the first time in 200 years.
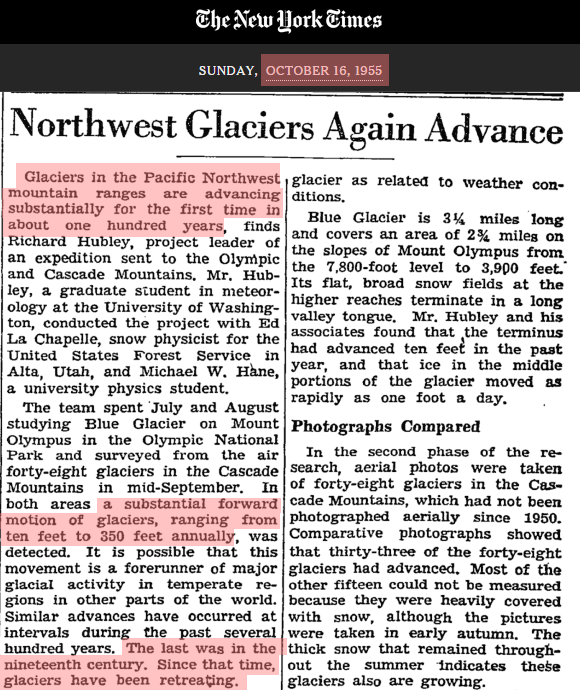
Glaciers in the Pacific Northwest were advancing for the first time in 100 years.
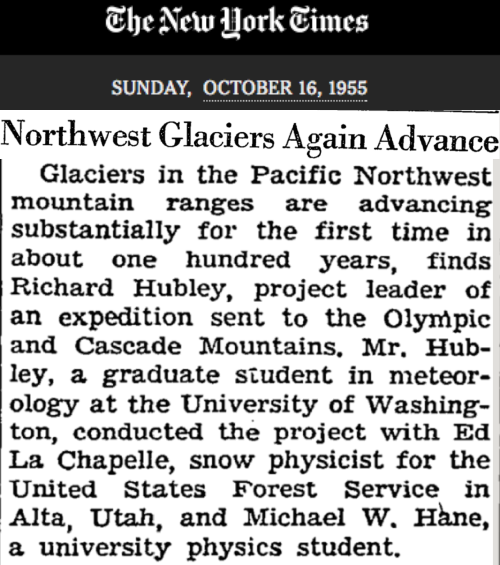
Northwest Glaciers Again Advance – The New York Times
The Arctic was getting colder, and Arctic sea ice was expanding.

U.S. and Soviet Press Studies of a Colder Arctic;
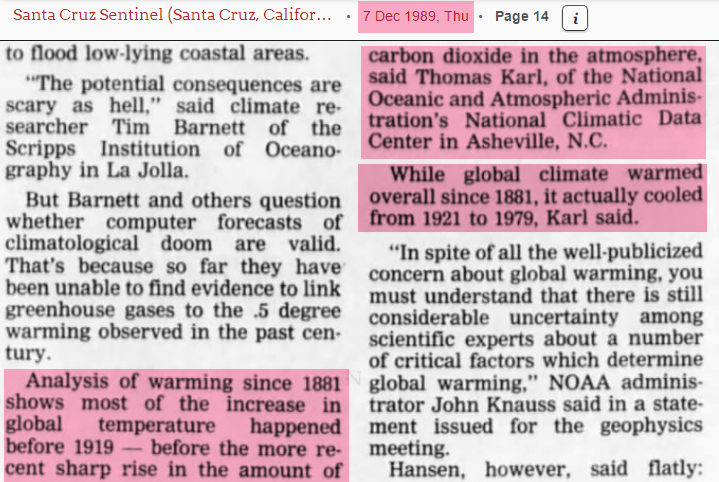
In 1989 NOAA’s Tom Karl, the head of the National Climatic Data Center, said that Earth cooled from 1921 to 1979. NASA now shows substantial warming during that period.
So what happened to this post-1940 cooling which was overwhelmingly documented and was supported by 100% of scientists at the time?
NASA used to show it, but they gradually erased it over time – and now they have turned it into warming. Blatant data tampering by James Hansen and Gavin Schmidt at NASA.
1981: 1981_Hansen_etal_1.pdf 2001: Fig.A.ps Current: Fig.A.gif
The removal of the post 1940 cooling was not accidental, and was in fact premeditated. In Climategate E-mails, the hockey team made clear their desire to manipulate the temperature record and remove the post-1940 cooling – without any pretense of justification.
From: Tom Wigley <[email protected]>
To: Phil Jones <[email protected]>
Subject: 1940s
Date: Sun, 27 Sep 2009 23:25:38 -0600
Cc: Ben Santer <[email protected]>So, if we could reduce the ocean blip by, say, 0.15 degC,
then this would be significant for the global mean — but
we’d still have to explain the land blip.It would be good to remove at least part of the 1940s blip, but we are still left with “why the blip”.
In another Climategate E-mail, Phil Jones said that much of the southern hemisphere data was “mostly made up.”
date: Wed Apr 15 14:29:03 2009
from: Phil Jones <[email protected]> subject: Re: Fwd: Re: contribution to RealClimate.org
to: Thomas Crowley <[email protected]>Tom,
The issue Ray alludes to is that in addition to the issue
of many more drifters providing measurements over the last
5-10 years, the measurements are coming in from places where
we didn’t have much ship data in the past. For much of the SH between 40 and 60S the normals are mostly made up as there is very little ship data there.Cheers
Phil
The 1940’s land blip described by Tom Wigley no longer exists. Gavin Schmidt at NASA has since entirely removed it. In order to believe Gavin Schmidt’s graph, you would have to believe that every other scientist who studied the temperature record before him was incompetent.
Brian Cox held up a fraudulent graph and attributed it to people who had nothing to do with it, and in fact specifically questioned the quality of the work being done by the people behind it. Brian Cox misled the people of Australia, and I am headed down there to help sort it out, and restore scientific integrity.
