Blaming Trump For Communism

Cruz, Rubio and Kasich have all blamed Trump for the behavior of Bernie Sander’s fellow Communist travelers the last two days.

Check out this Communist thug who physically attacked Trump today.

Screenshot 2016-03-12 at 03.50.38 PM

Here is a video he made, dragging the American flag.

https://www.youtube.com/watch?v=Q0Kwcp2DLFo

Posted in Uncategorized | 46 Comments

NSIDC’s Arctic Illusion

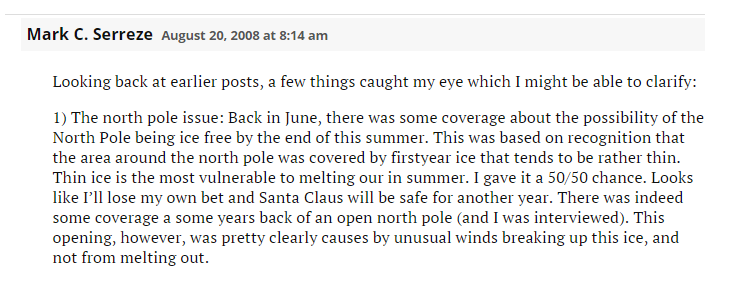
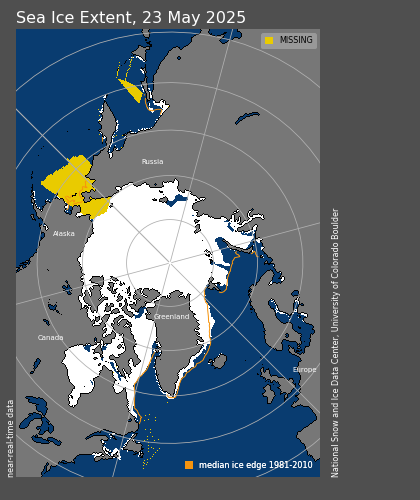
Mark Serreze is the director of the National Snow and Ice Data Center in Boulder, Colorado. He believes that the Arctic is screaming, and he predicted that the North Pole would be ice-free in 2008.
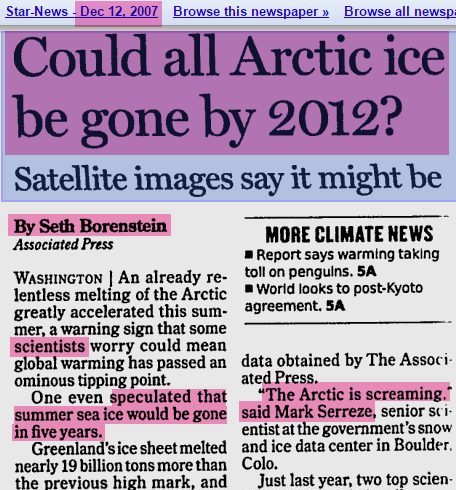
Image-431

Star-News

2016-03-12063146

August 20, 2008 at 8:14 am

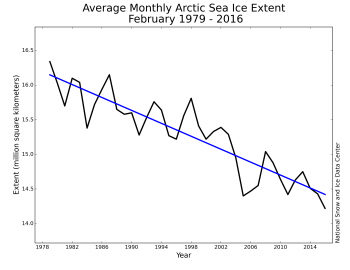
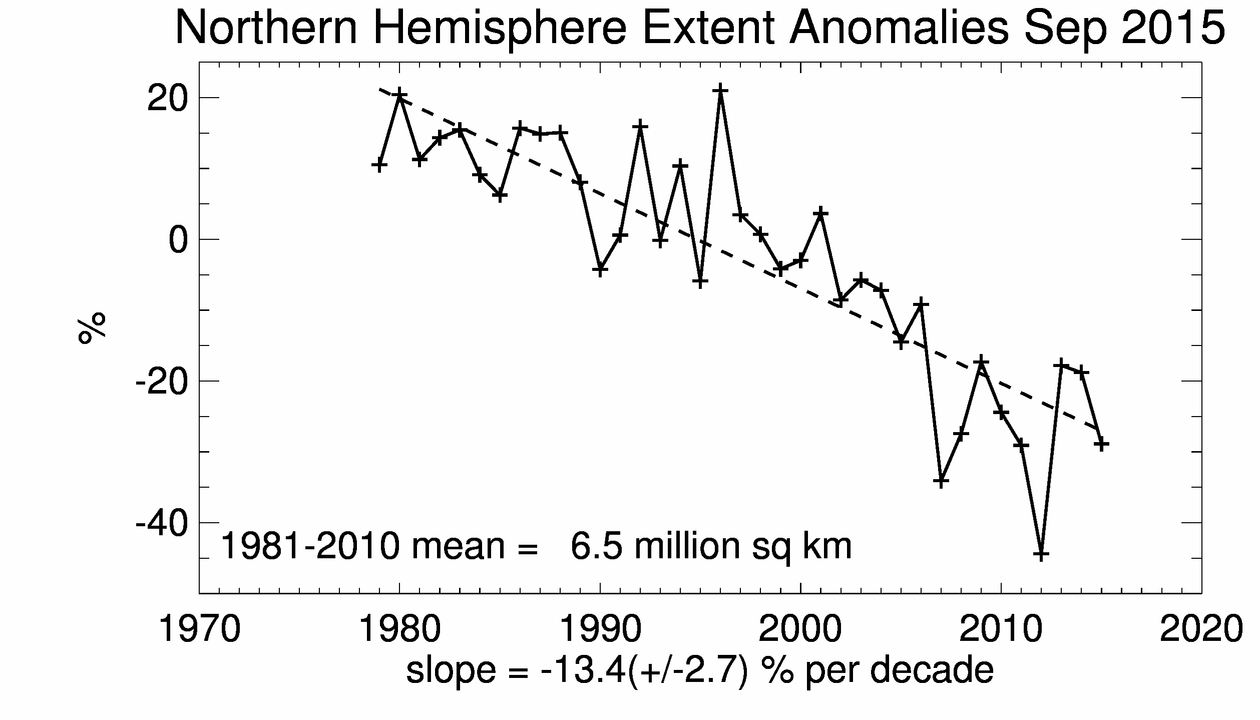
NSIDC graphs make it look like screaming Arctic sea ice is declining linearly, with 2016 at a record low.
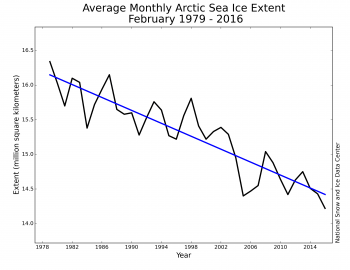
Figure3_0301-350x270

Arctic Sea Ice News and Analysis

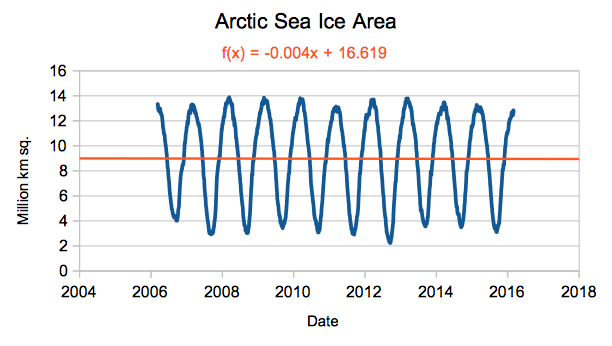
Even though there has been almost no change in sea ice area over the past decade.

Screenshot 2016-03-10 at 10.24.47 AM

timeseries.anom.1979-2008

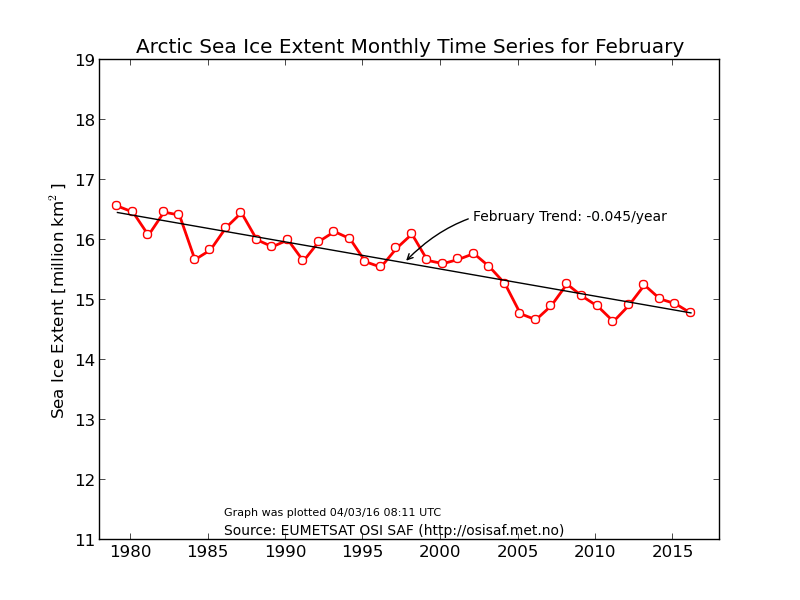
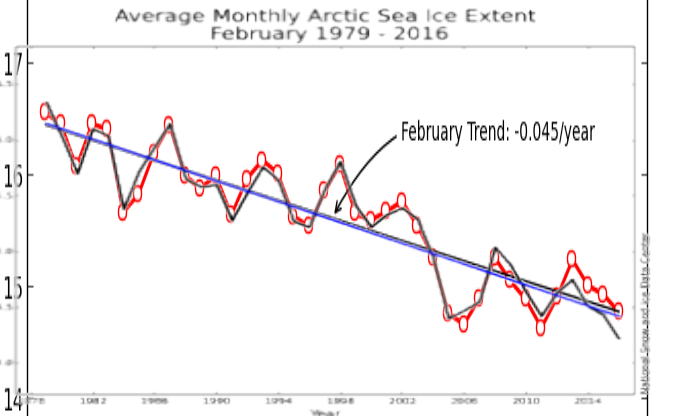
The Danish Meteorological Institute shows a very different graph, with no change over the past decade, or perhaps a slight increase.
osisaf_nh_iceextent_monthly-02_en

osisaf_nh_iceextent_monthly-02_en.png

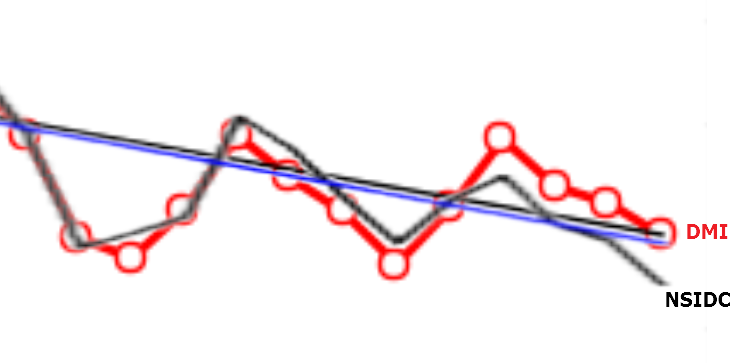
The graph below overlays the black NSIDC graph on the red DMI graph. The graphs matched fairly well until four years ago, when the NSIDC line diverged sharply downwards.
2016-03-11145922

2016-03-12062126

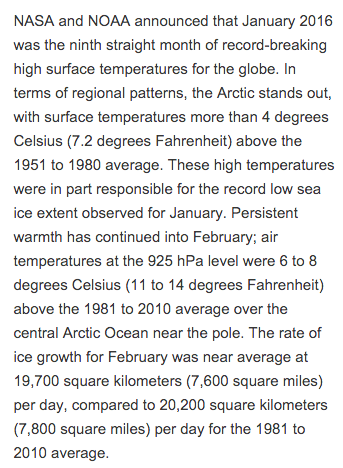
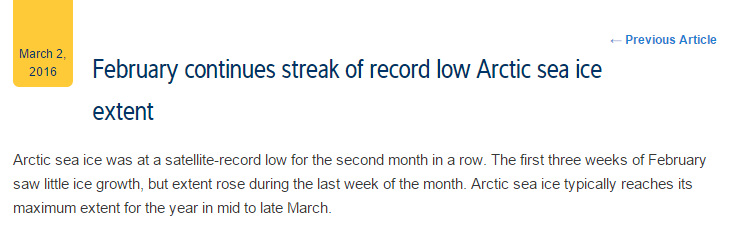
This divergence is enough to allow NSIDC to declare a record low and create the appearance of a downwards trend. More importantly, it allows them to make hysterical press releases like this.
2016-03-12064144

February continues streak of record low Arctic sea ice extent

Another interesting story at NSIDC is that they stopped updating their ice age maps on week 36 last year, the week before the ice has its annual birthday. Had they updated the maps, they would have shown a huge increase in the amount of the oldest/thickest ice. But that isn’t the story NSIDC is paid to produce.


Posted in Uncategorized | 81 Comments

No Money Could Save Him, So He Laid Down And He Died

Posted in Uncategorized | 20 Comments

Why You Don’t Adjust Data

All large data sets contain measurement or calculation errors. Unless there is some specific reason to believe the data is skewed due to an external trend (like UHI) people normally assume the errors are random and expect them to cancel out. Many fields of science and engineering depend on this principle, including nuclear weapons design.

For example, there is just as likely to be missing temperature data in January as July, so making up fake temperatures for missing dates serves no purpose and only corrupts the data.

When climate scientists start making adjustments, confirmation bias sets in. They look for problems which cause mismatches vs. their theory, and ignore problems which would work against their theory if corrected.

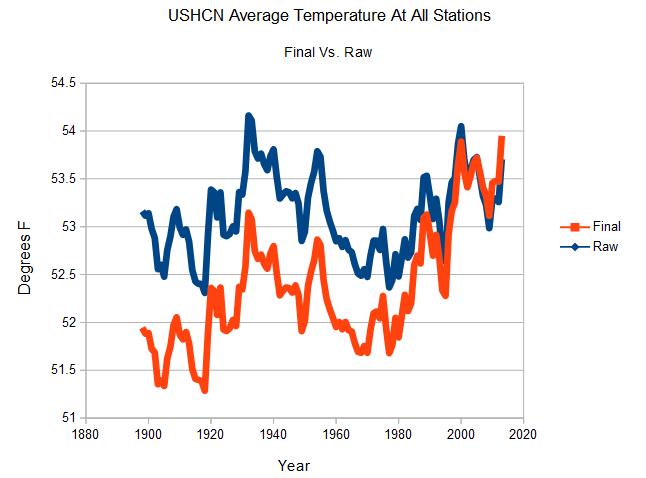
Suppose there are 20 things wrong with a data set, and scientists correct only the 10 problems which reduce warming. Even on the odd chance that the 10 corrections were done legitimately, they have completely corrupted the data set. And you end up with a mess like this.

2015-12-18-12-36-03

Posted in Uncategorized | 29 Comments

Ice-Free Arctic In Only 2,250 Years

NSIDC continues their hysterics, hinting that theArctic is crashing and doomed, due to record heat.

Screenshot 2016-03-10 at 10.26.27 AMScreenshot 2016-03-10 at 10.26.53 AM  Figure3_0301-350x270

Arctic Sea Ice News and Analysis

Scary stuff – except that the area of ice in the Arctic hasn’t changed for a decade. Decadal trend is ice-free in 2,250 years.

Screenshot 2016-03-10 at 10.24.47 AM

timeseries.anom.1979-2008

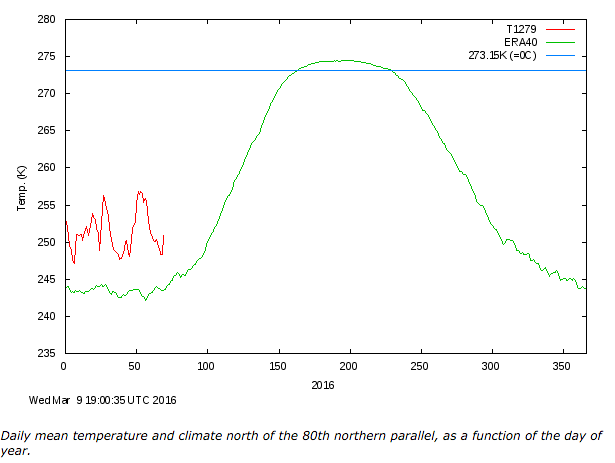
The record Arctic heat is actually about -25C.

Ocean and Ice Services | Danmarks Meteorologiske Institut

Screenshot 2016-03-10 at 10.30.46 AM

Ocean and Ice Services | Danmarks Meteorologiske Institut

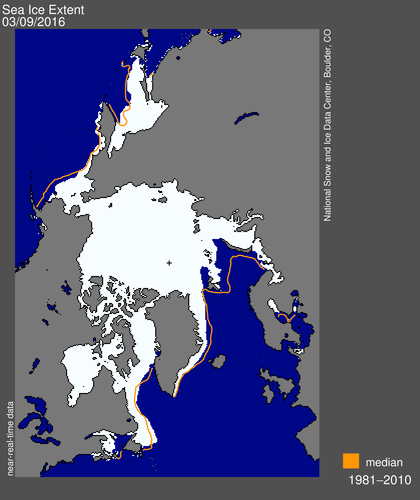
Arctic ice extent is essentially at the 30 year mean, except for the Barents Sea – where winds have been pushing the ice edge towards the pole. This is hardly cause for alarm.

N_daily_extent (4)

N_daily_extent.png (420×500)

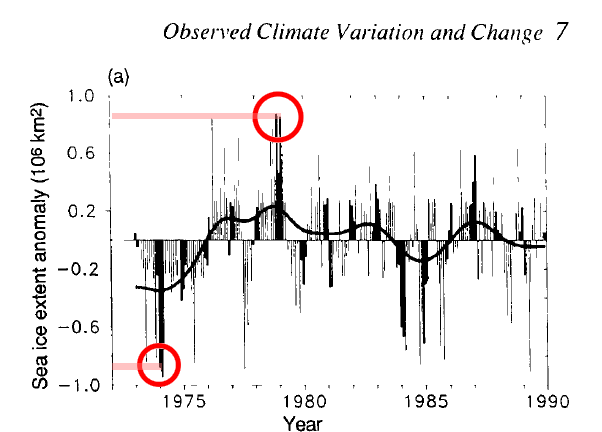
Nothing significant is changing with the Arctic climate, yet NSIDC finds a way to spin it into a disaster. And to enhance their fantasy, they ignore all pre-1979 data and start their graphs right at the 1979 peak. The graph below is from the 1990 IPCC report, and shows that ice extent was much lower earlier in the 1970’s.

PaintImage142

ScreenHunter_10756 Oct. 10 12.21

1990 IPCC : Chapter 7

Posted in Uncategorized | 47 Comments

NOAA Hockey In North Dakota

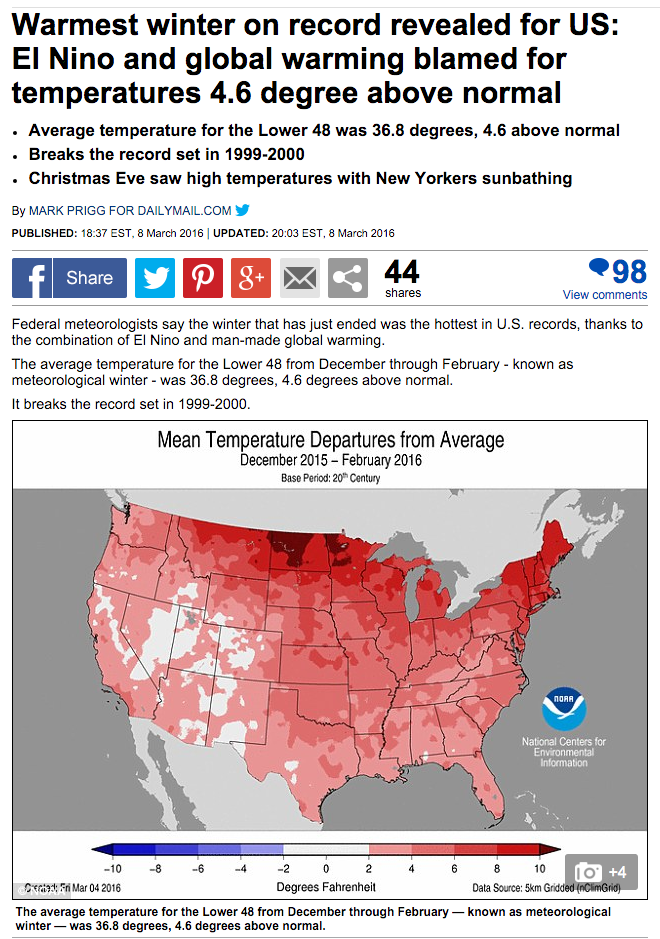
NOAA created a fake hottest winter ever through an impressive hockey stick of data tampering, but nowhere more so than North Dakota.

Screenshot 2016-03-09 at 03.01.59 PM

global warming blamed for temperatures 4.6 degree above normal 

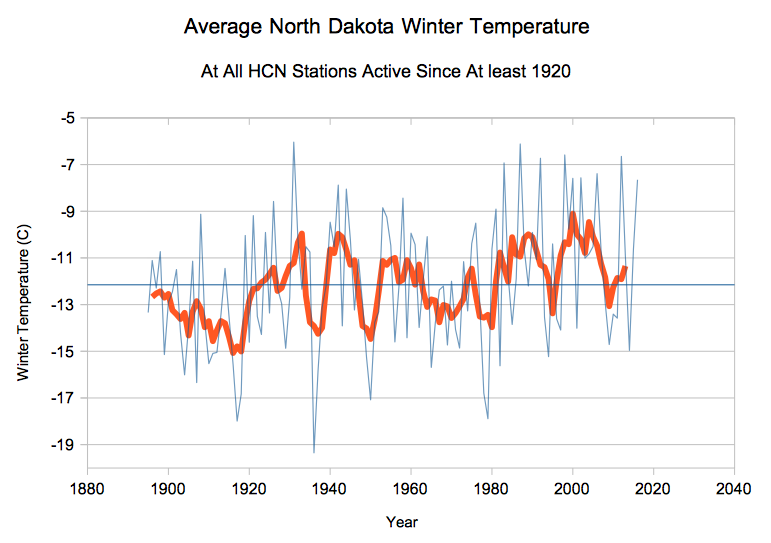
This past winter was tenth warmest in North Dakota, nearly 2C cooler than 1931. Two years ago was one of their coldest winters on record.

Screenshot 2016-03-10 at 09.17.35 AM

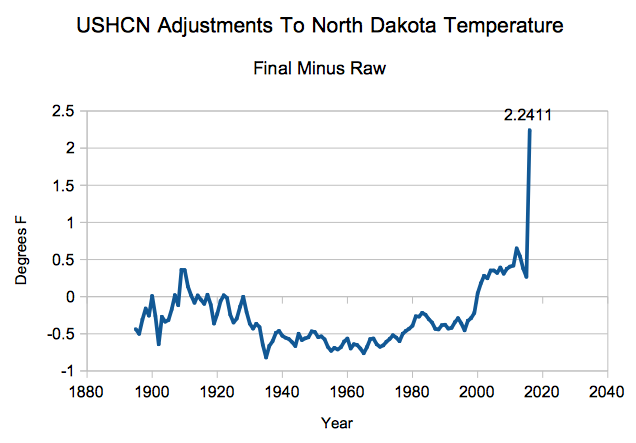
NOAA created the hottest winter ever, by adding more than two degrees F on to 2016 temperatures, and subtracting  -0.4F from 1931.

Screenshot 2016-03-10 at 07.04.50 AM

Threatened by funding loss after the next election, NOAA is massively ramping up their hockey game.  More updates on this soon.

Posted in Uncategorized | 26 Comments

Scientists Grant Earth Another Reprieve!

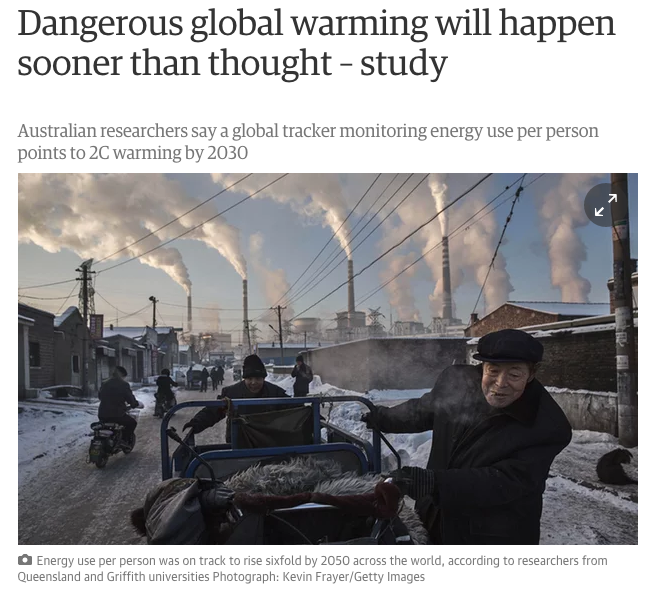
Scientists predict 2C warming by 2030, sooner than expected!

Screenshot 2016-03-09 at 05.31.18 PM

Dangerous global warming will happen sooner than thought 

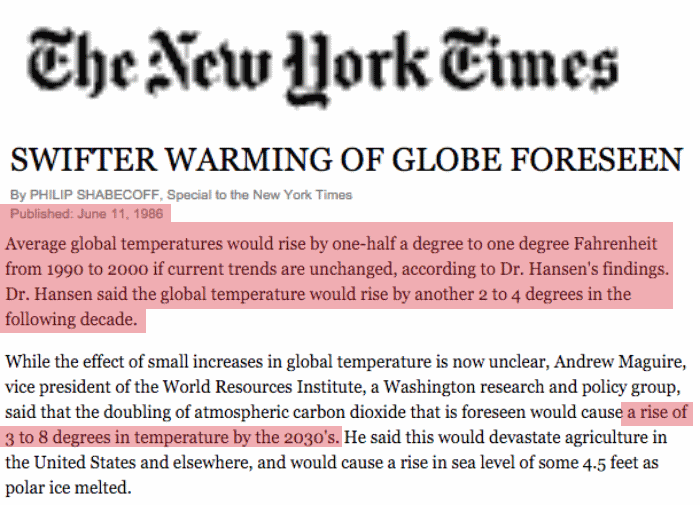
This is very good news – because they previously thought that much warming would occur by 2010, and nearly 5C by 2030.

Screenshot 2016-03-09 at 06.42.24 PM-down

SWIFTER WARMING OF GLOBE FORESEEN – NYTimes.com

For climate scientists, 2030 is sooner than 2010.

Posted in Uncategorized | 12 Comments

All Things Are Possible – With Data Tampering

NOAA claims that the past winter was warmest on record in the US

Screenshot 2016-03-09 at 03.01.59 PM

global warming blamed for temperatures 4.6 degree above normal 

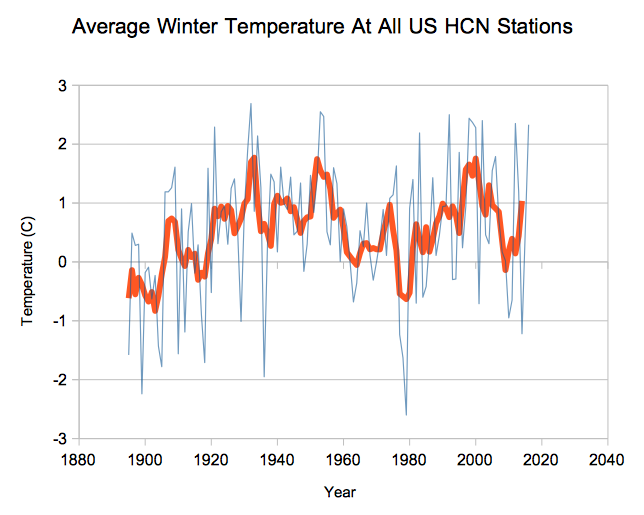
As always, their claims are based on massively tampered data. The thermometers which they use show that this winter was ninth warmest, with the warmest winter being 1932. There has been no trend over the past century.

Screenshot 2016-03-09 at 03.03.10 PM

They create their record temperatures by massively cooling the past. They cool 1932 by a full degree, and then make fake press releases and maps to push the fake global warming agenda.

2015-12-18-12-36-03

Posted in Uncategorized | 11 Comments

I’ve Heard It All Before ….

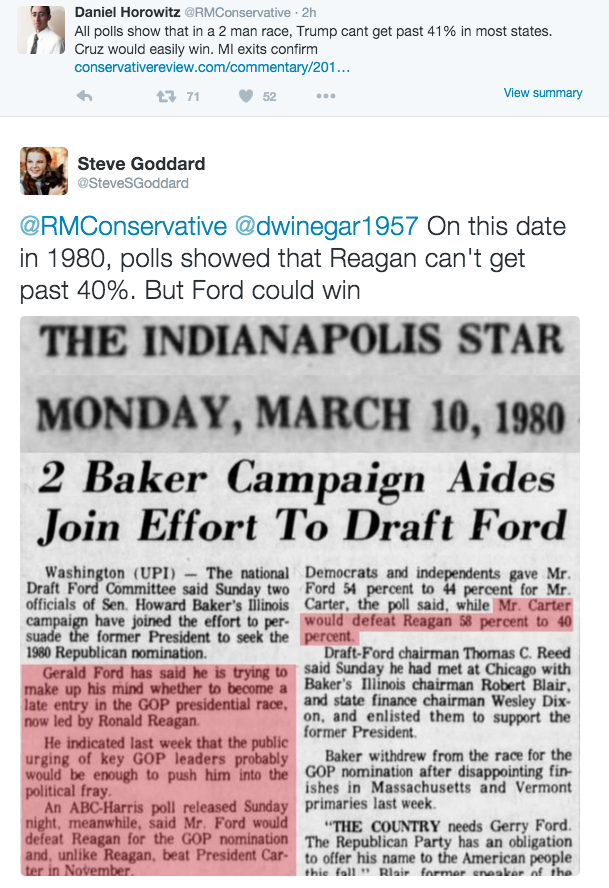
I remember March, 1980 very well. The GOP hated Reagan. They said he didn’t have a chance to defeat Carter. He was going to start WWIII. He was going to destroy the environment. The GOP was desperate to dump him, and tried to draft Gerald Ford.

Screenshot 2016-03-09 at 07.27.32 AM

10 Mar 1980, Page 5 – at Newspapers.com

Screenshot 2016-02-24 at 04.59.24 AM-down

14 Mar 1980, Page 70 – at Newspapers.com

Posted in Uncategorized | 61 Comments

NOAA Temperature Adjustments Invert Reality


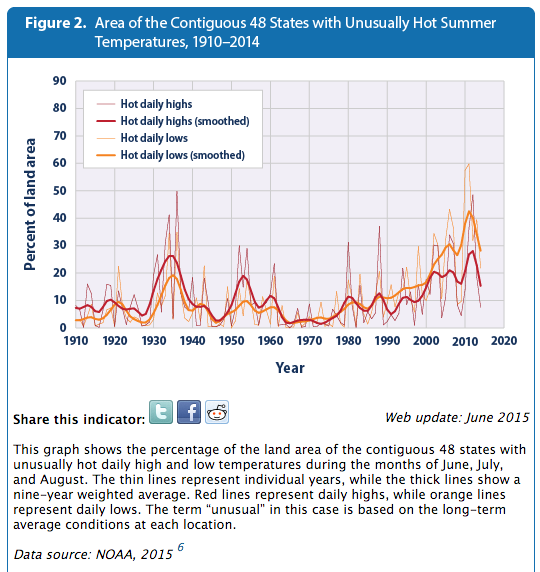
The EPA graph below is based on NOAA adjusted data, and shows that the area of the US affected by hot summer temperatures has increased to record levels.

Screenshot 2016-03-08 at 12.54.23 PM High and Low Temperatures | Climate Change | US EPA

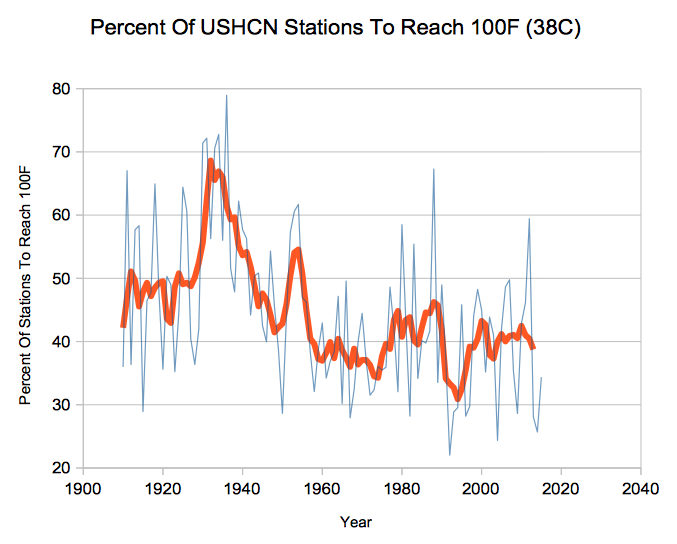
Actual thermometer data shows the exact opposite. The percentage of US stations to reach 100F has plummeted since the 1930’s.  This metric should not be affected by any of the published USHCN adjustments.

Screenshot 2016-03-08 at 01.03.27 PM

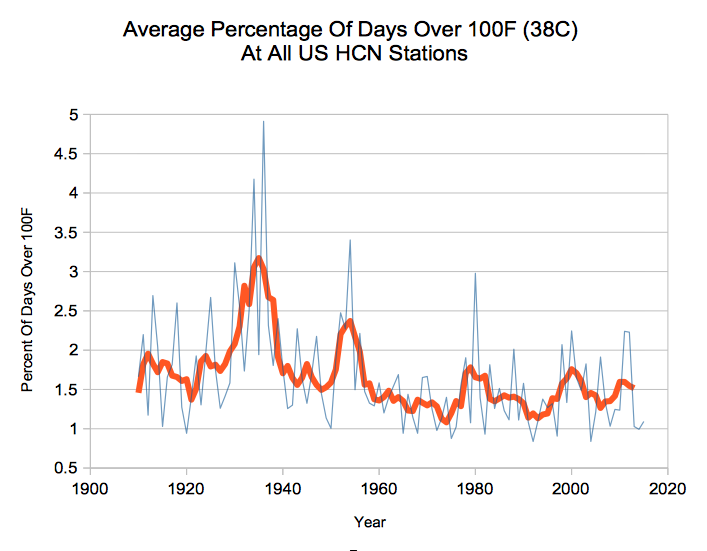
The frequency of 100 degree days has also plummeted.

Screenshot 2016-03-08 at 01.17.40 PM

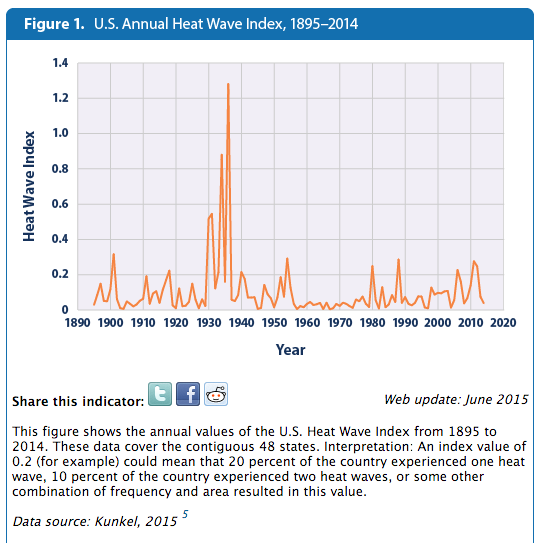
The EPA’s own data shows that heatwaves were much worse in the 1930’s.

Screenshot 2016-03-08 at 01.10.08 PM

High and Low Temperatures | Climate Change | US EPA

The bogus top graph is the result of people tampering with data, and then actually believing the bogus data they generated. The NOAA Climate Extremes Index is junk science.

Posted in Uncategorized | 30 Comments