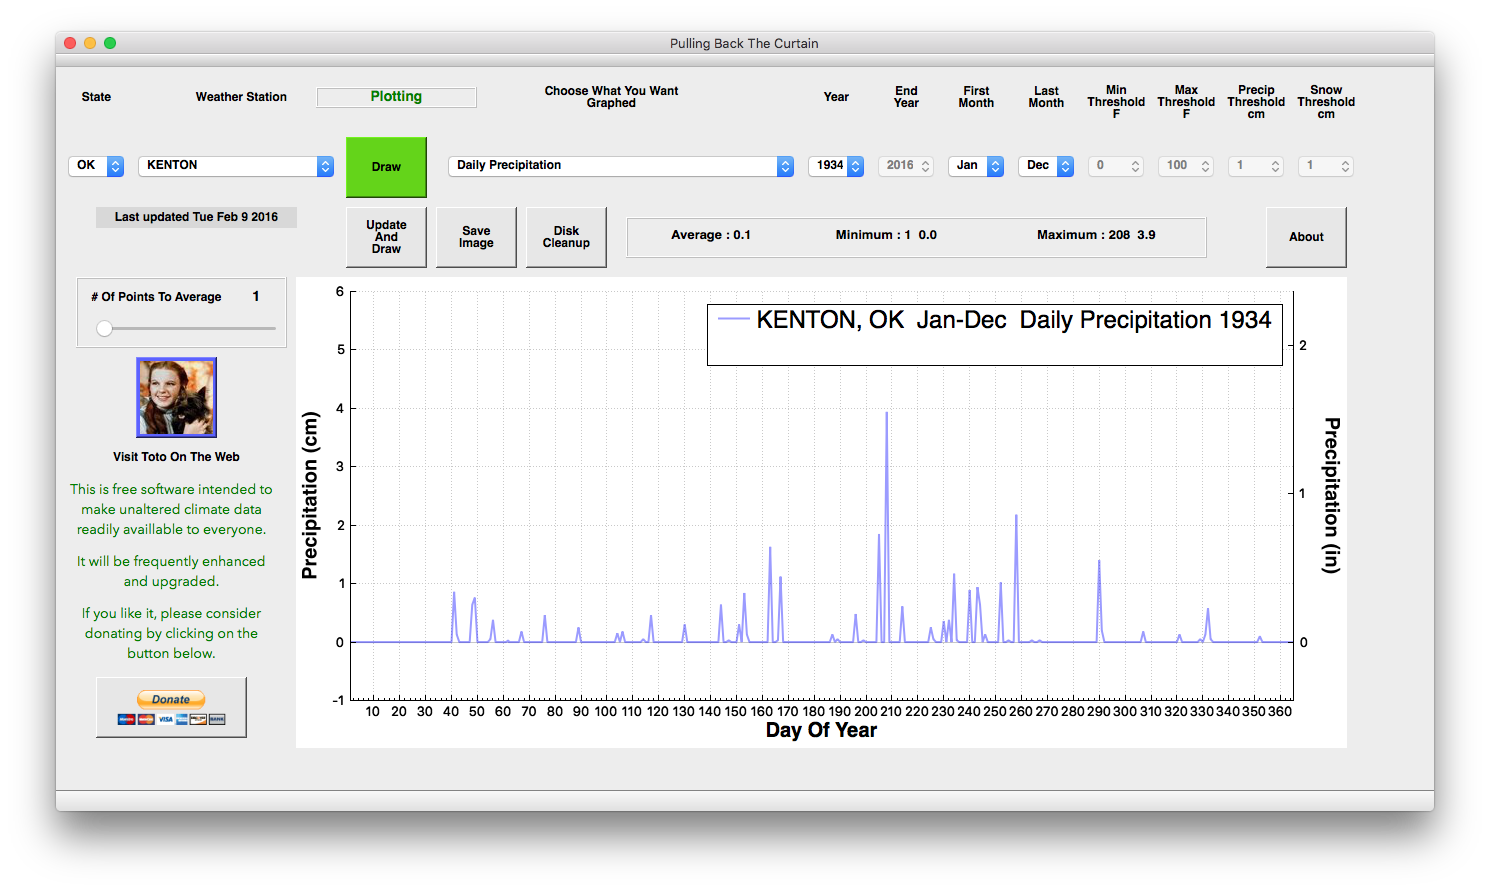
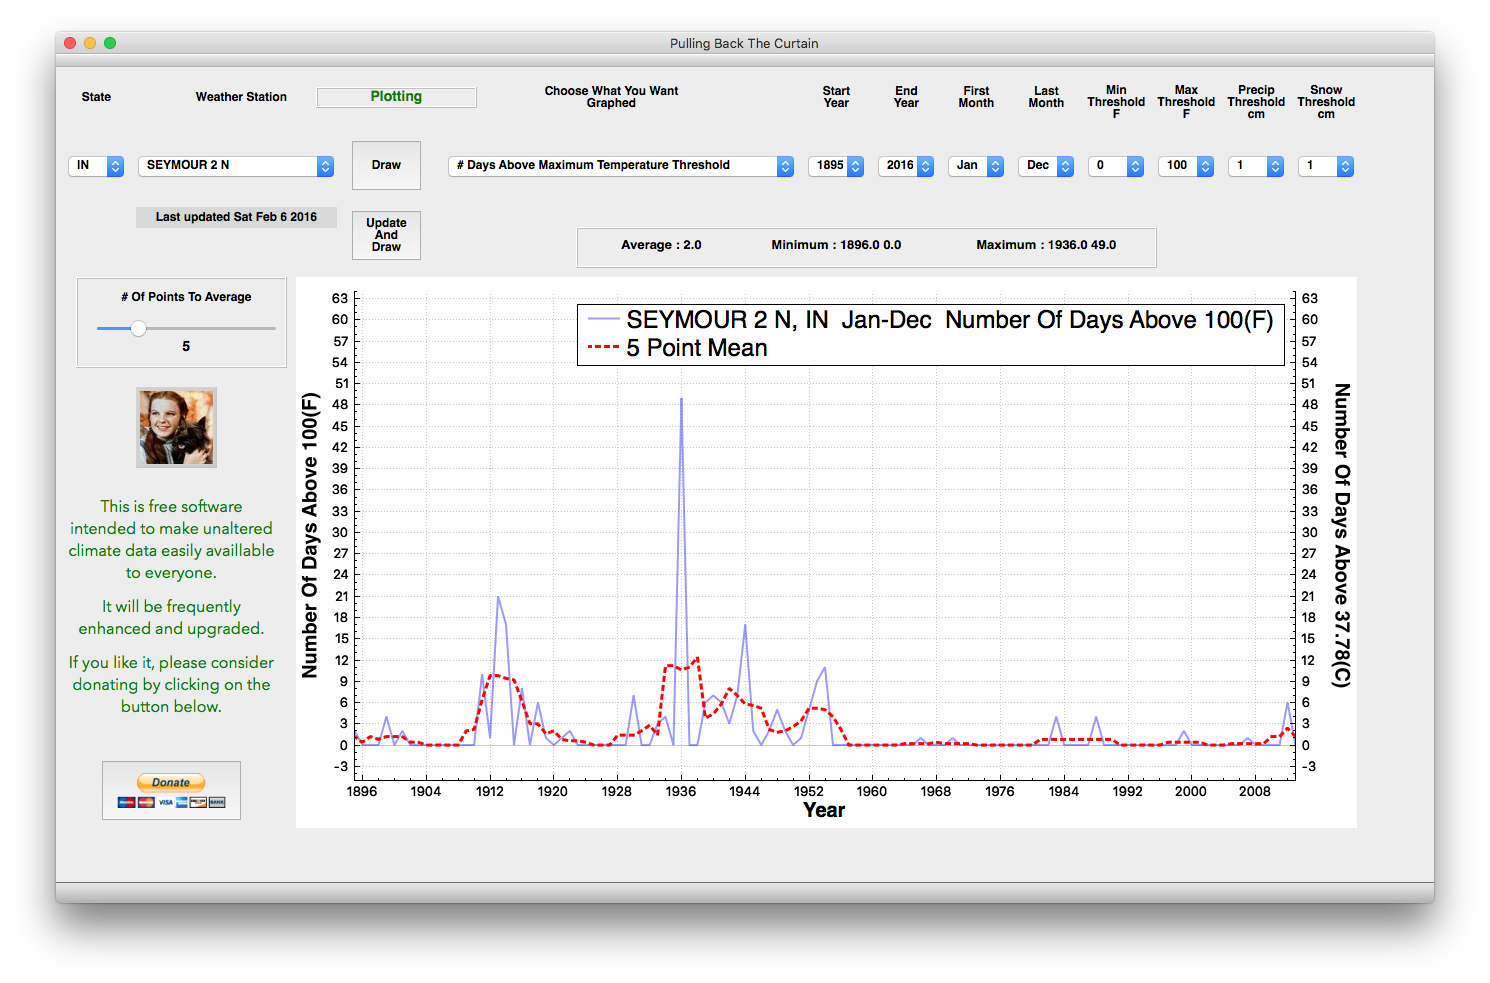
As promised, there is a new release of Pulling back the curtain, with some new features. It now plots daily precipitation, daily snowfall and consecutive days below the minimum threshold.
This will open up a new tab on Dropbox. Click on the Download button. That will download a zip file, which you will have to extract. Once extracted, navigate to that directory, enter it, and click on PullingBackTheCurtain.exe
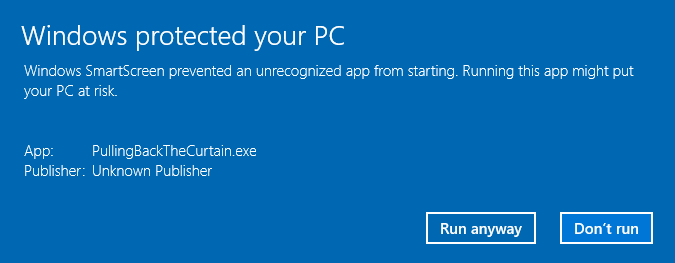
This may bring up a warning from Windows. Click on show more
If you click on Run anyway, the program will start. The program is virus/malware free.
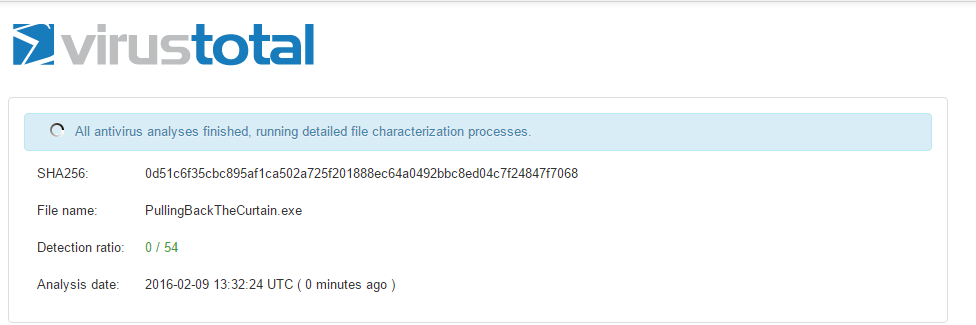
If you are concerned, you can test it yourself by uploading PullingBackTheCurtain.exe to https://www.virustotal.com/.
[TH : I moved the links to a secure https address, as some people seemed to be picking up malware on the download. The executable itself is clean.]
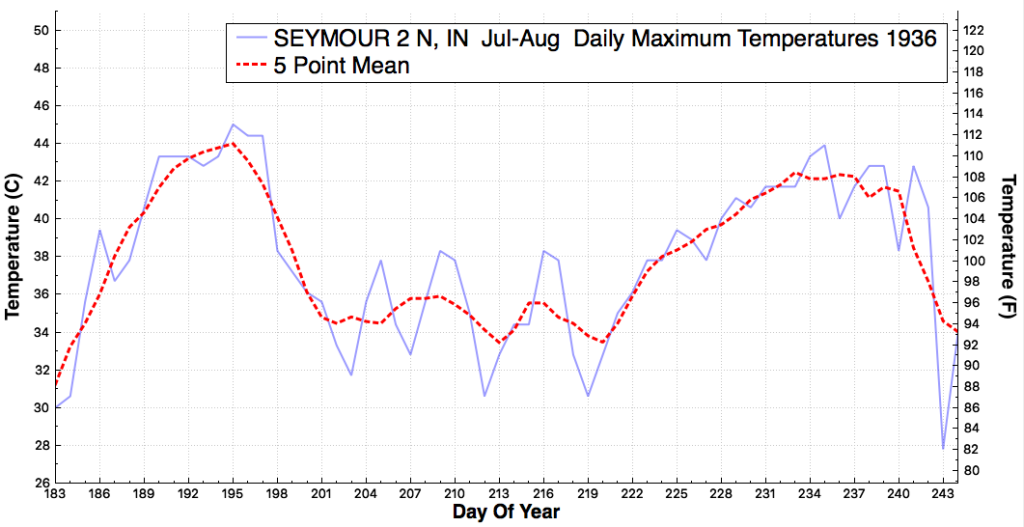
I know that people are excited today about the big game between Real Madrid and Granada, but I have even more exciting news. Everyone now has the ability to do the same analysis of climate data which I have been doing. You can download it here. Download the PullingBackTheCurtain .zip file, unzip it, enter the PullingBackTheCurtain directory, and click on PullingBackTheCurtain.exe to run.
Current version is only for Windows. It also runs on Mac and Linux, but I haven’t figured out how to distribute the executable for those platforms yet.
The current version is only for the US. A new version will be coming out shortly which will allow you to add whatever global stations you want.
The screen size and shape is designed to fit any PC, laptop or tablet screen.
I will be adding lots more features in future releases, but think you will find this version very useful. It is completely free, and free from any malware, spyware or anything else evil. The data is downloaded directly from NOAA, so you have to be connected to the Internet every time you want to get a new station. You can suck up a lot of disk space with these files, so there is a Disk Cleanup button.
When you save an image, it also copies the image to the clipboard – so you can paste it directly into a tweet or E-mail.
No big government, big oil, big tobacco or big coal funding goes into any of my efforts. It took years of development to get to this point, so if you feel inclined there is a donate button on the lower left. Please specify that your donation is a response to this software.
Everything is very intuitive, but if you have any questions I will either answer them or forward them to my dogs.
Time to go for a bike ride and then come back and watch the big match in Granada!
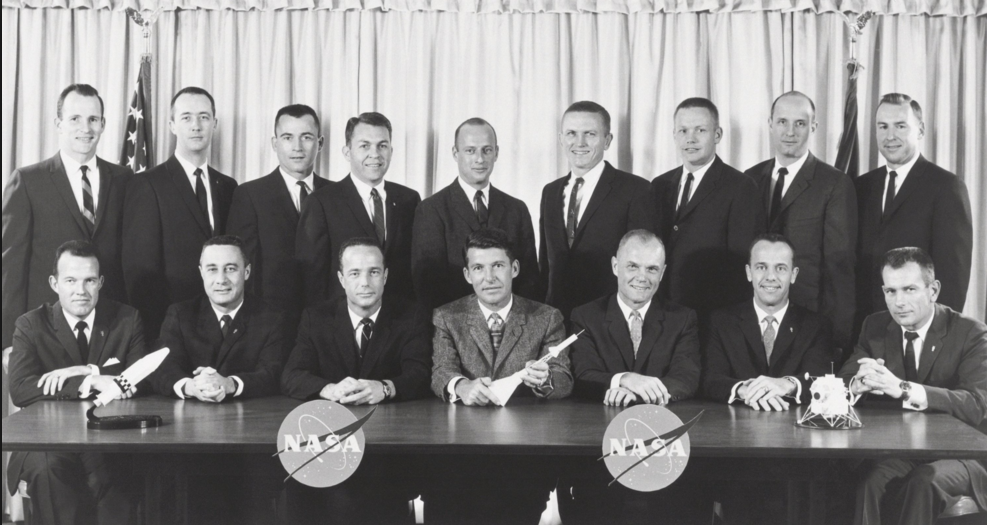
Four years ago, the people with The Right Stuff sent this letter to NASA satellite deniers James Hansen and Gavin Schmidt, who are completely destroying the agency’s reputation with their junk science.
March 28, 2012
The Honorable Charles Bolden, Jr.
NASA Administrator
NASA Headquarters
Washington, D.C. 20546-0001
Dear Charlie,
We, the undersigned, respectfully request that NASA and the Goddard Institute for Space Studies (GISS) refrain from including unproven remarks in public releases and websites. We believe the claims by NASA and GISS, that man-made carbon dioxide is having a catastrophic impact on global climate change are not substantiated, especially when considering thousands of years of empirical data. With hundreds of well-known climate scientists and tens of thousands of other scientists publicly declaring their disbelief in the catastrophic forecasts, coming particularly from the GISS leadership, it is clear that the science is NOT settled.
The unbridled advocacy of CO2 being the major cause of climate change is unbecoming of NASA’s history of making an objective assessment of all available scientific data prior to making decisions or public statements.
As former NASA employees, we feel that NASA’s advocacy of an extreme position, prior to a thorough study of the possible overwhelming impact of natural climate drivers is inappropriate. We request that NASA refrain from including unproven and unsupported remarks in its future releases and websites on this subject. At risk is damage to the exemplary reputation of NASA, NASA’s current or former scientists and employees, and even the reputation of science itself.
For additional information regarding the science behind our concern, we recommend that you contact Harrison Schmitt or Walter Cunningham, or others they can recommend to you.
Thank you for considering this request.
Sincerely,
(Attached signatures)
CC: Mr. John Grunsfeld, Associate Administrator for Science
CC: Ass Mr. Chris Scolese, Director, Goddard Space Flight Center
/s/ Jack Barneburg, Jack – JSC, Space Shuttle Structures, Engineering Directorate, 34 years
/s/ Larry Bell – JSC, Mgr. Crew Systems Div., Engineering Directorate, 32 years
/s/ Dr. Donald Bogard – JSC, Principal Investigator, Science Directorate, 41 years
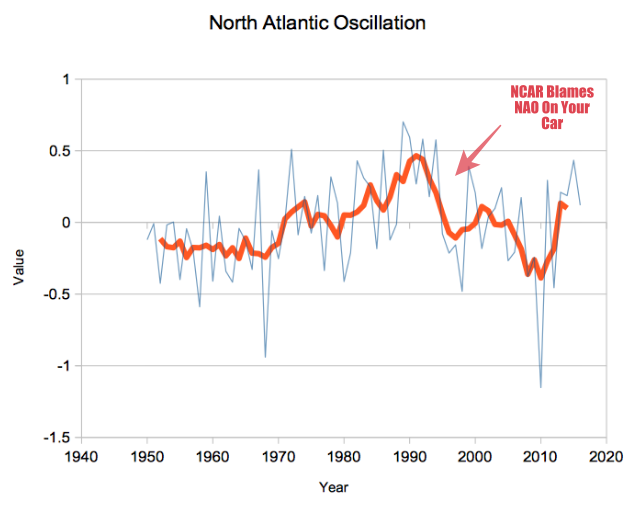
The National Center For Atmospheric Research in Boulder, Colorado has this 15 year old “educational” video in their lobby, blaming the rise in the North Atlantic Oscillation on your car. The video also says that the NAO is the primary driver of climate in the Northern Hemisphere.
At the time they made the video, the NAO had already started a twenty year decline, which brought it to its lowest levels on record by 2010. Utterly clueless science.
Climate scientists constantly blame phenomena on CO2, without the slightest evidence other than some short term correlation cherry-picked from one leg of a cycle.
A few weeks ago, climate criminal Michael Mann (who knows nothing about the subject) said that satellite temperatures are not as reliable as surface temperatures.
According to Dr. Michael Mann (Penn State), the satellite temperature record has actually been subject to more adjustments than the surface record. Mann also states that the global satellite temperature record has been shown to have a bias of showing too little warming.
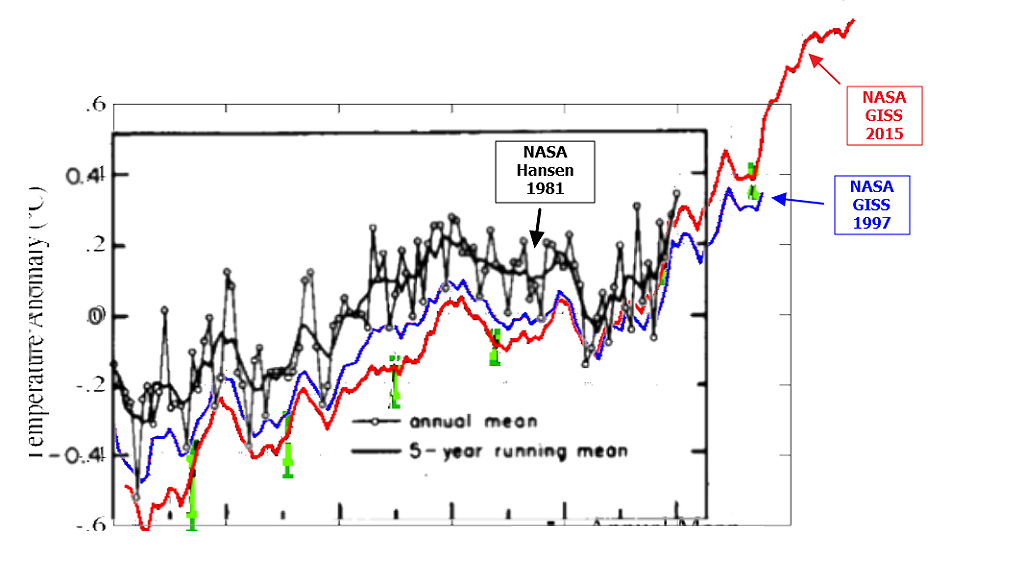
NASA has doubled 1880-2000 warming since 2001 by eliminating rural stations and homogenizing UHI infected urban stations.
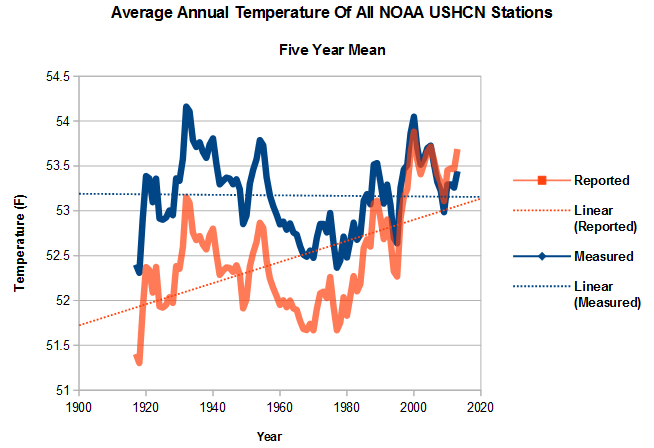
The entire US warming trend over the past century is due to adjustments.
Dr. John Christy of the University of Alabama at Huntsville is an actual expert on satellite temperatures, and he pulverized Mann’s fraud in Congress this week.
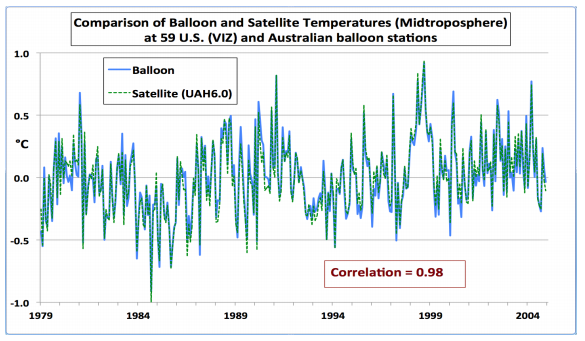
First, the claim is made the satellites do not measure temperature. In reality, the sensors on satellites measure temperature by emitted radiation – the same method that a physician uses to measure your body temperature to high precision using an ear probe. Atmospheric oxygen emits microwaves, the intensity of which is directly proportional to the temperature of the oxygen, and thus the atmosphere. That the satellites measure temperature is evident by the following chart which compares our UAH satellite data with temperatures calculated from balloon thermistors. As an aside, most surface temperature measurements are indirect, using electronic resistance.
Michael Mann has been shown over and over again to be an embarrassment to the profession, but he says the things that progressives want to hear. So they listen to him and ignore actual scientists.


