Middlesboro Daily News – Google News Archive Search

President Obama tells us that 97% of scientists believe that America’s carbon sins will lead to hell fire, a great flood, famines and pestilence – unless everyone believes in climate change, pays their tithes and repents of their carbon sins.
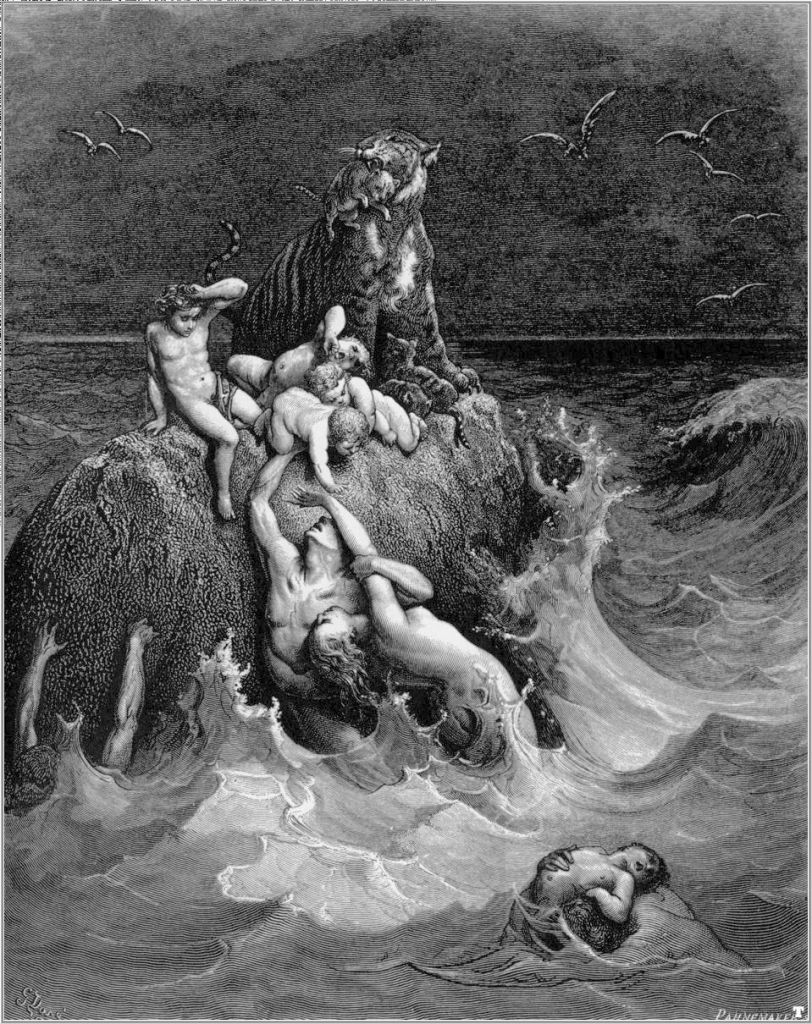
He simultaneously ridicules people who believe Biblical stories about man’s sin causing hell fire, a great flood, famines and pestilence.
NOAA has 16 USHCN stations in Maryland, but they have stopped collecting data from all but four of them. One of the disappearing stations is at Laurel, which has been collecting since 1895 – but no data reported since August 2015.
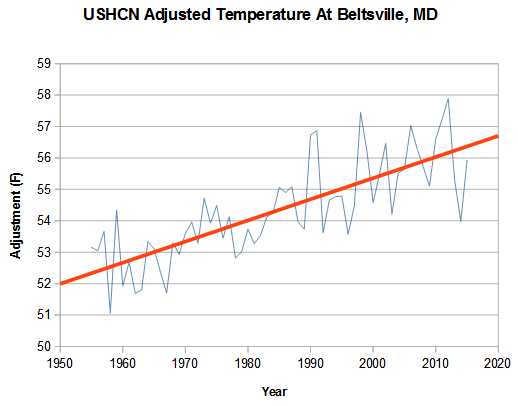
Laurel raw data shows no warming over the past 60 years, but Beltsville (at I-95 and The Beltway) is five miles closer to Washington DC and shows two degrees warming during that period as the city has expanded. Beltsville is one of the four stations still reporting.
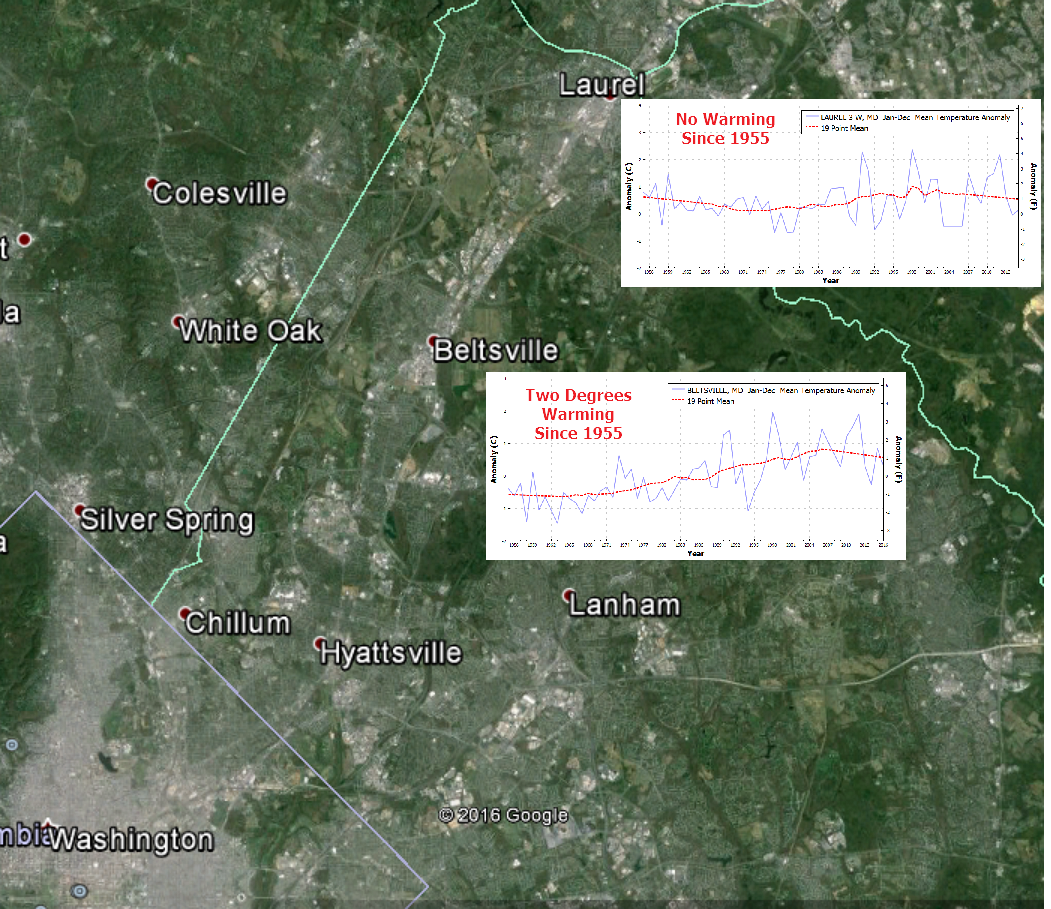
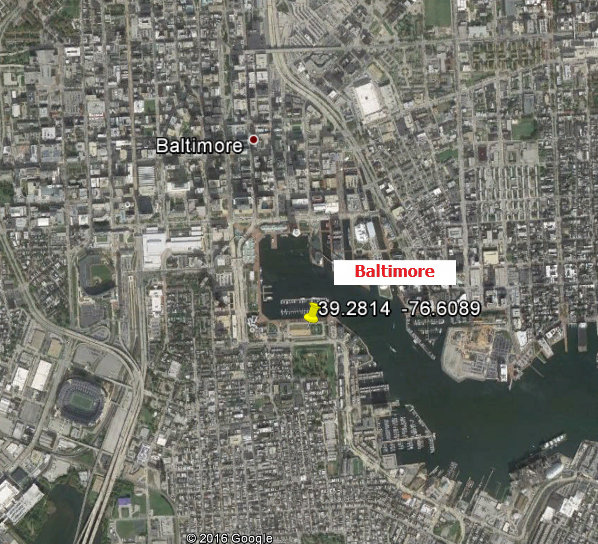
The fact that 75% of the stations in Maryland are missing doesn’t stop NOAA from fabricating temperatures for the 12 missing ones. Laurel is located midway between Washington DC and Baltimore, where another one of the four active stations is located.
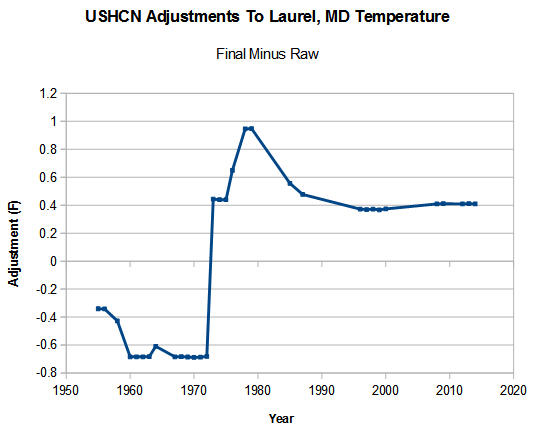
NOAA generates the fake Laurel temperature data by interpolating from the neighboring stations, which in this case would be UHI infected Beltsville and Baltimore. The graph below shows how Laurel temperatures are adjusted by USHCN. They cool pre-1975 temperatures and warm post-1975 temperatures. The exact opposite of what would be expected.
But here is where the NOAA fraud really gets ugly. Beltsville raw temperatures have warmed two degrees over the last 60 years due to Urban Heat Island effects. But instead of adjusting recent temperatures downwards to compensate, they do the exact opposite and massively cool the past.
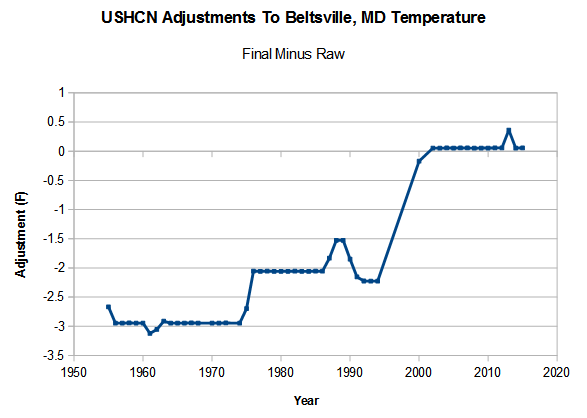
The final temperature graph for Beltsville shows almost five degrees warming over the past 60 years, when in fact there has been none.
This level of fraud defies explanation, but is standard operating procedure at NOAA and NASA.
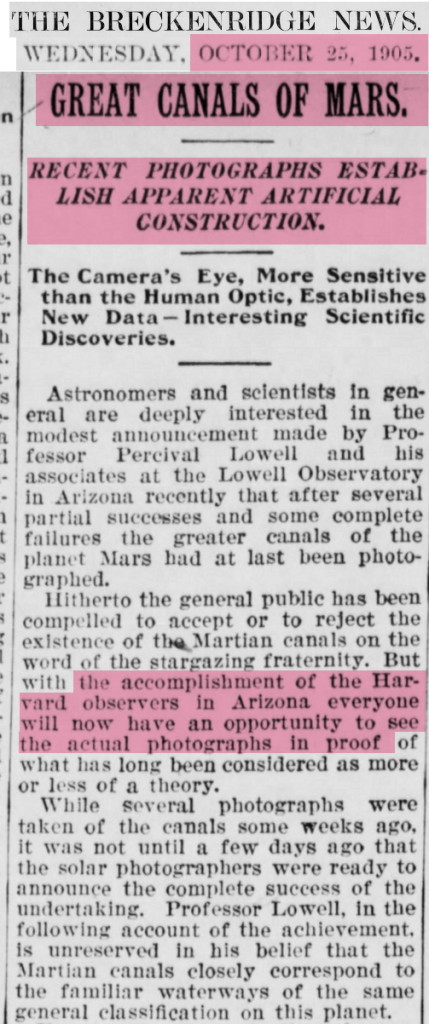
Advances in technology in 1905, allowed scientists to prove their favorite brainless theory of the time.
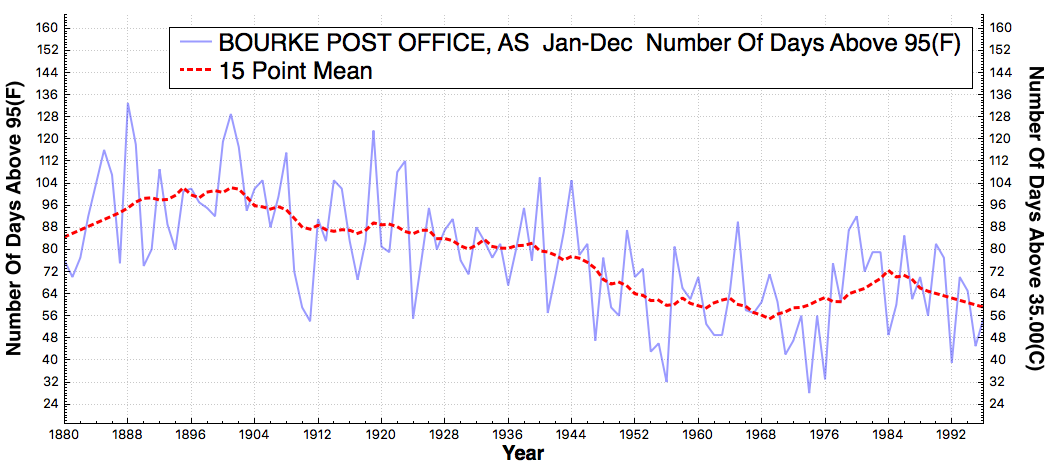
The frequency of very hot days in New South Wales has dropped off sharply since the 19th century. During January 1896, Bourke had 18 days over 110F (43C)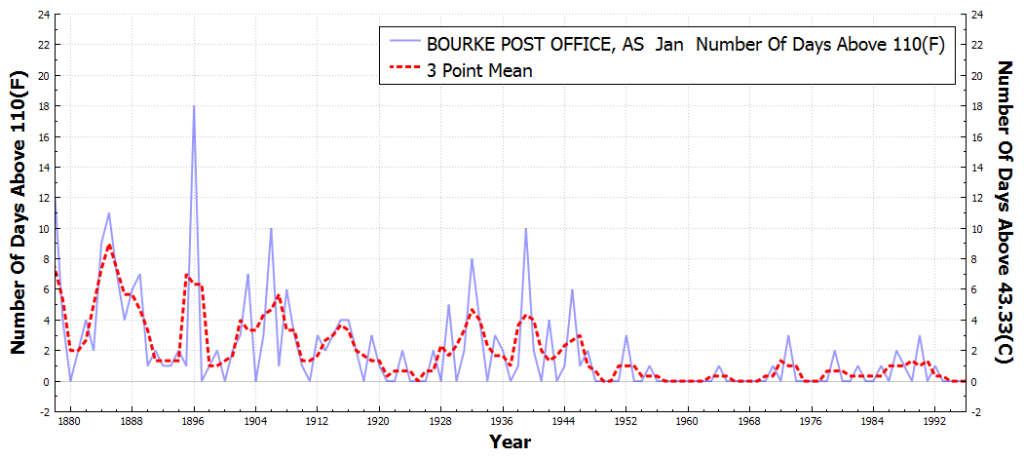
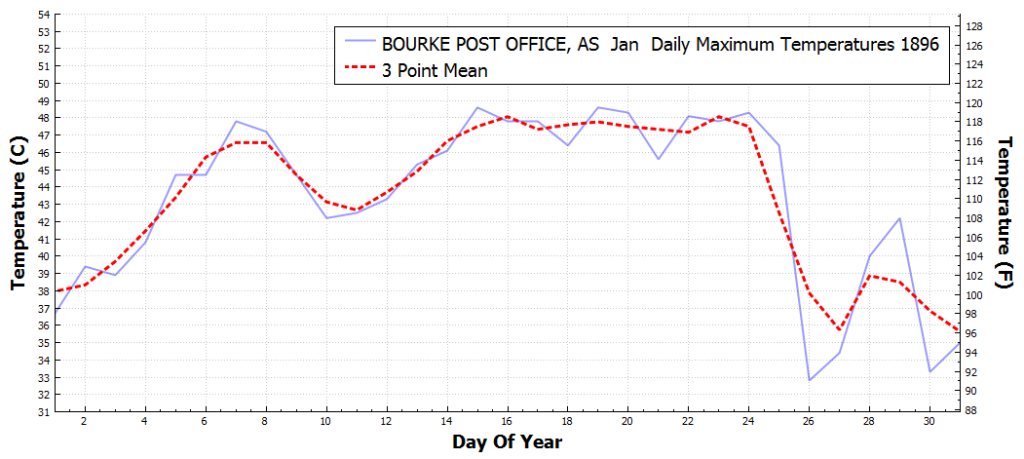
The graph below shows the daily maximum temperatures at Bourke during that month, which peaked at almost 49C.
During the very hot summer of 1988, James Hansen sabotaged the air conditioning and told Congress that hot summer days were the new normal. It was the ultimate junk science cherry-pick of an outlier during a downward trend.

The second place award for junk science cherry picking goes to Katharine Hayhoe and Andrew Dessler, who pulled the same stunt in Texas during the summer of 2011.
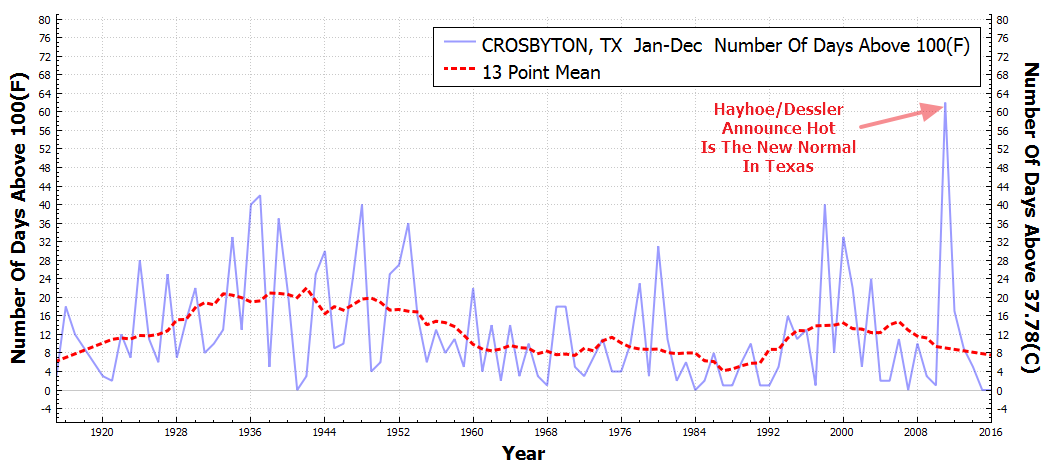
Climate scientists don’t do anything even vaguely related to science. Their job is to keep the money flowing by making unsupported claims which politicians want to hear.
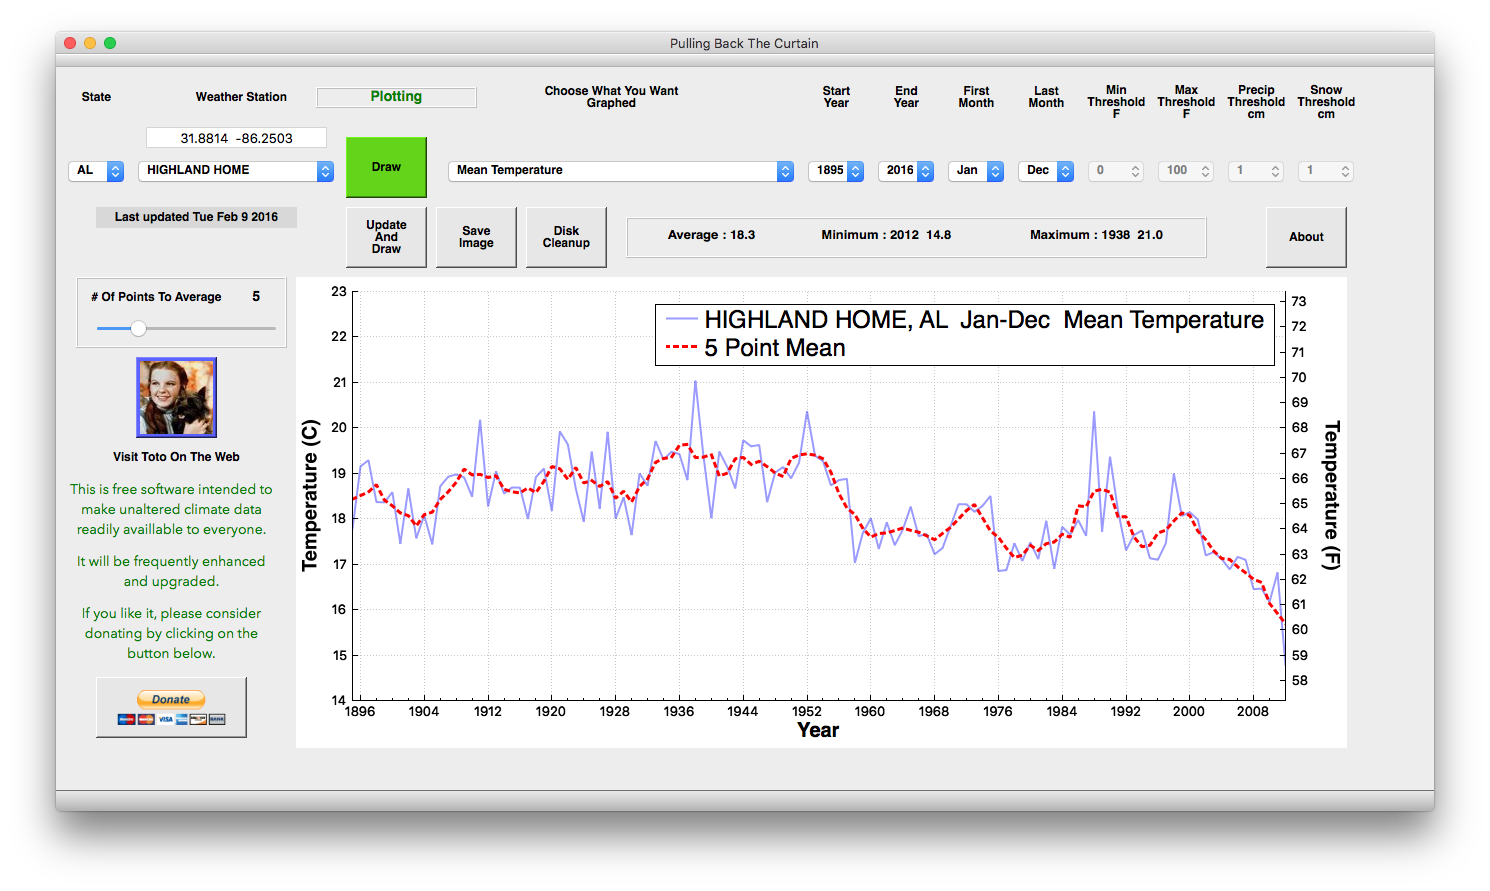
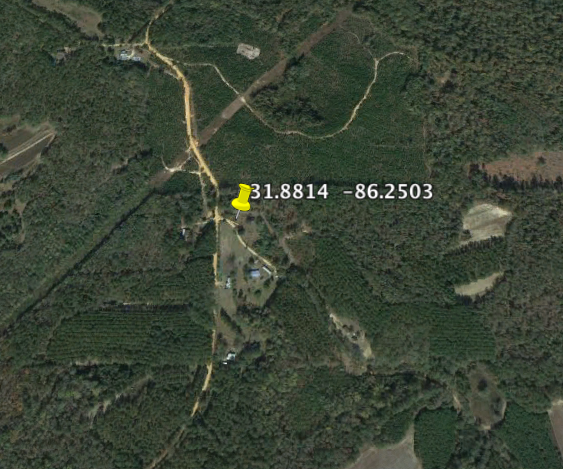
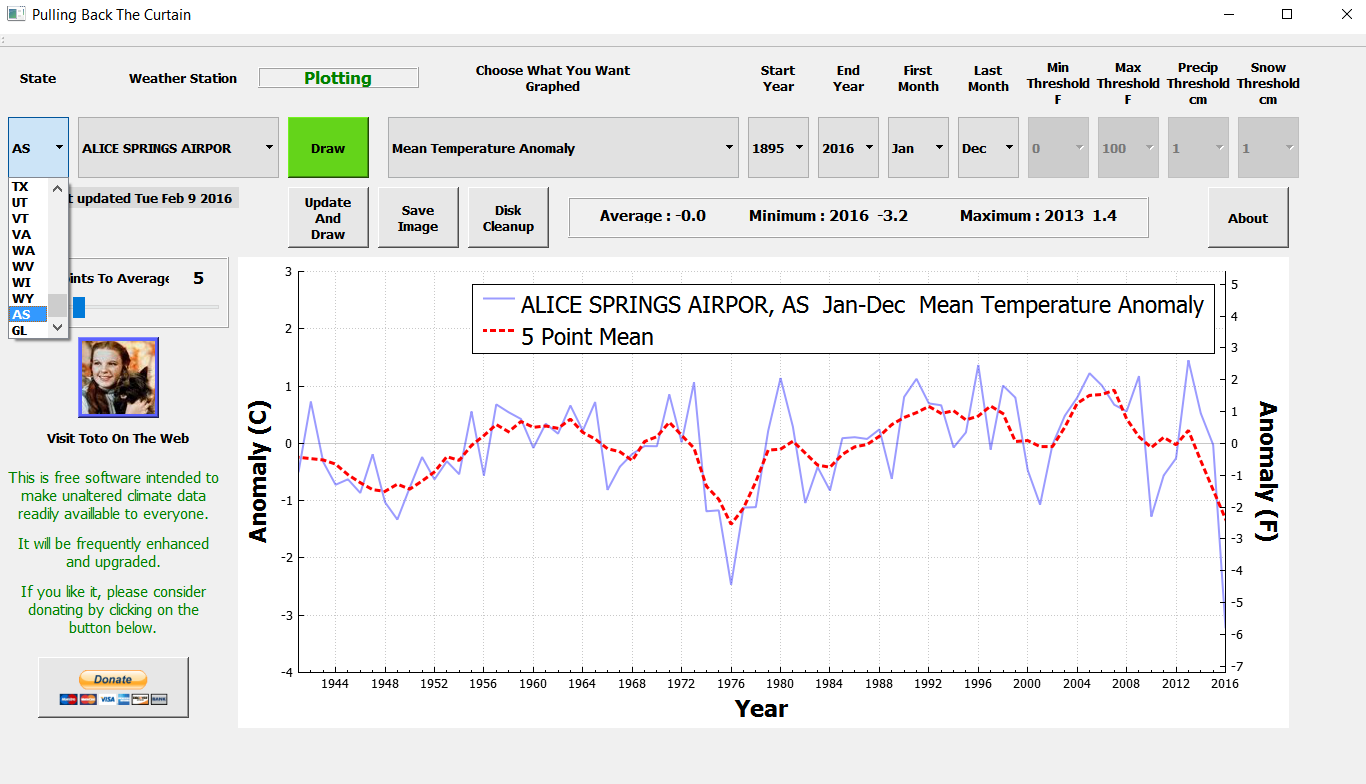
Release 1.3 adds a very important feature. Above the station name is the latitude/longitude which you can copy and paste into Google Earth, and then see exactly where the station is located.
Highland Home, Alabama shows a strong cooling trend. It is also a very rural station.
Download : PullingBackTheCurtain v1.3
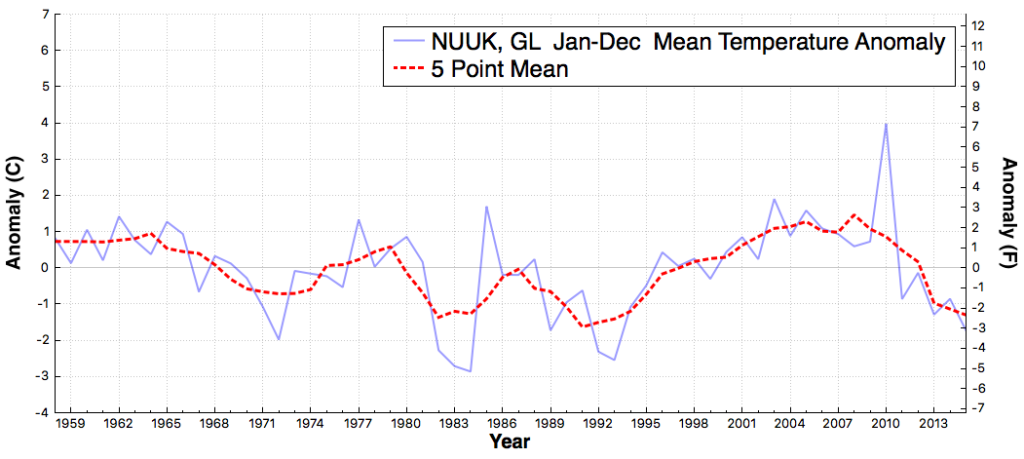
V1.3 also adds Greenland stations.
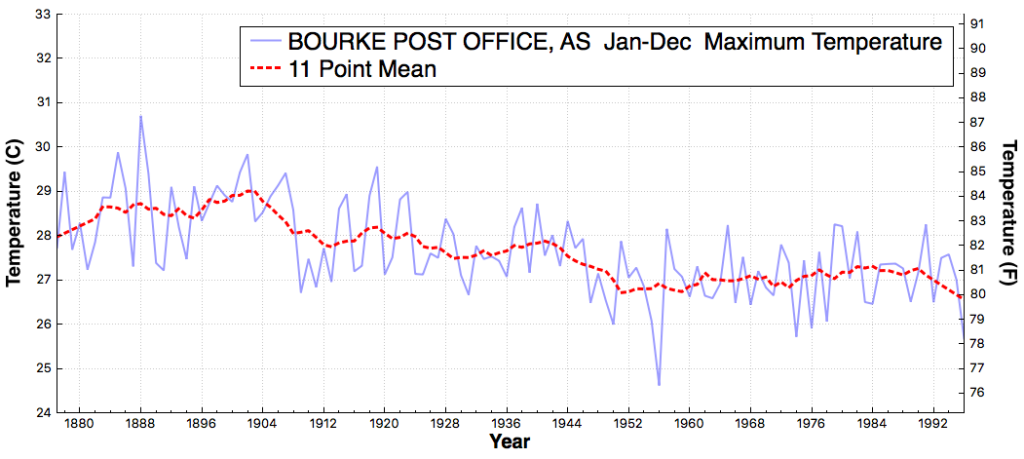
The Sydney Observatory shows several degrees warming since the 1940s.
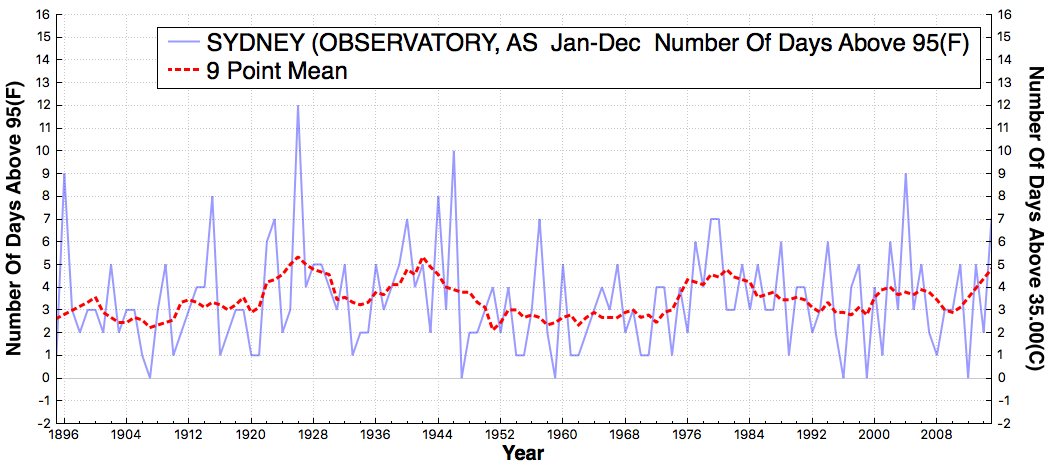
It is carefully situated next to a couple dozen lanes of asphalt, with a tall building reflecting the afternoon sun on to the thermometer.
Despite all of this, there has been no increase in the frequency of hot afternoons, which peaked in 1926.
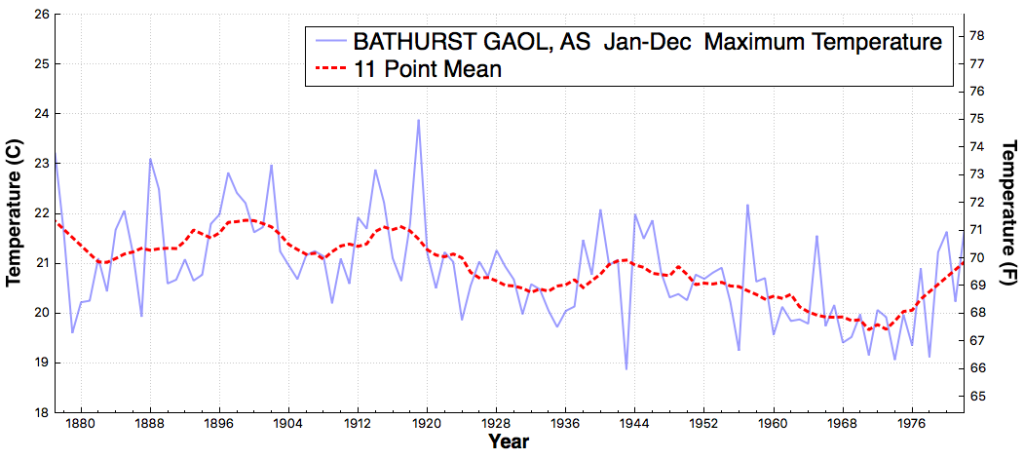
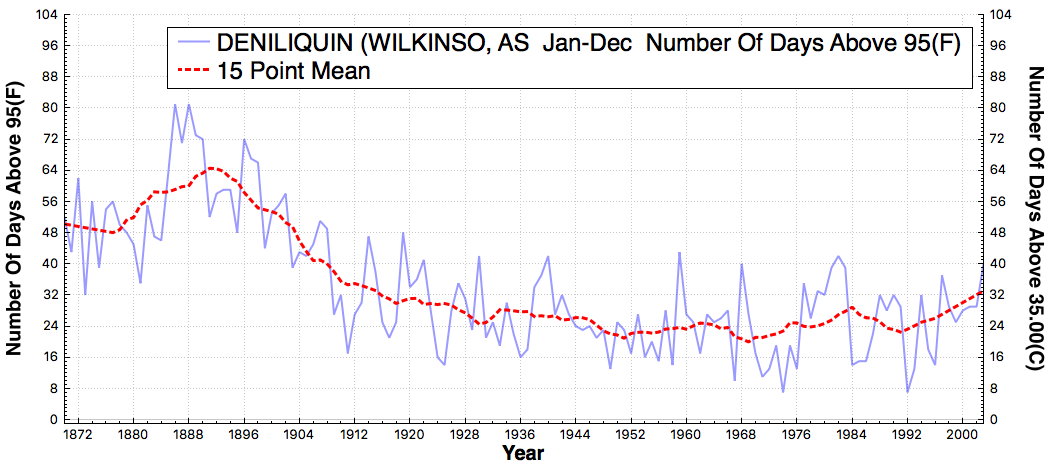
Rural stations in New South Wales show a sharp decline in the frequency of hot afternoons.
Government climate scientists prefer surface temperatures over satellites, because they can manipulate the station selection and give them the answer they are looking for.
Select AS for the state selection (below WY) and more than 1,000 Australian stations will appear.
Download : PullingBackTheCurtain version 1.2