
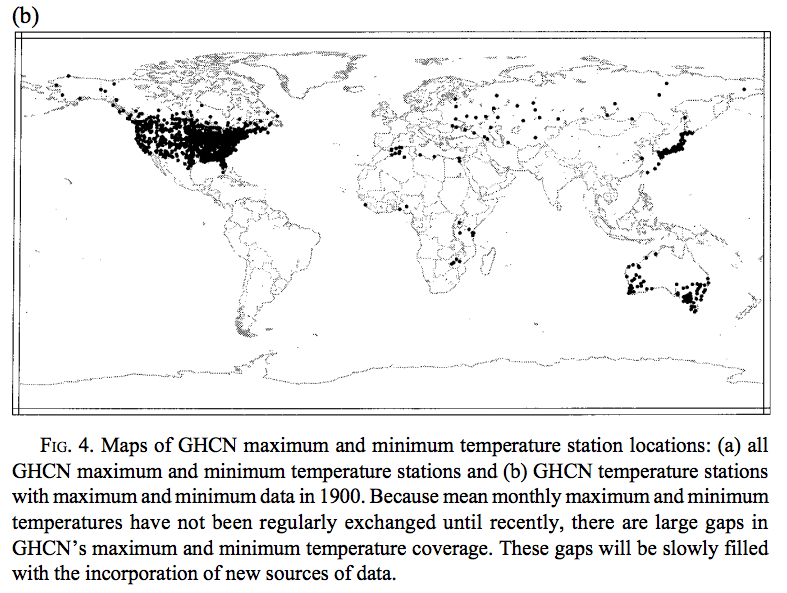
NOAA has no idea what historical temperatures are. In 1900, almost all of their global min/max temperature data was from the US.
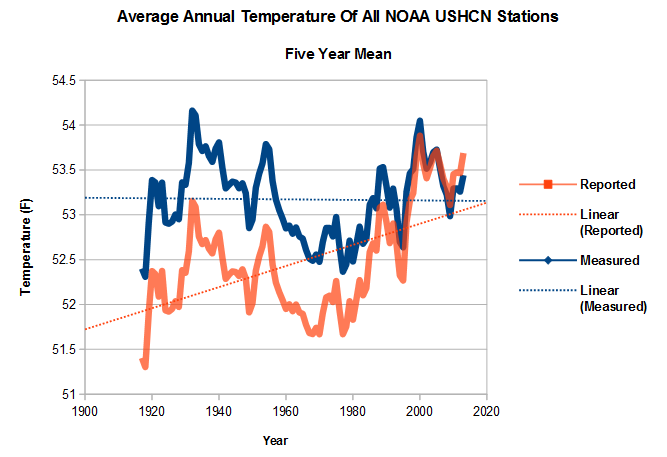
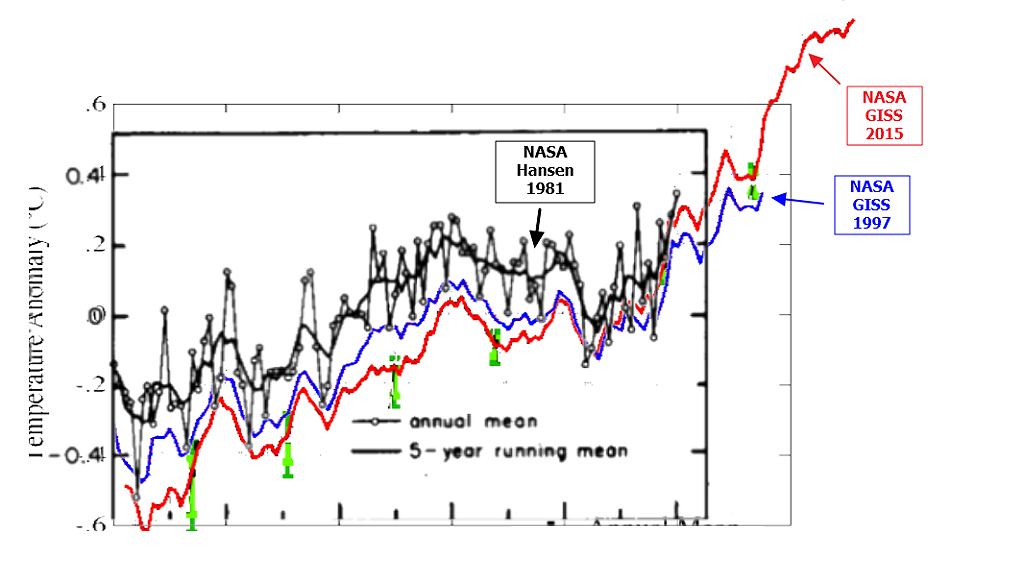
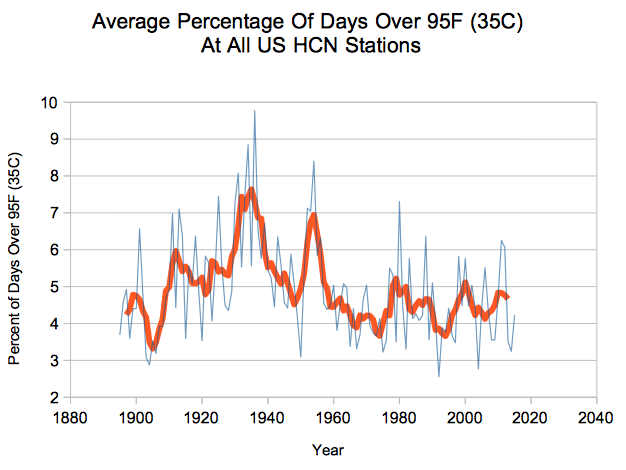
Their only good data, the US temperature data, is then massively altered to cool the past.
But their fraud is even worse than it seems. Since the 1970s, they have been losing station data at a phenomenal rate.
NOAA have continued to lose data, and now have fewer stations than they did 100 years ago.
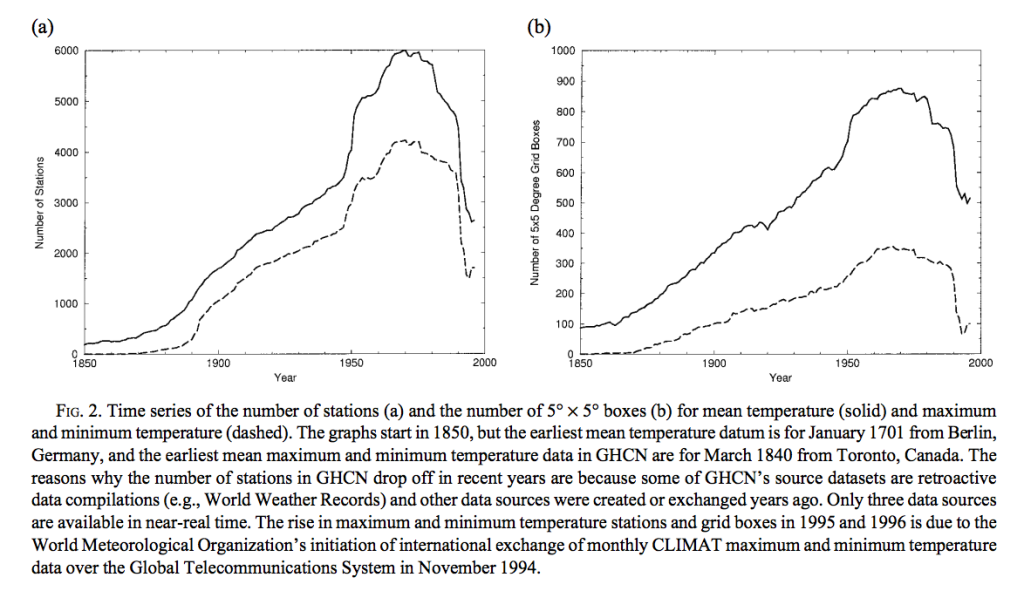
As was clear in Figure 1-1 above, the GHCN sample size was falling rapidly by the 1990s. Surprisingly, the decline in GHCN sampling has continued since then. Figure 1-3 shows the total numbers of GHCN weather station records by year. Notice that the drop not only continued after 1989 but became precipitous in 2005. The second and third panels show, respectively, the northern and southern hemispheres, confirming that the station loss has been global. The sample size has fallen by about 75% from its peak in the early 1970s, and is now smaller than at any time since 1919. As of the present the GHCN samples fewer temperature records than it did at the end of WWI.
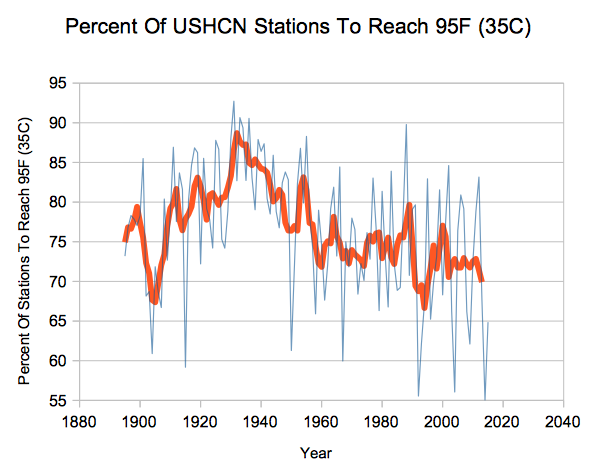
This is why their data keeps changing. They are losing the rural stations which show less warming, causing the urban stations to be weighted more heavily. Thus the 100% fraudulent blade of the hockey stick.

2016: Fig.A.gif 2001: Fig.A.ps
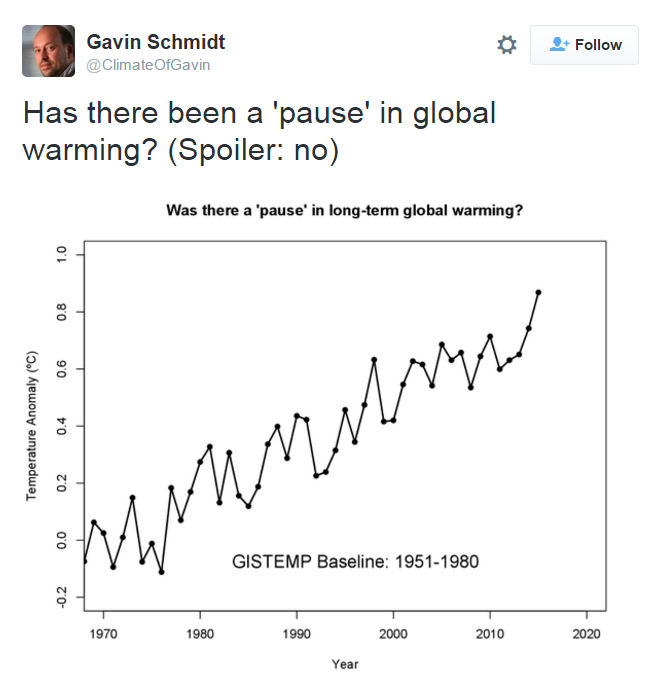
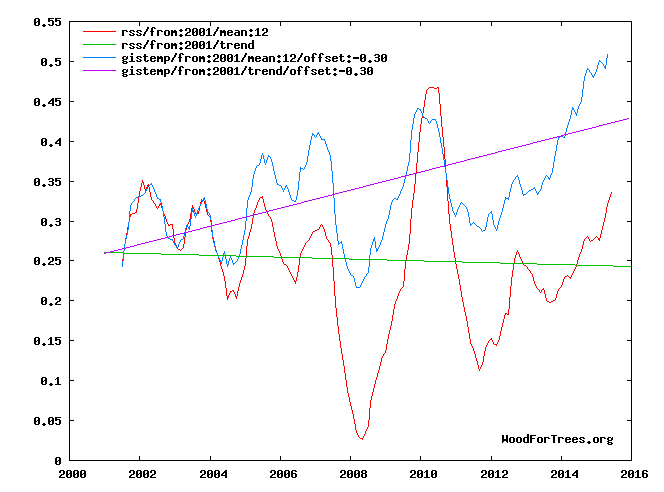
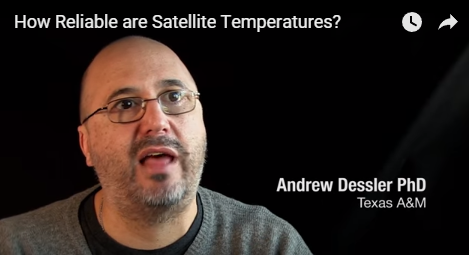
And then these slimeballs have the audacity to attack satellite temperatures, which cover nearly the entire earth.

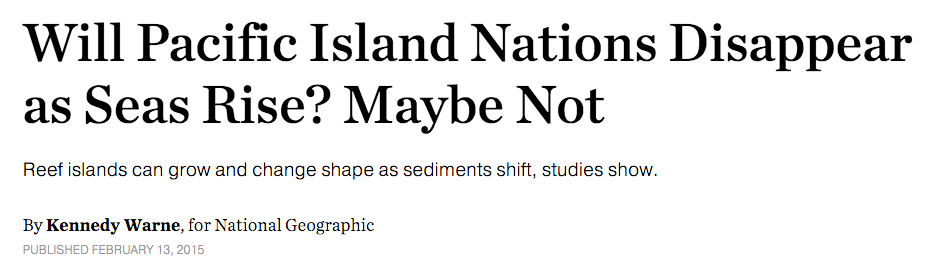 “If you were faced with the threat of the disappearance of your nation, what would you do?”


