
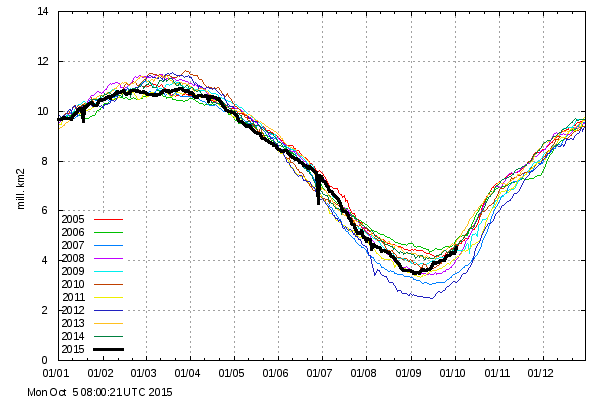
After the shortest melt season on record, and record growth of sea ice in September, Arctic sea ice extent is now the second highest in the DMI record for the date.
Ocean and Ice Services | Danmarks Meteorologiske Institut
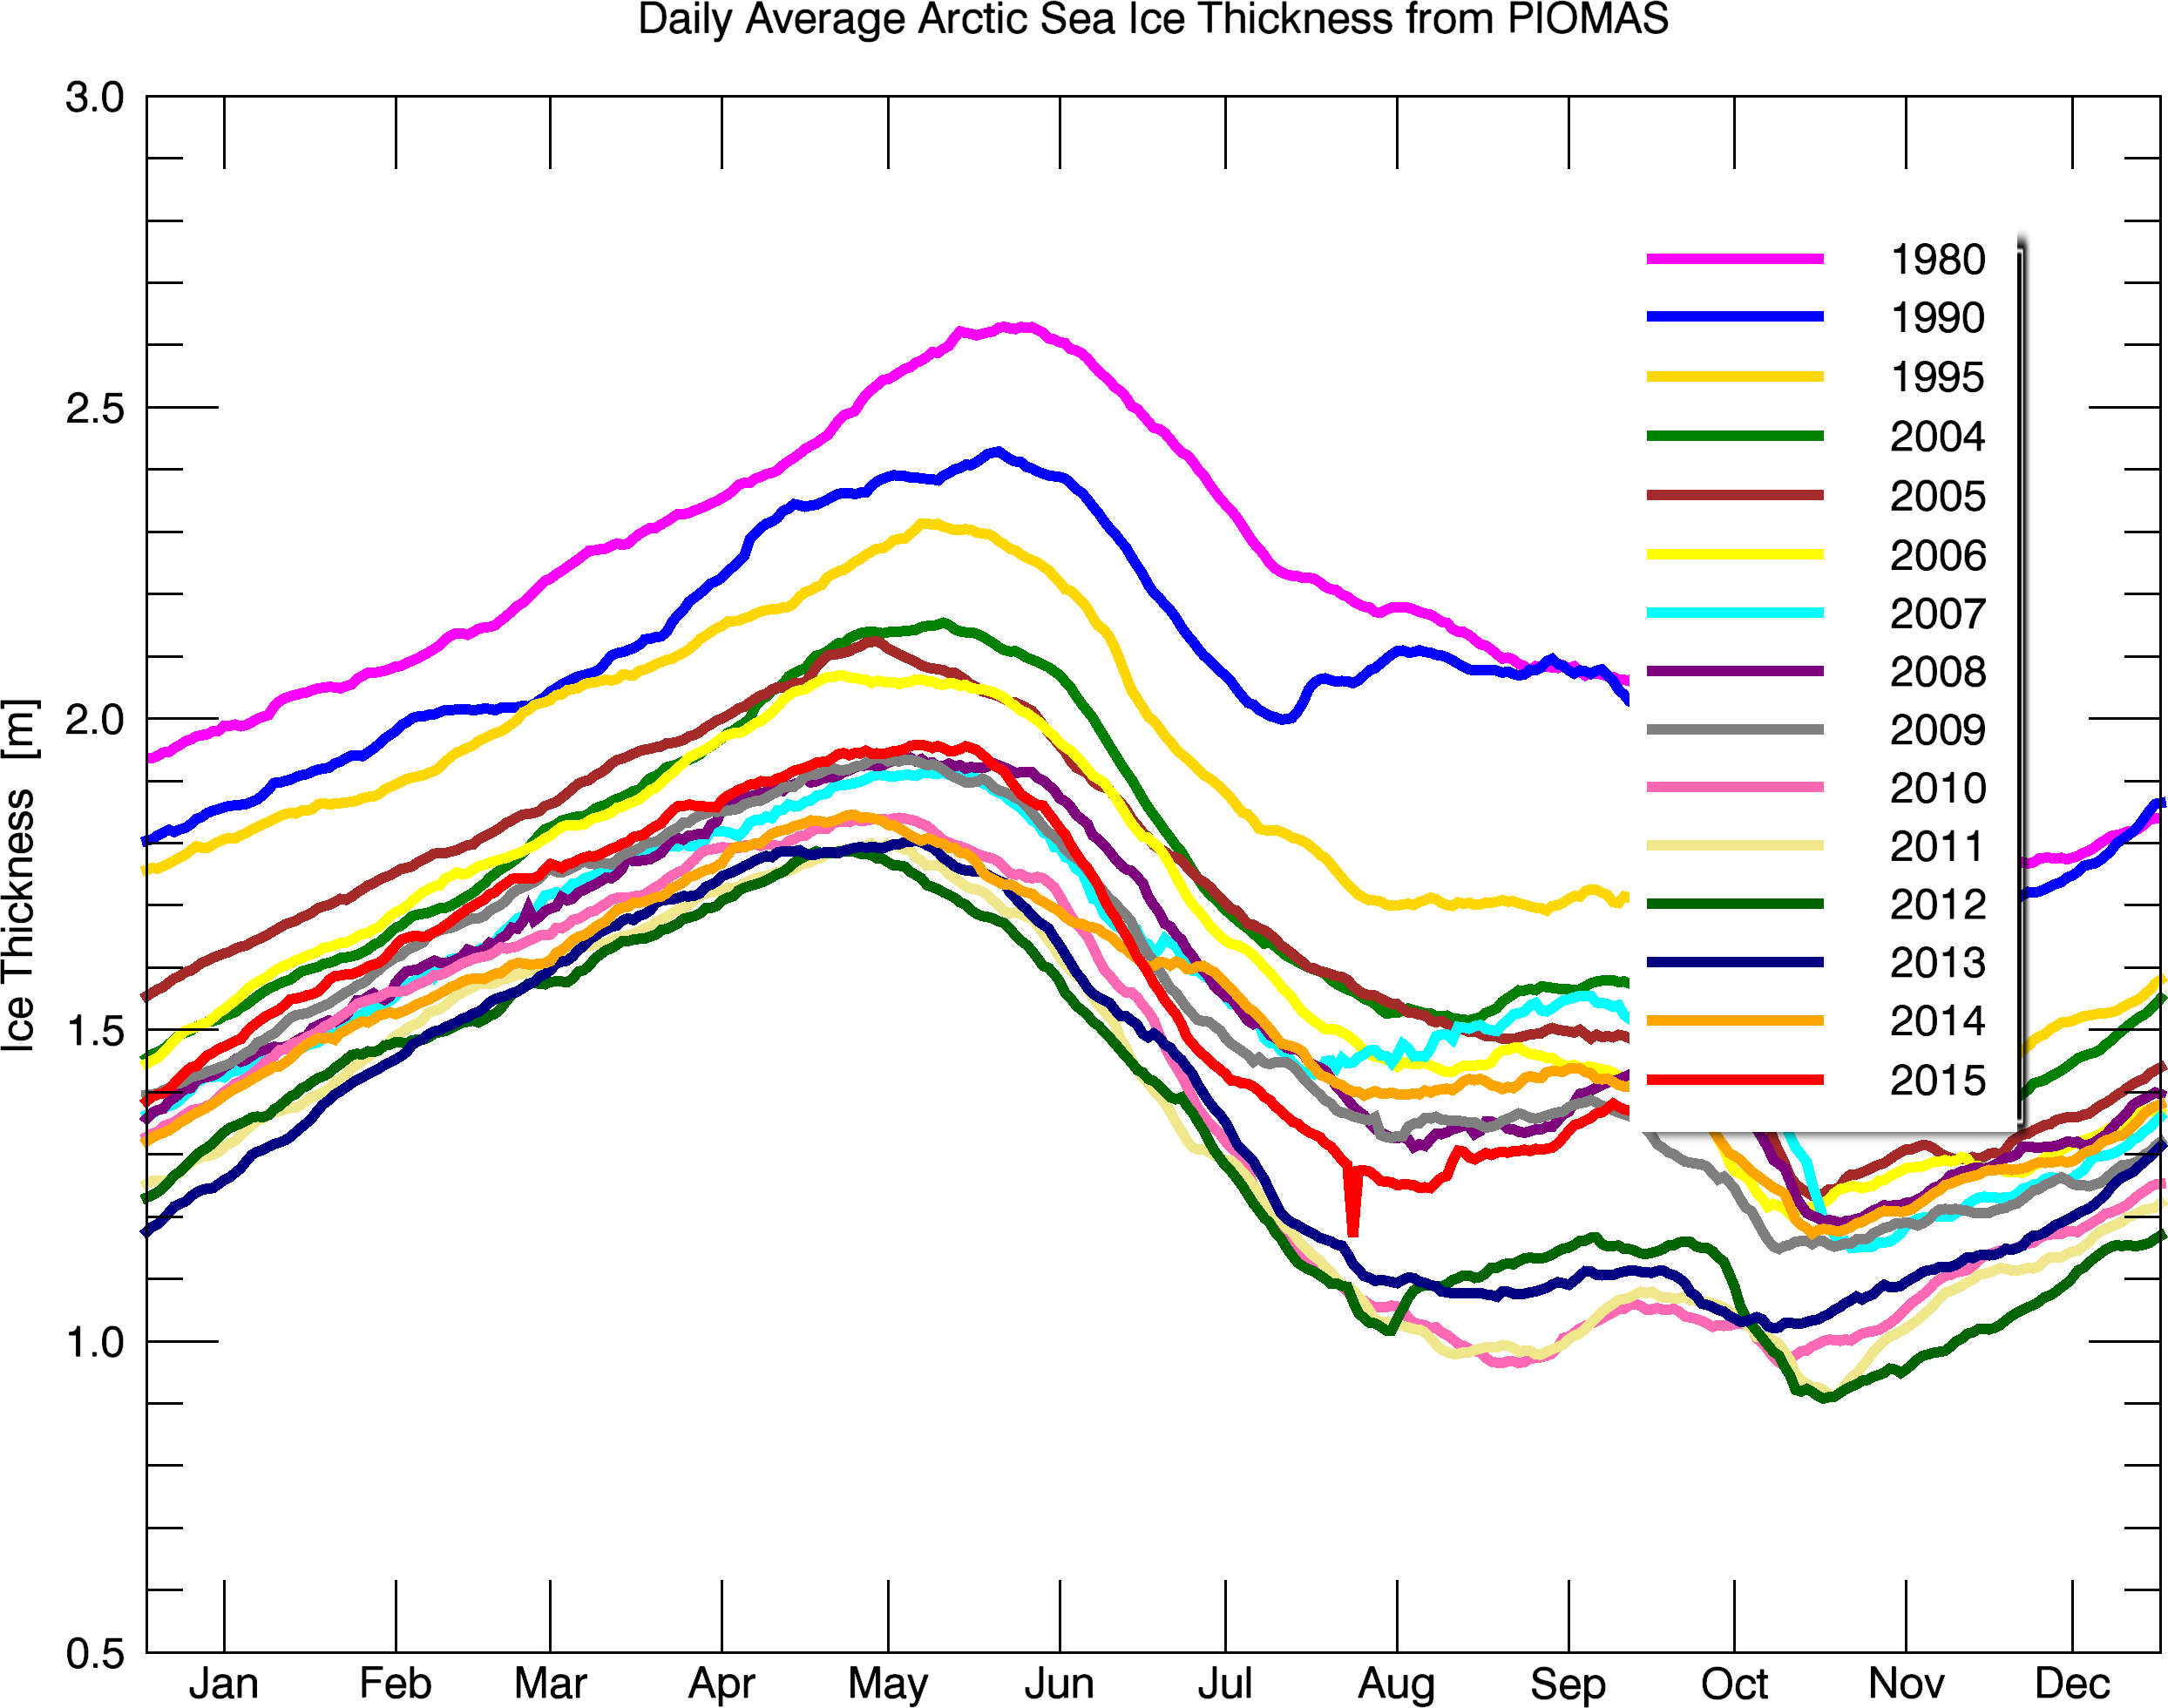
Ice thickness has increased by 40% over the past five years.
NASA’s top climate prophet says the Arctic is ice-free.
The Argus-Press – Jun 24, 2008

Hansen is a Climate
ProphetPropagandist.That “we all gonna die because Arctic sea ice is melting” crowd are now in full blown denial it seems with every measurment be it extent, area, volume, thickness, and age increasing they can’t divert. Deny it’s happening. Deny it’s a recovery. Or claim it’s going to go the other way next year is all they have right now. It really is funny to watch.
It’s not funny, they continue to have a huge following and bit by bit are getting their agenda written into law.
All we can do is what we can do! Facts only go so far when your up against a giant, aggressive, and well funded political machine. But despite all their advantages they fail to get the real ring every time as they cycle their merry go round. Paris will yield them even less than Kyoto. So they are limited to advancing their agenda through non democratic means despite “climate change” being virtually a non factor as an issue in the majority of the voting publics mind. There will come a real crisis that will blow the manufactured “crisis” of “climate change” off the charts as an issue eventually.
For a week or so, the alarmists were crowing in their glory, when a couple of Arctic storms chopped up the ice a bit, maybe with a little help of some friendly Russian icebreakers.
Now it is back to total alarmist denial with the resumption of the remarkable Arctic ice recovery.
Well, there are other facts that are not too kind to the narrative that Tony/Steven has been harping on for the last month about arctic sea ice. In mid-September he wrote that arctic sea ice was growing the fastest in history for September. The arctic sea ice anomaly at that point was -1.425 million sq kms. I predicted that the arctic sea ice anomaly would actually grow in the next several weeks. Well, the arctic sea ice anomaly grew to -1.533 million sq kms, and as of today it is now -1.761 million sq kms.
http://arctic.atmos.uiuc.edu/cryosphere/IMAGES/seaice.recent.arctic.png
So despite the exhortations coming from this blog that arctic ice is growing by leaps and bounds, the arctic sea ice extent looks like it currently has the largest anomaly in the last two years and it is continuing to grow (meaning fall behind ice extent that is normal for this time of year). As for volume, he also fails to mention that as measured by PIOMAS that we are below the long term trend of sea ice decline that has been going on for decades.
So just be aware that there are facts out there for you to better gauge what is actually going on with arctic sea ice.
For the record, I’m guessing that the anomaly is just about at it’s maximum for this year and will be going down (moving closer to normal) in the near future.
The 2014/5 global sea ice extent is average. The 2015 El Nino has brought Antarctica back to average after 5 record high years. Greenland has accumulated 100 Gigatonnes of snow in one month. PIOMAS say Arctic sea ice is thicker than 2009. And the Arctic extent is rapidly increasing. If you can get “We’re Doomed” out of all that, then share the bong around.
http://www.climate4you.com/images/NSIDC%20GlobalArcticAntarctic%20SeaIceArea.gif
Can you share with me where I said we are doomed?
I would probably agree with you that some of the “alarmists” are laughably wrong in their hyperbolic take on things. My point in challenging the narrative on the arctic sea ice issue is that the denier community is just as human as the community that accepts the science and, as such, can also fall prey to writing things that are laughably wrong in their hyperbolic take on things.
So it is true that we have (at least) a short term rebound of sea ice extent and volume off of historic lows. I understand that the skeptic community thinks that the current rebound is going to continue and Steven/Todd certainly writes as if he actually believes this. The analysis though is so over the top (IMHO) and sheds far more heat than light. I try to give a view from the other side based off of my layman’s attempt to understand the data.
And while I’m not a scientist, I did observe the data (and hyperbolic narrative here) and formed a hypothesis (arctic sea ice extent anomaly will increase) and was proven correct. Meanwhile, people here laugh and scoff at the predictions but I’ve been proven correct (on the short term and I’ll admit it wasn’t that bold a prediction given the data on hand).
So, yeah, PIOMAS is currently above 2009 levels. Care to share with the readers here how many years out of the last 35 that this is true for? Yeah, arctic sea ice extent is expanding rapidly. Care to share with the readers if this occurs every October? And can you explain why you say the arctic sea ice is expanding “rapidly” while the anomaly is actually growing? (Which by definition, in the growing season, means that it is growing slower than normal. Which is really my main gripe recently. Deniers here say the ice is expanding rapidly. I’ve clearly shown the data that it is actually expanding slower than normal (i.e. the anomaly is increasing). But no one here acknowledges it and just repeats Steven’s mistaken take on arctic sea ice )
Interesting video
The Real Reason Obama went to Alaska
https://www.youtube.com/watch?v=OQaI1N_t1FQ
Excellent video!
Yes, I grabbed Hubbys computer while he was out and watch it and a few others. The guy has some really decent videos up. It looks like he has quite a following too.
yep, those advanced inner earthers are doing their thang!
The West-particularly – the violent war-mongering U.S. wants in on their territory, full of all manner of wealth – untold. And the Inners will NOT allow it!
Hehehe!
Greenland continues to gain ice at record rates:
http://www.dmi.dk/uploads/tx_dmidatastore/webservice/b/m/s/d/e/accumulatedsmb.png
I haven’t seen that graph before so I might be reading it wrong. If so, kindly correct me so that I don’t make the same mistake in the future.
But with positive and negative numbers on the Y axis I would expect that the graph is growth or melting of the ice. So record growth (at least on the time frame shown) would be the largest spikes into the positive, right?
It is barely positive currently and, on top of that, this would seem to indicate to me that we just came off a far greater melt season in greenland than is typical for the melts season of June and July. So you would expect larger growth rates after a record melt season as it would be expected to try to revert toward mean.
But like I said, I may be misinterpreting the data presented on that graph as it’s not exactly clear to me at first glance.
“…we just came off a far greater melt season in greenland than is typical for the melts season of June and July….”
…………………….
ERRrr, No it was a very poor melt season in Greenland and the snow lingered longer than usual.
The capital of Greenland was still buried in snow on June 6
https://i0.wp.com/realclimatescience.com/wp-content/uploads/2015/06/arcticomm_webcam-4.jpg
And the temperatures at the capital are the coldest on record as of Jun 5:
http://realclimatescience.com/wp-content/uploads/2015/06/ScreenHunter_2257-Jun.-05-08.58.gif
Ok, again, I might be misreading the graph but it seems you are wrong about it being a below average melt season. One way to determine if it was above average or below average would be to determine the area above the mean and the area below the mean and see what is greater for the melt season.
The melt season would seem to start in early June and at first it was going slower than normal. By early July it crossed over to be a stronger melt season than normal. For the entire melt season it would seem that it was actually greater than average on the whole (the area below the mean is greater than the area above the mean).
At least that is how I’m reading it but perhaps I’m wrong.
Koop,
I think you are reading that graph wrong. It’s showing total accumulation, so a “record rate” would be the steepest slope, not the highest point. Basically, this graph IS the integral you suggest as a means to determine the deviation from average.
I wouldn’t claim a record rate from this data, as it plainly matches last year, within any rational margin of error. But it’s definitely above average. It would help if the gray area were defined. I can only assume it represents either a one or two sigma deviation from the 1990-2013 mean, and we’re currently above that.
Last year’s melt season started late, and ended early, giving a higher than average melt rate, but over a condensed time. While I have to disagree with Gail in that this graph shows a somewhat higher than average total melt, it still ended with a 200+ Gt net accumulation. This graph shows that on every single day last year, Greenland had more ice than on the same day, a year earlier. It gives no data at all on actual ice mass, so we can’t tell much about how the current ice mass compares, historically. But we can conclude that, from minimum to minimum, it increased by roughly 210 Gt. last year. And we can conclude that, for the 1990-2013 period, Greenland gained roughly 5500 Gt. of ice. While that may (or may not, as we can’t tell from this graph) be less than Greenland used to gain, it’s certainly not a decline.
Because it shows land accumulation, I disagree that a higher recovery rate would tend to follow a deeper melt season. While the temperature remains substantially below freezing, accumulation is merely the amount of snowfall, for all practical purposes. I would, however, agree with that statement, if this graph showed sea ice mass.
It is true that climate follows now a path of different stages and scientists can predict its changes. Those predictions are based on previous observations like this study about the 20th century climate found on http://www.arctic-warming.com. Still, it seems like we haven’t learn much about the climate if we keep coming back to the same stages. And we sure don’t care about the most powerful climate-influencing factor on Earth: the oceans.
I figure the three controllers of climate are the sun, water in all three states, and land configuration.
ja ja,
it is getting cooler
https://i0.wp.com/oi62.tinypic.com/33kd6k2.jpg
but how cool will it get?
If we are real lucky the next glaciation won’t start for several hundred years.
Interesting info from E.M. Smith
Looking at that first graph..
I reckon that the 2015 extent will be above all the other lines for most of November and December.
Yes , I was thinking the same thing. The short melt season and early turn around has boosted the reversion status ; it may require earlier years than 05 for comparison.
Do you know if that graph or this graph is more accurate?
http://ocean.dmi.dk/arctic/plots/icecover/icecover_current_new.png
There is definitely conflicting data but since it appears the sea ice anomaly is actually growing instead of shrinking during this “record growth” the graph displaying 2015 as the 2nd highest is “interesting”.
BTW, I would expect it to not be above for most of November and December because I explained before when I accurately predicted a growing sea ice anomaly, the waters around the arctic basin are warmer than normal, the air temperature is above normal, and the sea ice extent is far lower than normal. Taken together I would expect slower growth in the near future and hence 2015 to be continue to be well below average even compared to recent years.
That graph is not the current one. DMI generally has the data I trust the most though.
And it agrees pretty closely with Sunshine hours
https://sunshinehours.files.wordpress.com/2015/10/arctic_sea_ice_extent_zoomed_2015_day_278_1981-2010.png?w=1024&h=682
Thanks for that link but I think it further validates my thinking about Steven’s point on the arctic sea ice. His take is hyperbolic, doesn’t put things in context and ends up misleading his readers.
In the post above he states “after the shortest melt season on record, and record growth of sea ice in September, Arctic sea ice extent is now the second highest in the DMI record for the date.” I point out that sea ice growth is actually below average since he made that post in September touting record growth. Your own link further shows that the 2015 figure is actually only above 3 other years for this date (not above 8 of the years since 2005).
Now, Steven has corrected me in the past by pointing out that he is using different sources of data than I’m using and they use different parameters (30% vs 15%). And this may be another case of the same thing. I don’t have a problem with that as I frankly don’t know what the experts say is the figure we should focus on or the arguments pro and con against any data set out there. But instead of saying the data is mixed, he goes full blown “RECORD SEA ICE GROWTH!!!” And most people lap it up here. Of course, I’m probably not as skeptical as I should be about data that supports my understanding of the science and I suffer (as most people do) from confirmation bias. But at least I understand that about myself and that is a good thing. Not all skeptics seem to be as skeptical though.
Let us be clear here. It was not we skeptics that were silly enough to claim measurements of ever changing Arctic Sea ice in a given year is some kind of a prime gauge of NH or Global temperatures. It was the AGW “scientists” that made it that measure and then the political functionaries like Al Gore and the Sierra Club picked up that standard and screamed about it from the roof tops for years on end! Scientifically such a claim is silly but it was picked up as a mantra of the AGW movement and now they have to live with it and squirming and crying that it isn’t fair or isn’t really that important or what happening isn’t really happening now isn’t going to do you or any of them any good.
Koop,
I think you and Tony are comparing different averages. It appears that you’re comparing today’s numbers with the 1979-2000 average, while Tony is comparing today with the average of the last 10 years. If I’m reading this right, you’re both correct, but answering different questions.
A running theme here is the predictions that the Arctic would be ice free in summer, by this point. I believe Tony’s goals are to illustrate the absurdity of those linear projections, extrapolated from a few freak years, and to demonstrate that the annual ice extent is currently expanding, rather than contracting. I don’t believe he’s trying to say that we’re beating the 1979-2000 average, though I can see how you might get that impression. Tony’s style suggests to me that he knows he’s more preaching to the choir than evangelizing, at least in this forum. I assume he’d go into more details about these things, if he thought he was playing to a hostile crowd. But most of the regulars here understand what he’s saying.
Thee alarmist morons seem to revel in being incorrect.
It is like they are tripping over themselves and each other to see who can be the wrongest.
Here’s one for the glacier scaremongers..
http://www.ancient-origins.net/news-history-archaeology/archaeologists-uncover-1300-year-old-ski-norway-002233
“The melting of the long-frozen snow and ice in Norway, and elsewhere around the world, has already yielded numerous ancient artefacts,…….”
roflmao !!!!!!!
How about this one from the same site:
http://www.ancient-origins.net/news-evolution-human-origins/initial-dna-analysis-paracas-elongated-skull-released-incredible
And another
New paper finds worldwide glacier retreat has decelerated since 1950
http://hockeyschtick.blogspot.com.au/2014/04/new-paper-finds-worldwide-glacier.html
No CO2 glacier melting signature either.
Is there ANYTHING CO2 can do, except help grow plants?
They say it can make Bees tongues shorter, cause wars and massive refugee movements, make your beer less tasty, and oh so many other things. I surprised they haven’t said it will cause shorter penises in males, though I would be inclined to believe it to be a clear face in certain academic and political populations.
CC science; it’s all about the grants money……. isn’t it????
https://www.youtube.com/watch?v=QSc5YImpUkQ
“After the shortest melt season on record, and record growth of sea ice in September”
Is any other source claiming such? Does anyone else believe it? I don’t agree at all with both those statements. You cannot determine either of those by just looking at that graph.
If you look at JAXA
https://ads.nipr.ac.jp/vishop/vishop-extent.html?N
You can see the growth is nothing out of the ordinary, very close to 2011 and 2012. As I mentioned before you’d expect larger growth rates if the minima is lower as the ice edge is further north. Or is that a bad assumption?
For the melt season, using that graph it is hard to tell if it is Feb or March the largest extent, Steve picks end of March. However on Cryosphere it is Feb
http://arctic.atmos.uiuc.edu/cryosphere/arctic.sea.ice.interactive.html
As it was for JAXA. 15th Feb was their highest maxima.
NSIDC also show Feb
http://nsidc.org/arcticseaicenews/charctic-interactive-sea-ice-graph/
Indeed, even if you use the Danes site, the other newer plot, which they recommend
http://ocean.dmi.dk/arctic/icecover.uk.php
Indicates Feb was indeed the maxima and not end of March, so I think talk of shortest melt season on record is not true.
“…As I mentioned before you’d expect larger growth rates if the minima is lower as the ice edge is further north. Or is that a bad assumption?….”
Bad assumption.
If you have a small circle representing the ice and it freezes say, 5 feet out from the circle, the increase will be much smaller than if the circle had twice the radius and you added an extra 5 feet to the radius of the larger circle.
Your analysis makes sense. And Gail’s rebuttal doesn’t quite hit home with me.
I understand the idea she is explaining as it is simple geometry. But that is not how arctic sea ice is measured. A better example would be to use data instead of geometry. For example, you can have a minimum of 3 million sq kms and one of 4 million sq kms. If the sea ice extent grows by 900,000 sq kms for the 3m year and 1M sq kms for the 4m year the skeptics might tend to write a glaring headline saying that the 3 million sq km year is increasing at a record pace. It’s true on a percentage basis but deceptive at best given the overall context of arctic sea ice.
Good catch on the timing of the maximums from other sources.
I do like a good graph 😉
http://static.guim.co.uk/sys-images/Guardian/Pix/pictures/2013/9/9/1378692793547/ArcticEscalator450.gif
I expect when Homer’s time (on that prediction) totally runs out in 3 years, they’ll still be calling him a prophet: it’s all about whether prediction is one of doom, and that humans are the cause of it; it has zero to do with accuracy.
Dace, if they manage to lock the world into a direct tax by the United Nations in Paris in December, they don’t give a hoot whether or not their fear mongering is correct.
if the “climate” money that is taxed is used to promote agriculture around the equator,
that would be a good thing.
The [my] theory goes that global cooling causes less clouds and precipitation at the higher latitudes. The lower latitudes should get more rain,
as [we know is] also indicated by the figures on the flooding of the Nile.
I am finding this rather ironical that neither the sceptical [of global warming] nor those promoting AGW are seeing the problems with the supply of food to 8 billion people and counting that will arise 6 years or so from now….which could be prevented if we could get farmers to move from the Great Plains [of America] to the lower latitudes around the equator.
There was some reference to what was posted here some time ago I could use here that quoted global shortage of food in 1934 but I cannot find it anymore here. There are simply too many posts here. Perhaps Tony/Steven could help me out here?
We turn millions of tonnes of food into fuel every year just in the US and pay farmers to leave their land fallow, I think there’s a bit of room in the food growing capacity of the world. Not to mention what can be done in Australia or Brazil and Argentina.
From the 1974 CIA report:
“A Study of Climatological Research as it Pertains to Intelligence Problems”
http://www.climatemonitor.it/wp-content/uploads/2009/12/1974.pdf
I think one of the reasons Putin went after the Ukraine is because it is the “breadbasket of Europe” Actually when they set up the winter Olympics next to the Black Sea and everyone wondered why, I predicted at the time it was because Putin wanted to move troops close to the Ukraine without tipping his hand. Seems I was prophetic.
People keep forgetting that the Russian Astrophysicist, Habibullo I. Abdussamatov head of Pulkovo Observatory of the Russian Academy of Science has been predictng global cooling for a while. Russian leaders would pay close attention to such a prediction from a man held in high esteem.
You just connected the dots that no one else is looking at. We have had several weeks almost zero sunspots the cold she is a comin’.
I have been saying this since the Georgia attacks. We need to hug.
Henry P, I entered the CAGW arena straight from the fight over control of US farmers. I have reams of data on the grab for total control of the world food supply.
I hate linking to this site because he is considered a Wacko, but on this issue he is correct (Actually it is a report from someone else): The Food Cartel Companies: Profiles and Histories since that was written they are now down to nine.
The WTO and the Politics of GMO On who controls the World Trade Organization Agreement on Agriculture.(WTO-AoA )
Want Food Security? Bring Back the Grain Reserve
Both the WTO-AoA and the Freedom to Fail Food Bill that destroyed US grain reserves and independent farmers were written by Cargill VP Dan Amstutz.
FP: How Goldman Sachs Created the [2008] Food Crisis
January 4, 2008 Starvation very ‘attractive’ to financial traders
I forgot to add Dan Amstutz left Cargill to join Goldman Sachs to help set up the “new kind of investment product, a derivative that tracked 24 raw materials” so he was one of ” the brilliant minds of Goldman Sachs to realize the simple truth that nothing is more valuable than our daily bread.”
Every year for the three years prior to this one (The figures aren’t in yet for this year) the world has produced proportionally more calories per capita than at any other time in recorded history. The problem for now is not quantity but distribution. Denial of Food or water has always been the ultimate weapon and control of food or water distribution has always been the ultimate tool for such control.
AMEN! As long as the climate remains reasonable the harvesting, storage and distribution system is where attention should be focused. And of course ENERGY is the critical factor in causing this to happen.
Sun Jul 1, 2012 As crops rot, millions go hungry in India
Apr 9, 2012 Starving in India: The Forgotten Problem
Come on, you guys. You too, Gail. Second highest on this particular day of the year since 2005? Is this grade school? The arctic ice extent jumps all around. To say that we are convinced that there is a recovery because this current blip of the day is higher than the last ten years is not what scientists do. They look at trends, and at averages. Tony can pick a particular day, say that it means anything that he wants to, and you all fall in line with his bs?
No we do not fall in line with the Governments B.S. the ‘record lows’ of 2007 and 2012 were not caused by melting they were caused by transport of ice out of Fram Strait by weather events. Recovery especially with the NAO turning and solar cycle 24 winding down is to be expected
So we like to cheer on our ‘favorite’ horse in the race. Get over it.
http://boulderreporter.com/wp/wp-content/uploads/pale-horse.jpg
https://helpermonkeybrews.files.wordpress.com/2013/01/death_rides_a_black_horse_by_sammykaye1.jpg
https://tallbloke.files.wordpress.com/2014/03/apocalypse.jpg
The average trend since 2005, when the AMO index reached its top and started to turn back down is for increasing Arctic sea ice.
I know the only trend you are interested in was the trend on the upward leg of the AMO.. but that is over. it is reversing, just like Arctic sea ice levels are.
It is only your brain-washed ignorance that refuses to look at reality.
The “Death Spiral” is dead! The alarmists don’t like using the Arctic Sea Ice as a gauge for NH temperatures any more so NOW all of sudden it’s not a viable measure? Too funny.
There never was a “Death Spiral”.
It was the total ignorance of the standard AGW junkie not understanding about the cyclic nature of the AMO as one of the main influences of Arctic sea ice level.
The climate scientists know about the AMO.. but they hide the truth from their cult followers, and invent alarmist nonsense for the gullible lap up and spew around the web.
Morgur,
You must have missed the change in the AMO, the overall ice increase since the 2012 low, and the ice thickness increasing, as well as the amount of third through fifth year ice increasing, as well as all the failed death spiral predictions, as well as the fact that prior to 1979 there was far less arctic ice, as well as historically in this interglacial there have been many periods of less ice then now.
morgur dude, your comment below really explains why you miss so much. By the way, 2013 will mark the beginning of a long term arctic ice recovery, so good on you for putting that in your handle.
Because I disagree with most of you, I have been “spam rejected” by tony heller many times. That is cool. It is his blog. But, I believe that since I have not been ‘spam rejected’ lately, he is sort of amused with me. Maybe not. What ever. If I do not post for awhile, it means that Tony Heller is tired of my opposition. Eventually, I resurrect. He is a dildo. I am a god. (What am I, Donald Trump?) My hair will eventually attack you. I am the god of large walls.
Liquor, drugs or both?
You are rejected because you are a base level CRETIN !
I haven’t known Tony to be a harsh moderator. He lets some pretty heavily opposing views air here, and I’ve never seen him threaten to ban anyone. Though he does seem to have the robots solidly under control. Could it be that your rejected posts just look too much like spam? I’m honestly just guessing here. I know my posts show up immediately. When yours are rejected, do they show up, then disappear? Or do they just not show up at all? If it’s the latter, I expect they’re being filtered out before Tony even sees them.
Also, calling him a dildo can’t help.
Ted… Ted… “robots solidly under control”… we are all tuned to the same frequency and marching to the same tune you should know. Tony has the same logic programming as most of us,,, in that we sense AGW, BS in all its forms…
No, I’d never call the readers here robots. It’s Rush Limbaugh who has “mind numbed robots.” Tony has science denying climate criminals, who are all bought and paid for by Exxon and the Koch brothers. We’re also somehow related to the tobacco industry, but I haven’t quite figured out how yet. As long as they keep paying me, I don’t care. I believe whatever they pay me to believe.
That reminds me. I haven’t gotten my October denier check yet. What’s the holdup? Is anyone else’s check late?
Word Press does censor certain words and certain websites.
I have had comments completely vanish into the ether. No sign they are waiting moderation or anything.
This has happened here (about 15 minutes ago) at Jo Nova’s (earlier today) and at E.M. Smith’s earlier this year.
I corresponded with both Jo Nova and E.M. Smith and the comments were not in the spam filler so they never made it to the blog.
Arctic Sea Ice extent continues it climb towards 2010 and 2014 values.
https://sunshinehours.files.wordpress.com/2015/10/arctic_sea_ice_extent_zoomed_2015_day_279_1981-2010.png?w=1024&h=682
@Gail
My various investigations into the issue of climate change can best be summarized as follows:
? There is no evidence in the recent temperature records of minimum temperatures going back to 1973 suggesting that the emission of more greenhouse gases causes any “global warming”. To ride, drive or fly is safe for the environment!
? A careful study of maximum temperatures of the recent temperature records reveals that Earth is most likely on an 88 year A-C wave, the so-called Gleissberg solar/weather cycle, with ca. 44 years of warming followed by 44 years of cooling.
? There is ample evidence showing that the amount of irradiation that comes through the atmosphere varies due to natural solar- and/or solar-planetary induced weather cycles.
? All major data sets including my own indicate that average temperatures have started to go down from around the turn of the millennium, meaning that global cooling has started from that time. My own data sets confirm that, in general, it will be globally cooling until around 2040.
? A natural consequence of global cooling is a small (?) shift of cloud formation and precipitation, more towards the equator, on average. Whilst maximum temperatures will still be dropping, average temperature around the equator remains more or less unchanged, largely due to more condensation energy coming free.
? At the higher latitudes >[40] it will become progressively drier, from now onward, ultimately culminating in a big drought period similar to the dust bowl drought 1932-1939. My various calculations all bring me to believe that this main drought period on the Great Plains will be from 2021-2028. It looks like we have only 7 “fat” years left…..
[THIS WAS WRITTEN IN 2014]
so, we are down to 6 years.
but….nobody is worried…..
1933/34
brought us
Hitler.
Mark my words!
the next Hitler will probably be a woman
http://www.hourofpower.org/global/south_africa/news/JesusisGodbook.doc
note the last chapter….
[that book was written in 1995]
http://www.strategypage.com/gallery/images/Coast-Guard-Cutter-Healy-10-2015.jpg
The crew of U.S. Coast Guard Cutter Healy and the Geotraces science team have their portrait taken at the North Pole Sept. 7, 2015. Healy reached the pole on Sept. 5, becoming the first U.S. surface vessel to do so unaccompanied. Healy is underway in support of Geotraces, an international scientific endeavor to study the geochemistry of the world’s oceans. (U.S. Coast Guard photo by Petty Officer 2nd Class Cory J. Mendenhall)
“The Coast Guard Cutter HEALY (WAGB – 20) is United States’ newest and most technologically advanced polar icebreaker.” It is capable of breaking ice up to 3 meters thick.
Here is the ships webpage:
http://www.uscg.mil/pacarea/cgcHealy/AWS15/
The Healy is a great addition to Polar Star. The US needs many times this in Icebreakers and it’s only for Govt. Global Warming assumptions ; the Icebreaker fleet is so small…
Has any research been done about the effect icebreakers have on multiyear ice? It seems to me that there’d be some kind of consequence to cutting long lines through the ice.