Today’s Featured Climate Fraudster – Cynthia Rosenzweig Of NASA

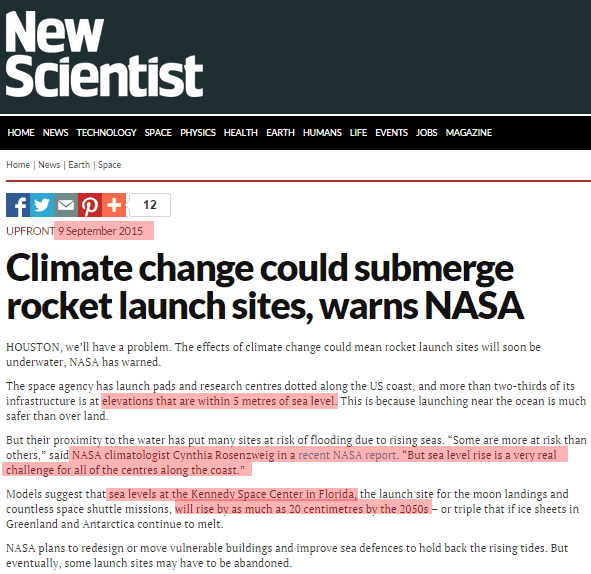
Check out this mind-blowing sea level fraud from Cynthia Rosenzweig of NASA. She claims that Florida launch sites are threatened by sea level rise.

ScreenHunter_3022 Sep. 11 01.54

Climate change could submerge rocket launch sites, warns NASA | New Scientist

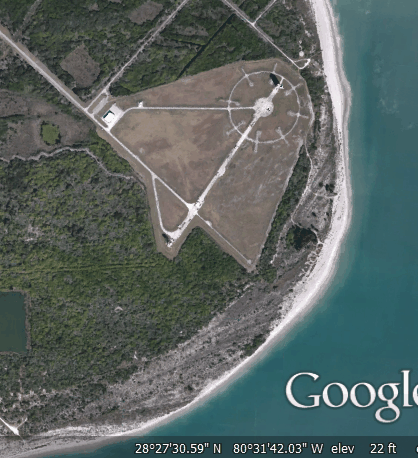
The Cape Canaveral launch pad is at 22 feet, or 670 cm elevation.

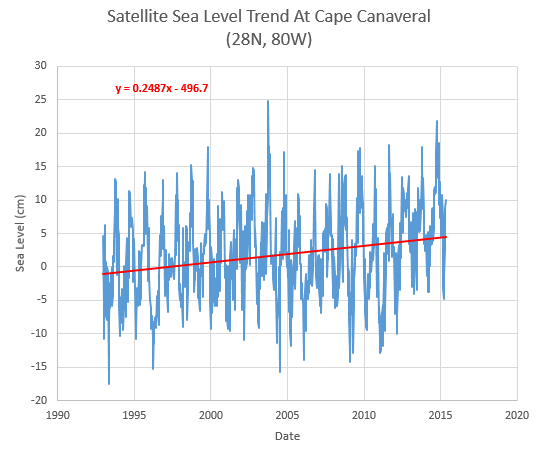
ScreenHunter_3024 Sep. 11 02.00

Satellites show sea level at Cape Canaveral rising 2.49 mm/year since 1992.

ScreenHunter_3030 Sep. 11 08.07

Interactive Sea Level Time Series Wizard | CU Sea Level Research Group

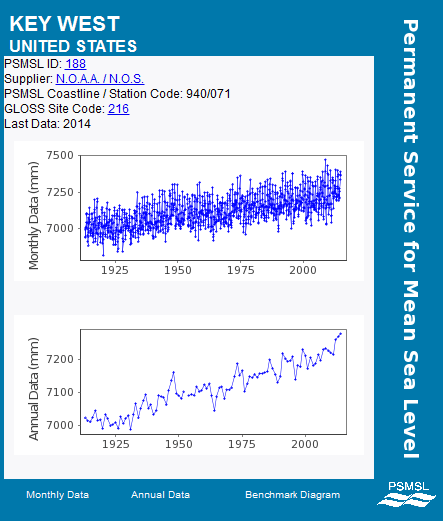
Long term tide gauges in Florida also show about 2.5 mm/year, and no acceleration in sea level rise over the last century.

ScreenHunter_3032 Sep. 11 08.21

Data and Station Information for KEY WEST

It will take 2,700 years for the launch pad to drown, and sea level will rise 9 cm by 2050 – not the 20 cm that Rosenzweig claims.  To put her idiotic claim in perspective, it is the equivalent of Bronze Age people making infrastructure forecasts for the year 2015.

ScreenHunter_3031 Sep. 11 08.19

What motivates NASA people to make these wildly fraudulent claims?

Posted in Uncategorized | 16 Comments

Elon Musk Achieves Climate Intergalactic Stupid

Elon Musk wants to nuke the Martian ice caps, in order to release CO2 and warm the place up.

Making Mars habitable is a goal of some very smart people, mostly because one day — either due to environmental disaster, an expanding sun, or any other number of disaster scenarios — the Earth will become uninhabitable.

But is nuking Mars really the best way to create a new Earth?

Why it might work
Right now, Mars seems like a dry, dead planet. But its polar ice caps contain about equal parts water and carbon dioxide.

Nuclear weapons could be used to vaporize them, releasing those materials into the atmosphere. Once the atmosphere got thick enough, the greenhouse effect would kick in: energy from the sun, absorbed by the planet and released as infrared radiation, would be trapped.

That would continue heating up the planet, releasing more carbon dioxide, setting off a chain reaction until, ideally, the surface pressure of Mars would increase enough for liquid water to exist — making it much more habitable for oxygen-producing plants.

“You could start turning Mars from a red planet into a green planet,” Michael Shara, curator of the American Museum of Natural History’s astrophysics department, told NBC News.

Would Elon Musk’s Plan to Nuke Mars Actually Work? – NBC News

You just can’t make up stupid like this.

  1. The nukes would only melt a small amount of ice, an hour later the temperature would be the same as it was before, and the ice would refreeze. Alarmists are always bragging about global warming accumulating billions of nukes every year.
  2. The Martian atmosphere is already 95% CO2. Adding more will have essentially zero effect on the radiative balance. The Martian atmosphere contains about ten times as many CO2 molecules as Earth’s atmosphere, but the temperature there is -60C.
  3. The total mass of the Martian ice caps (1.6E18 kg) if entirely evaporated, would only bring the atmospheric pressure on Mars up to about one third of Earth. This couldn’t happen, because half of the ice caps are water, and would remain frozen. The highest atmospheric pressure you could realistically hope for would be about 150 mb. At that pressure, the temperature on Mars would remain well below freezing.

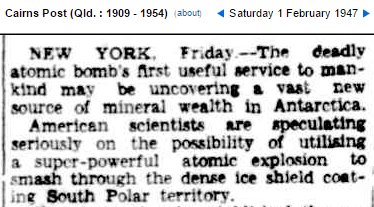
Seventy years ago, scientists wanted to nuke Antarctica to melt the ice cap.  They never get any smarter.

ScreenHunter_3019 Sep. 10 19.04

01 Feb 1947 – World of Science Atom Bomb To Reveal Antarctic R…

Musk isn’t stupid though. It is just one more of his schemes to extract billions of dollars from the US government.

Posted in Uncategorized | 48 Comments

More On Joe Romm’s Spectacular September Fraud

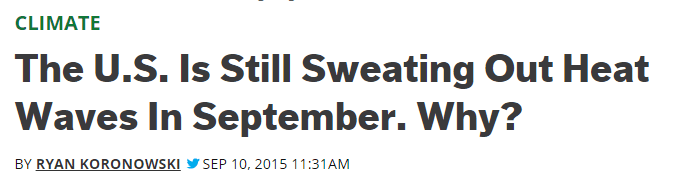
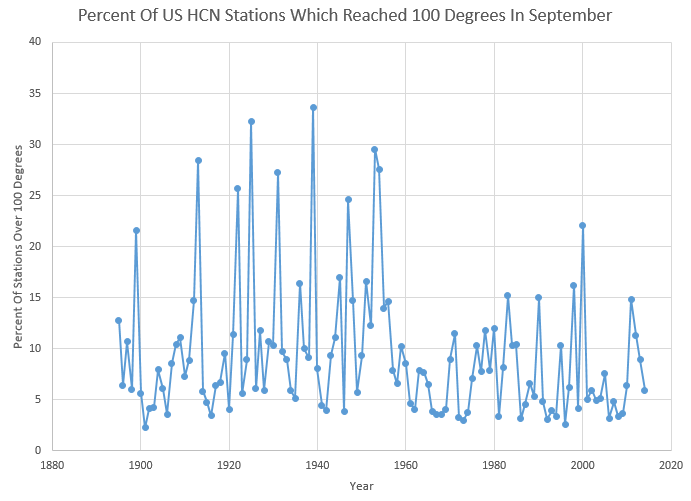
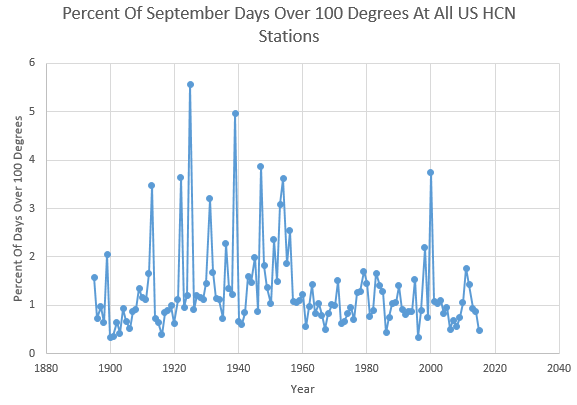
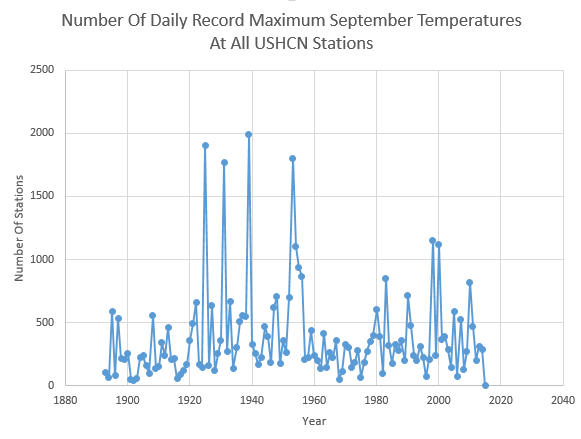
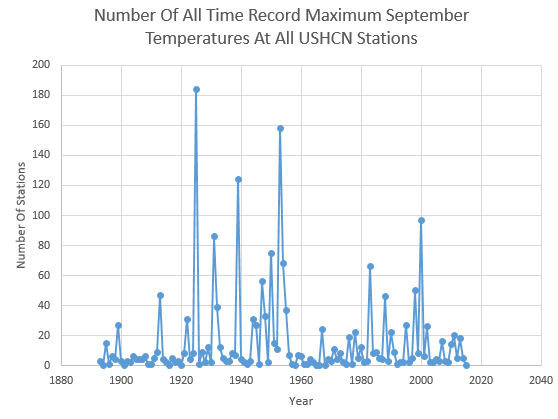
Joe Romm claims that September didn’t used to be hot in the US, and that CO2 is making it hotter.

ScreenHunter_3007 Sep. 10 14.00

The U.S. Is Still Sweating Out Heat Waves In September. Why? | ThinkProgress

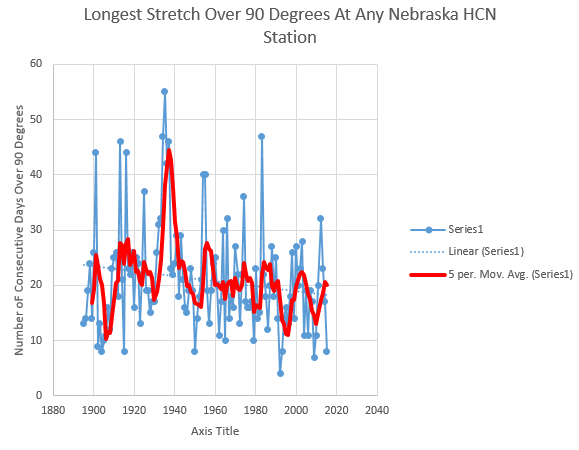
This is blatant straight up fraud. By every measure, US September heatwaves were much worse prior to 1960.

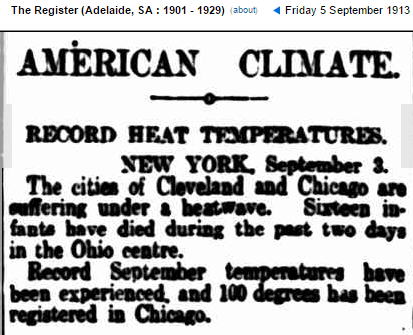
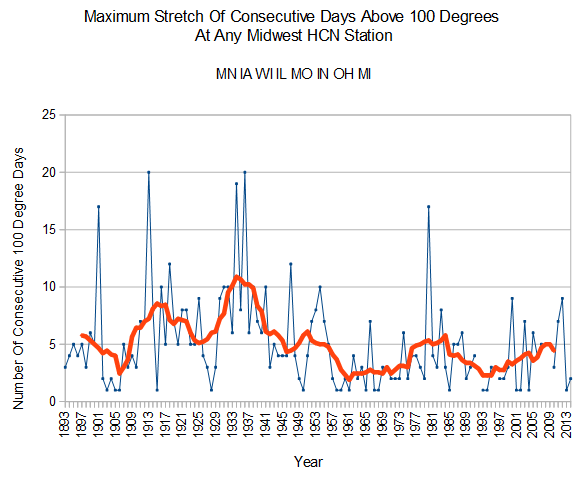
The year 1913 brought the hottest temperature ever recorded on Earth, the longest stretch of days over 100 degrees on record in the Midwest, and 100 degree temperatures in September to Chicago.

ScreenHunter_3017 Sep. 10 17.24

05 Sep 1913 – AMERICAN CLIMATE. RECORD HEAT TEMPERATURES. NEW …

ScreenHunter_4279 Nov. 03 07.07

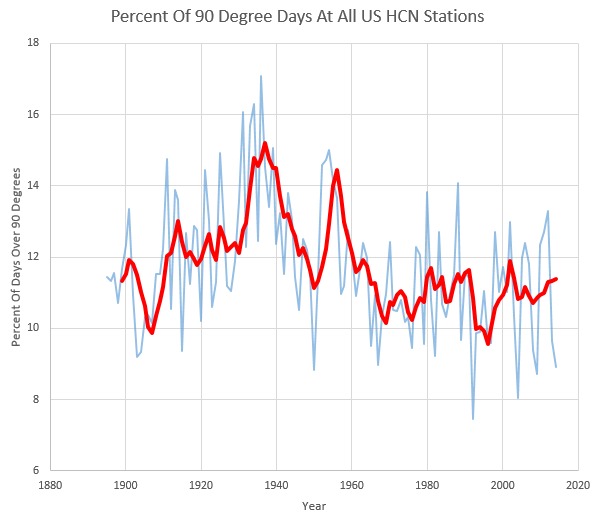
Every single climate indicator shows that September heatwaves used to be much worse.

ScreenHunter_3016 Sep. 10 17.18 ScreenHunter_3015 Sep. 10 17.16 ScreenHunter_3014 Sep. 10 17.14 ScreenHunter_3013 Sep. 10 17.13

Posted in Uncategorized | 11 Comments

More Spectacular Fraud From Joe Romm

The climate mafia now simply lies about everything.

ScreenHunter_3007 Sep. 10 14.00

Labor Day weekend usually means that the U.S. is done with heat waves for the summer. But not this year.

Southern California hit well over 100 degrees Wednesday, putting it easily on its way to a heat wave — which technically means three consecutive days of 90 degrees or more. Citing expected temperatures of 102 to 108 degrees, the National Weather Service put out an “Excessive Heat Warning” Wednesday.

Utter BS. The warmest months of the year on the California coast are almost always September and October. Everyone in California knows that.

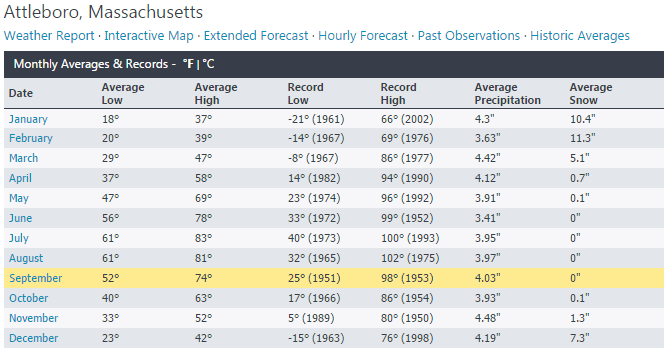
Boston, MA had its first September heat wave in 30 years on Tuesday. Attleboro, MA students returned to school with unseasonably high temperatures, as Tuesday’s high of 96 degrees broke a record for the hottest September day ever measured. Facilities unused to such temperatures during the school year made it difficult for officials keep children from overheating — buildings were only climate-controlled enough to allow students to spend half the day in air-conditioned areas. Nearby Providence, Rhode Island saw its first all-September heat wave in 32 years on Wednesday. Westover, MA hit a record high of 92, and had its first heat wave of the year.

Flagrant lies. Attleboro was 98 degrees in September, 1953.

ScreenHunter_3009 Sep. 10 14.07

Intellicast – Attleboro Historic Weather Averages in Massachusetts (02703)

Almost every September heat record in Massachusetts was set in 1953 or 1969.

ScreenHunter_3008 Sep. 10 14.04Observational data and climate records make clear that heat waves have already increased in duration and intensity. Climate models have shown that heat waves are “virtually certain” to get worse as greenhouse gases warm the planet.

The U.S. Is Still Sweating Out Heat Waves In September. Why? | ThinkProgress

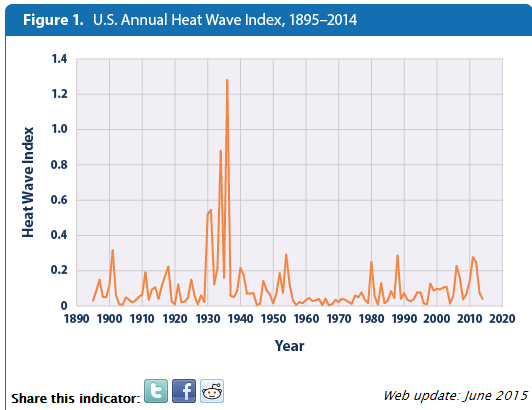
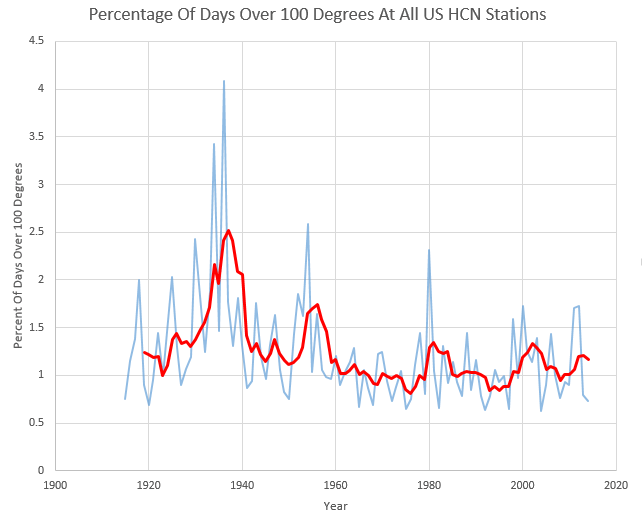
The exact opposite is true. Heatwaves have become much less common in the US, and their duration has become much shorter.

The EPA shows that heatwaves used to be much worse.

ScreenHunter_3010 Sep. 10 14.17

High and Low Temperatures | Climate Change | US EPA

The GHCN temperature record shows that heatwaves used to be much worse in the US.

ScreenHunter_2364 Jun. 10 10.05ScreenHunter_2363 Jun. 10 09.59

ScreenHunter_2888 Sep. 03 14.55

ScreenHunter_2905 Sep. 04 11.10

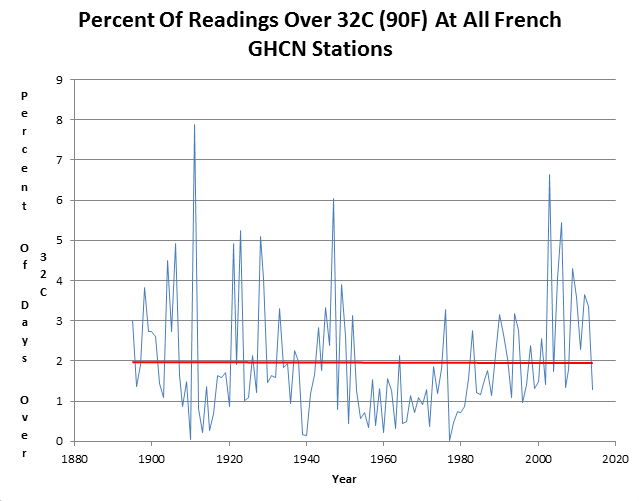
Heatwaves in Europe haven’t changed at all.

ScreenHunter_9873 Jul. 06 13.55

During September, 1925 Harrisburg, Illinois had nine consecutive days over 100 degrees, including five days over 105 degrees.

ScreenHunter_3011 Sep. 10 14.26

Illinois hasn’t had any 100 degree days in any month for the past two years.

Climate criminals are simply making up statistics which are the exact opposite of reality. Heatwaves are becoming much less common and much less intense in the US, as CO2 continues to rise. There is no correlation.

Posted in Uncategorized | 8 Comments

Smoking Gun Of NASA/NOAA Temperature Fraud

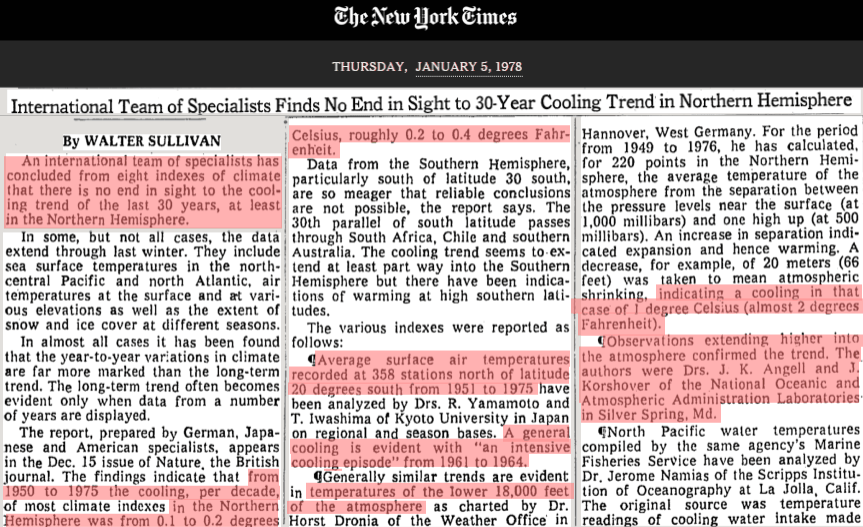
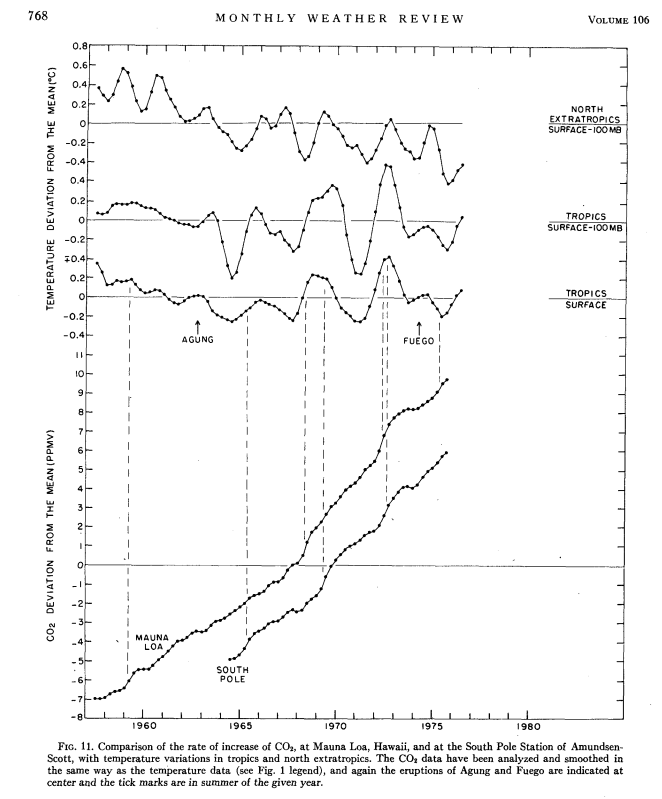
In 1978, every data source showed that earth had been cooling for 30 years.

ScreenHunter_2996 Sep. 10 09.53

TimesMachine: January 5, 1978 – NYTimes.com

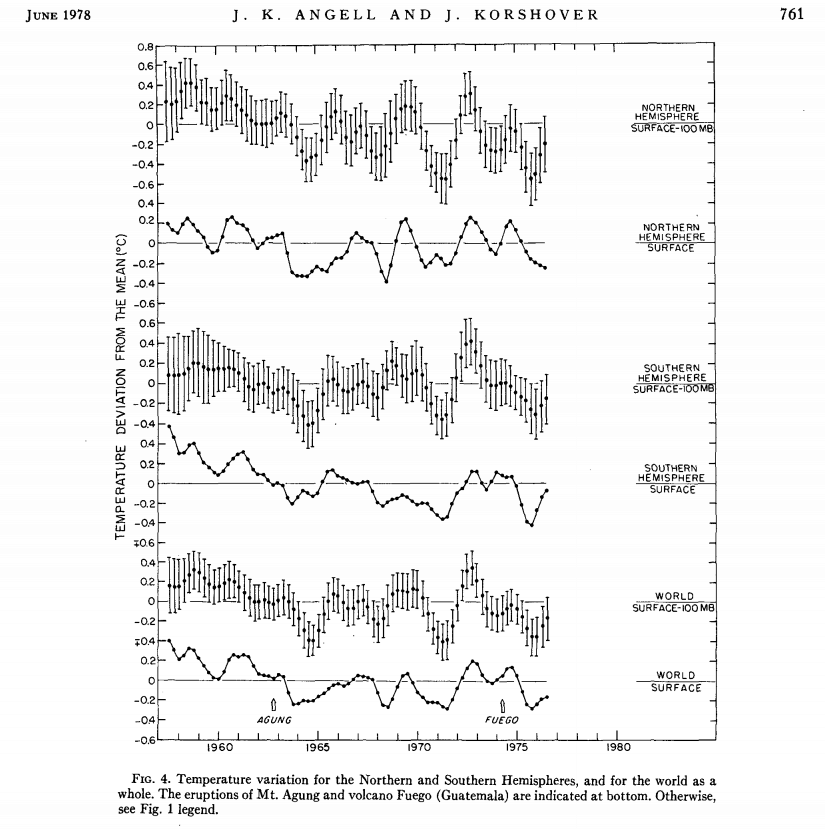
NOAA showed significant cooling at all latitudes, and all levels of the atmosphere.

ScreenHunter_2994 Sep. 10 09.48

journals.ametsoc.org/doi/pdf/10.1175/1520-0493(1978)106<0755%3AGTVSMA>2.0.CO%3B2

NOAA showed that temperatures were decreasing, as CO2 was increasing.

ScreenHunter_2997 Sep. 10 09.54

There wasn’t any doubt that Earth was cooling, but this cooling was not wanted by Al Gore and Barack Obama – so their government agencies simply made the cooling disappear.

Fig.A (1)

Posted in Uncategorized | 27 Comments

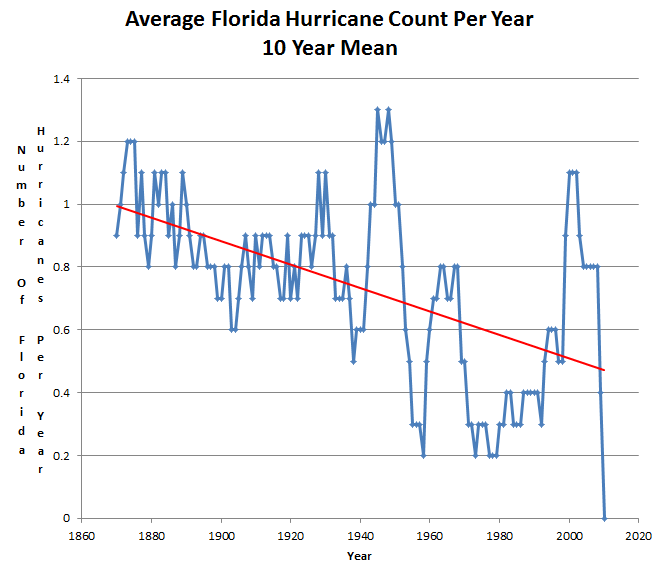
Florida Hurricanes Occur Half As Often As They Used To

ScreenHunter_10418 Sep. 10 06.44

www.aoml.noaa.gov/hrd/hurdat/ushurrlist18512009.txt

In the 1870’s when CO2 was below 300 PPM, Florida averaged one hurricane per year. Now they average one every two years, and have had no hurricane strikes for almost ten years.

President Obama went to Florida a few weeks ago, and told them that increasing CO2 puts them at increased risk of hurricanes. As always, he was lying and talking about things he knows nothing about.

Posted in Uncategorized | 2 Comments

115th Anniversary Of America’s Deadliest Hurricane

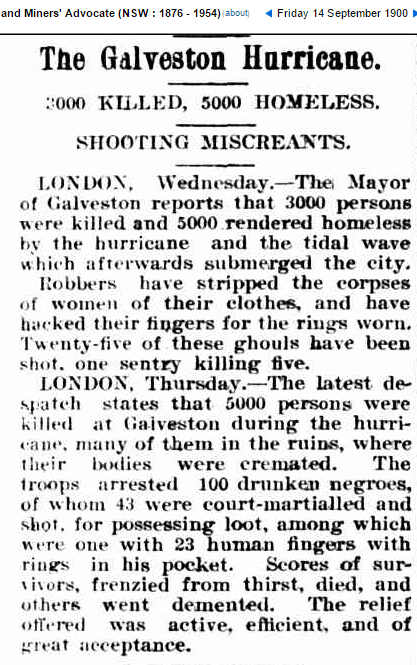
On September 10, 1900, Galveston, Texas was destroyed by a hurricane which killed 10,000 people – almost one third of the population. CO2 was a very safe 300 PPM at the time.

ScreenHunter_10417 Sep. 10 06.28

14 Sep 1900 – INTERNATIONAL NEWS. The Galveston Hurricane. 300…

Ike Galvestons Legacy_Dupr

Posted in Uncategorized | 3 Comments

Where Is The Cooling?

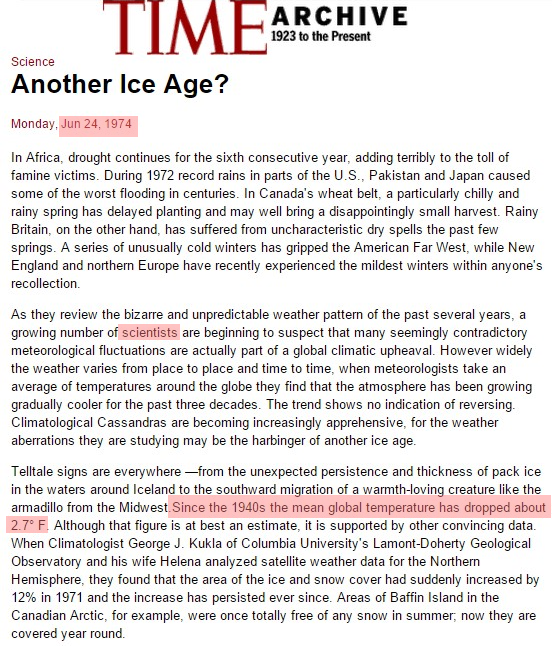
In 1974, scientists reported a large drop in global temperature since the 1940’s.

PaintImage111

TIME Magazine Archive Article — Another Ice Age? — Jun. 24, 1974

In 1961, there was unanimous consensus that Earth was getting colder.

ScreenHunter_2109 May. 31 08.05

ScreenHunter_2110 May. 31 08.05

SCIENTISTS AGREE WORLD IS COLDER   NYTimes.com

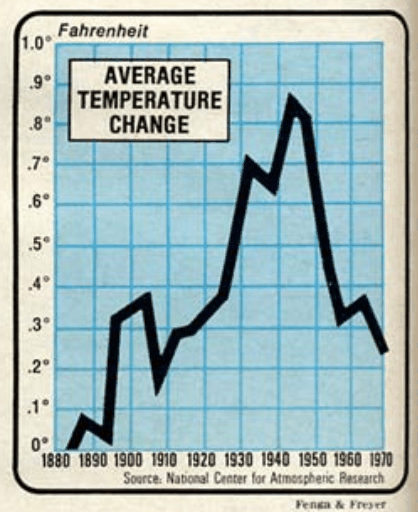
NCAR reported this sharp cooling in 1974.

ScreenHunter_10202 Aug. 26 16.20

denisdutton.com/newsweek_coolingworld.pdf

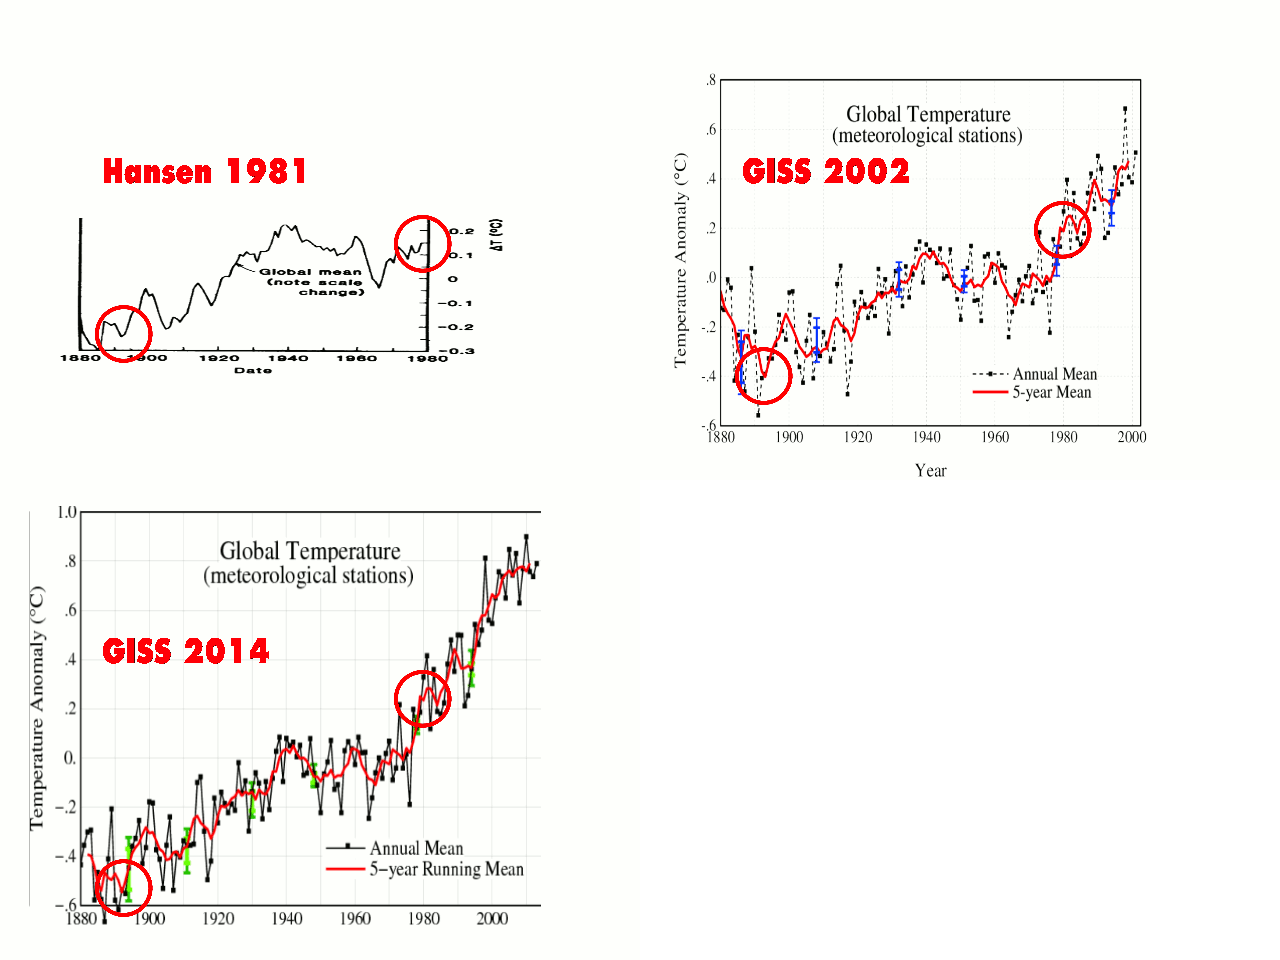
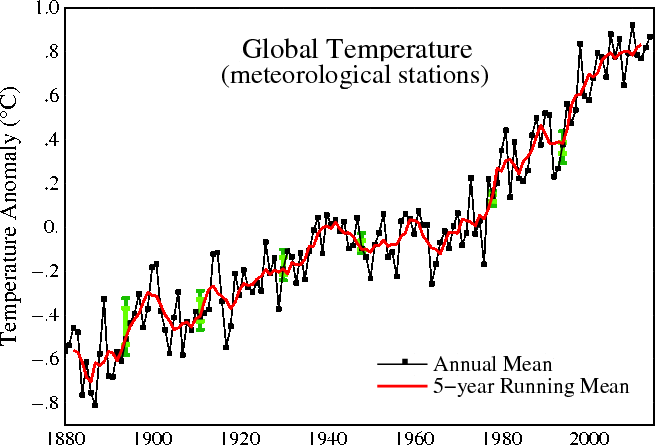
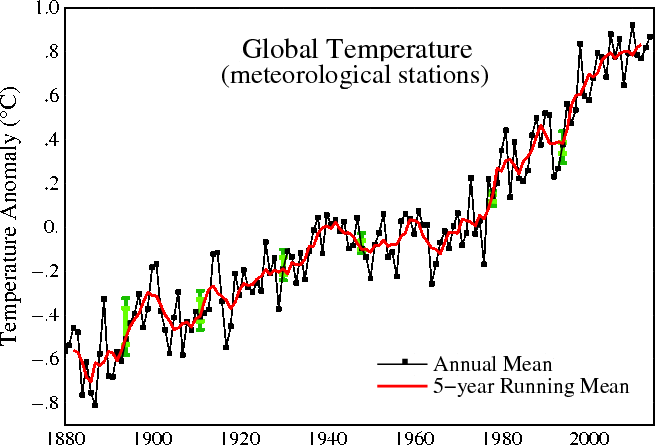
But this drop in temperature no longer appears in NASA graphs.

Fig.A (5)

NASA accomplished this by successively tampering with data to make the decline disappear.

giss-1981-2002-2014-global-

NASA temperature graphs are propaganda, not science. They are completely fraudulent.

Posted in Uncategorized | 3 Comments

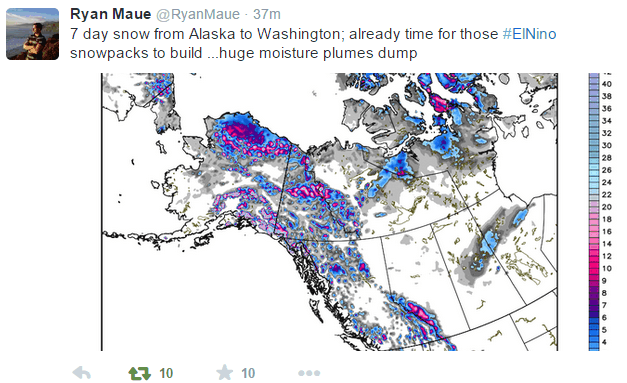
Obama Healed Alaska!

ScreenHunter_10403 Sep. 10 01.18

Posted in Uncategorized | 3 Comments

Starting Graphs In 1979 – World Class Fraud

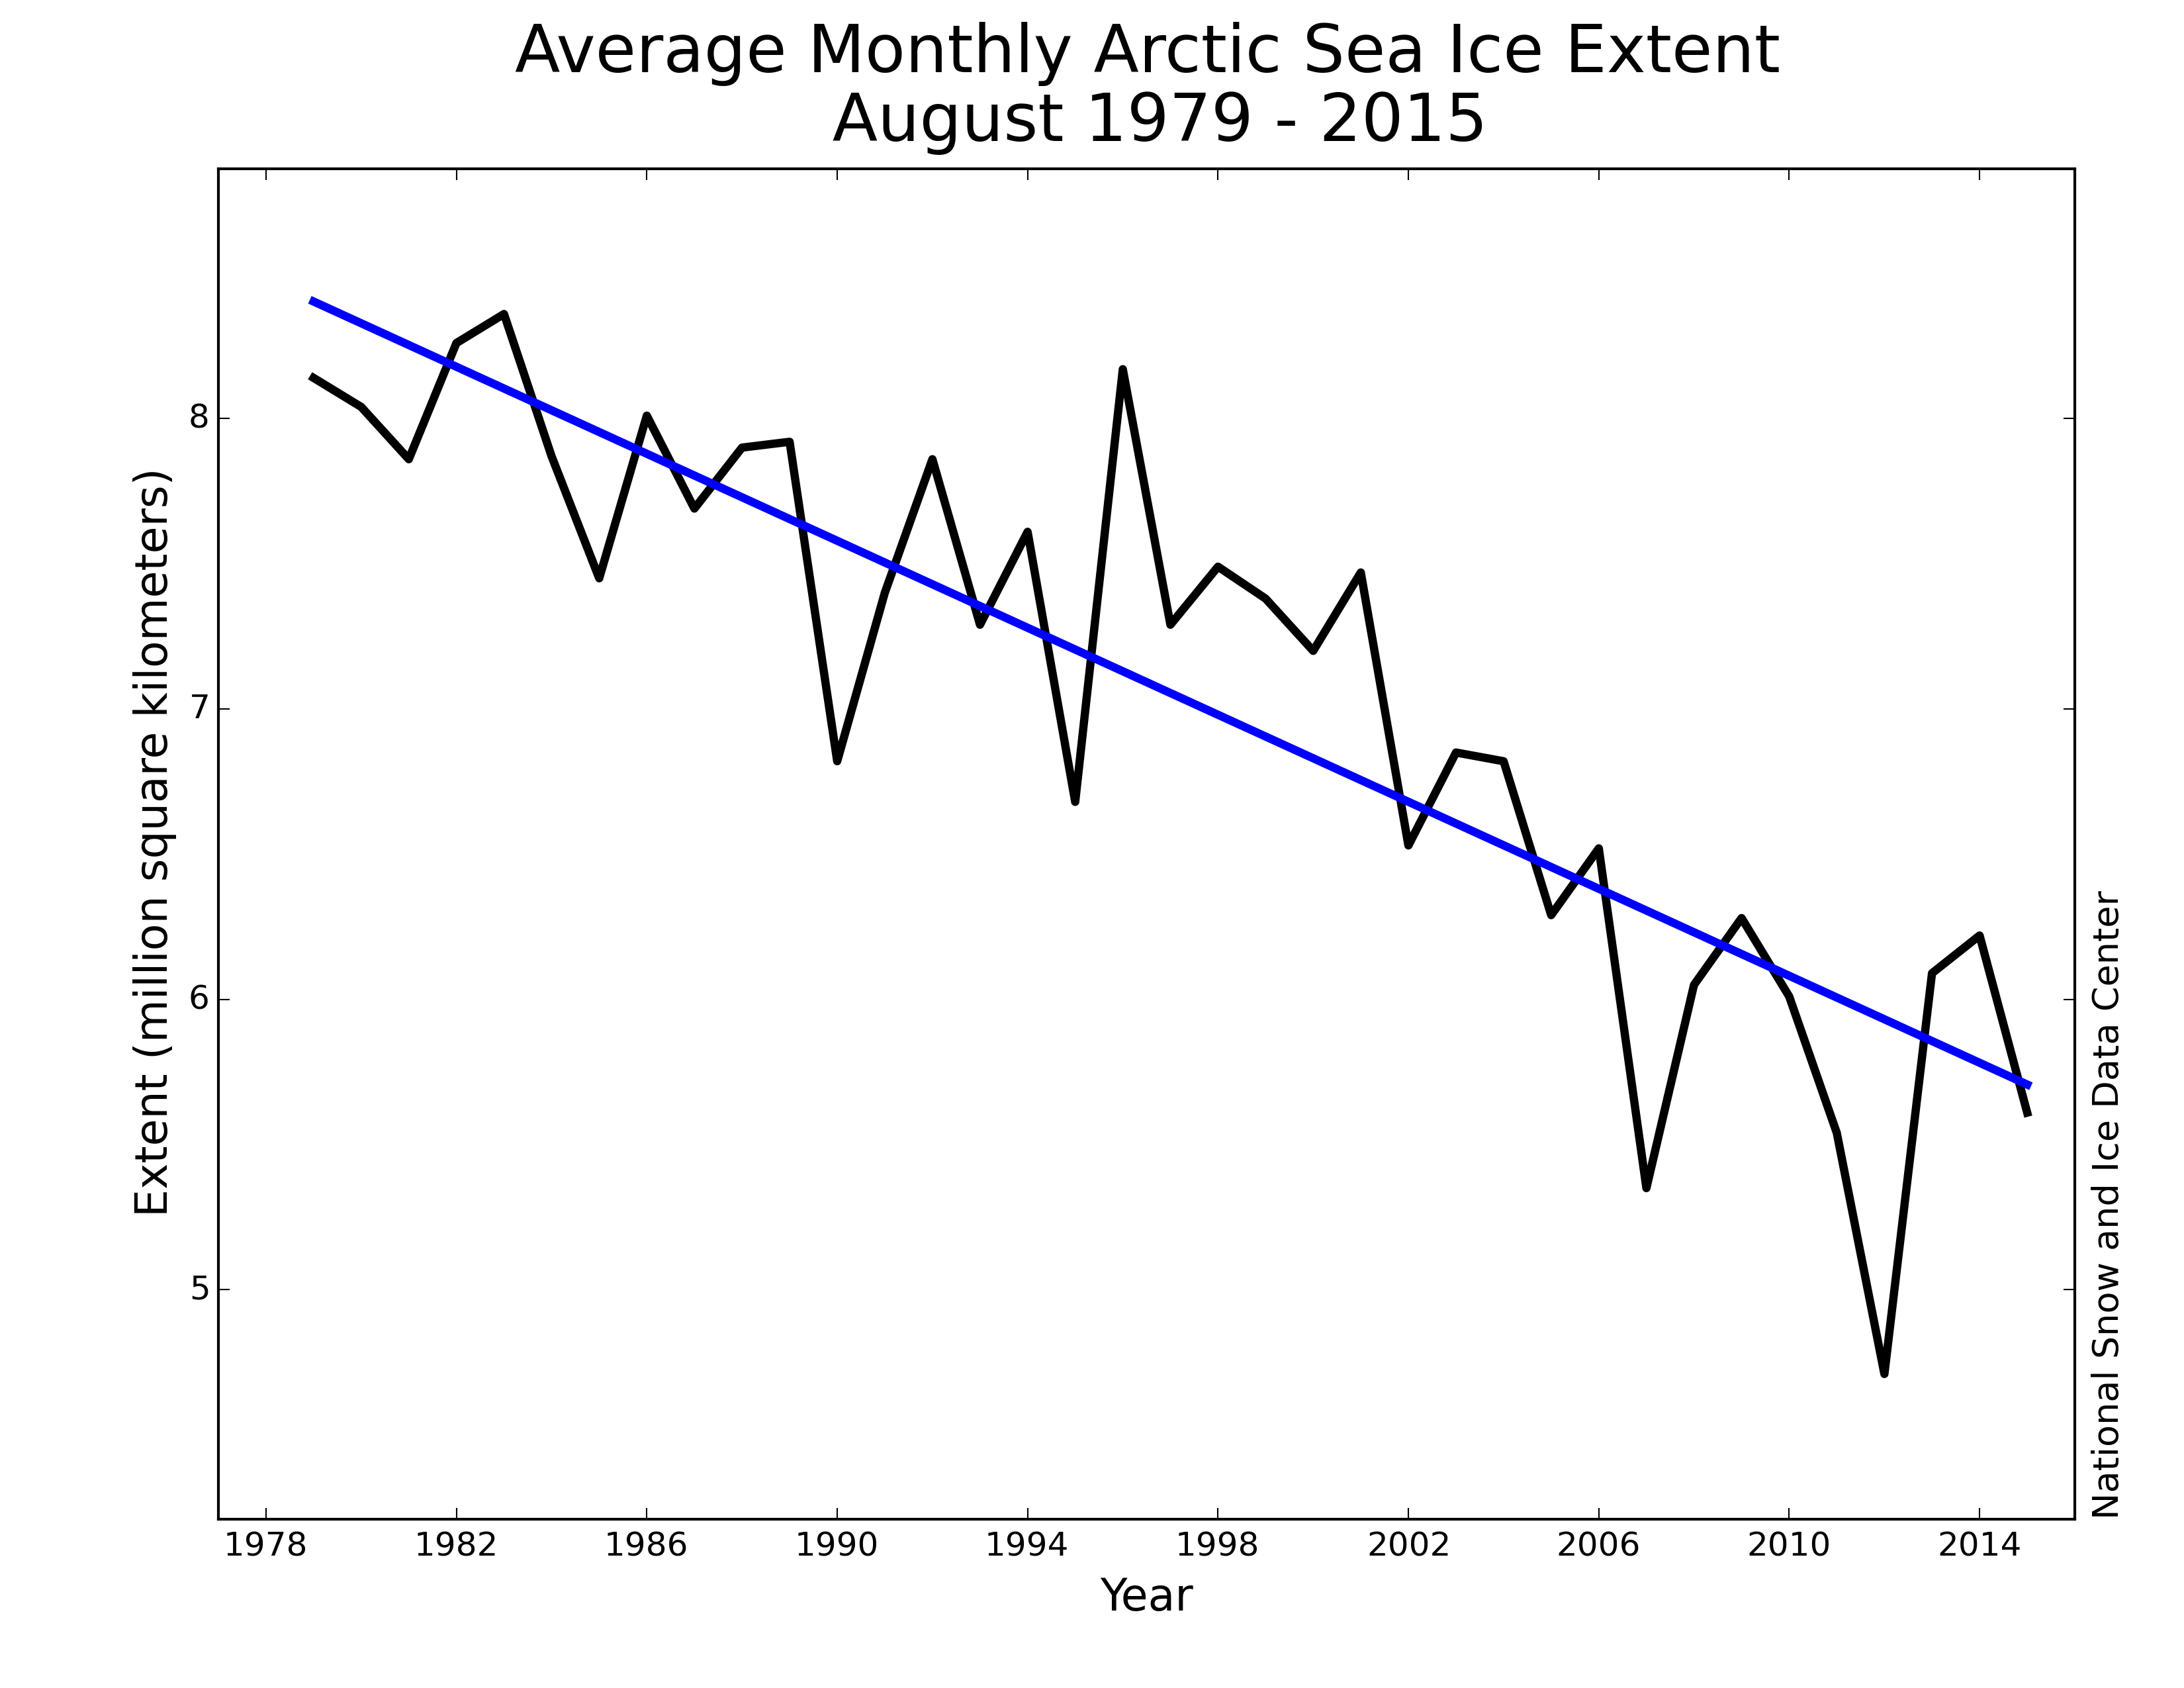
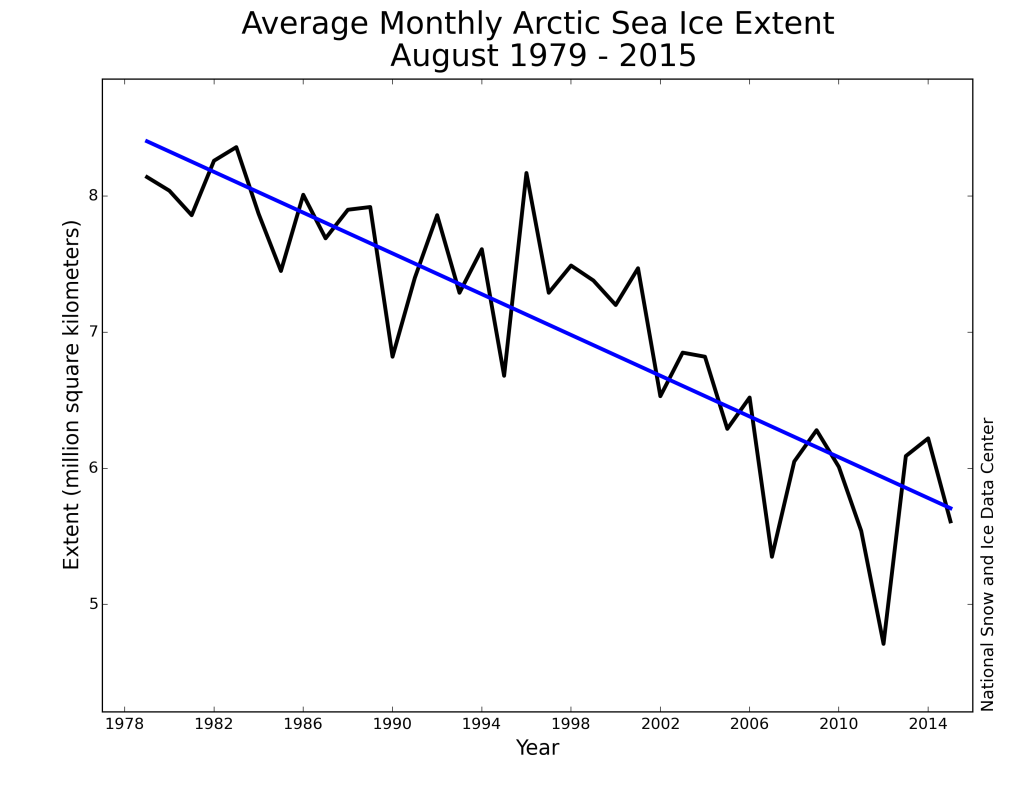
NSIDC publishes graphs like this, so that climate morons can think they are seeing a long term downwards trend of 2 million km² ice loss, and imagine they are really intelligent.
monthly_ice_08_NH

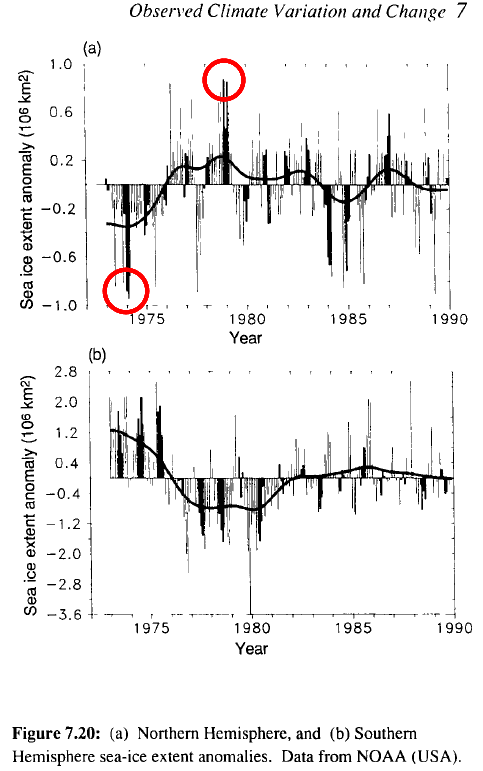
By starting their graphs in 1979, NSIDC is cleverly hiding the two million km² ice gain which occurred prior to 1979. The graph below is from the 1990 IPCC report, and shows the years NSIDC is hiding.
ScreenHunter_10400 Sep. 09 23.54

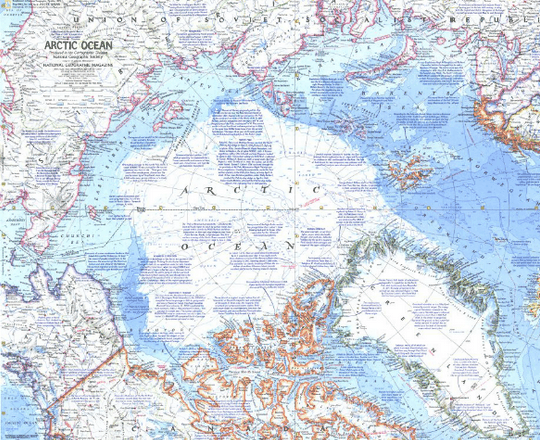
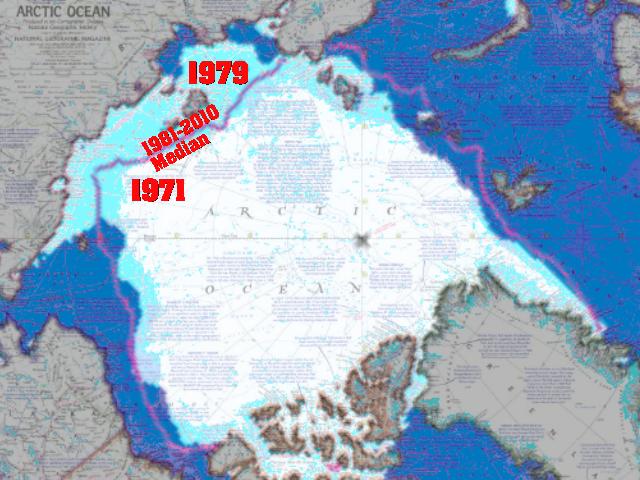
National Geographic published this map in 1971, showing ice extent at the time.
ScreenHunter_10402 Sep. 10 00.31

White below shows  1971 extent. Turquoise shows 1979 extent. The purple line is the 1981-2010 median. As you can see, there was a lot less ice in the early 1970’s than at NSIDC’s cherry picked start date of 1979.
AnimationImage97

Had NSIDC begun their graph in 1971, it would be clear that Arctic sea ice is cyclical, not the fake linear trend they are scamming people with.

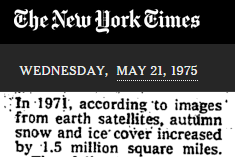
But it is worse than it seems – 1971 ice was 1.5 million km² larger than the year before, and there are satellite images.
ScreenHunter_10401 Sep. 10 00.09

TimesMachine: Scientists Ask Why World Climate Is Changing; Major Cooling May Be Ahead; Scientists Ponder Why World’s Climate Is Changing; a Major Cooling Widely Considered to Be Inevitable – NYTimes.com

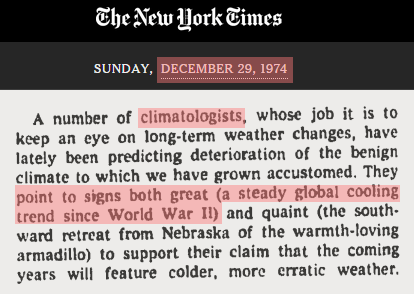
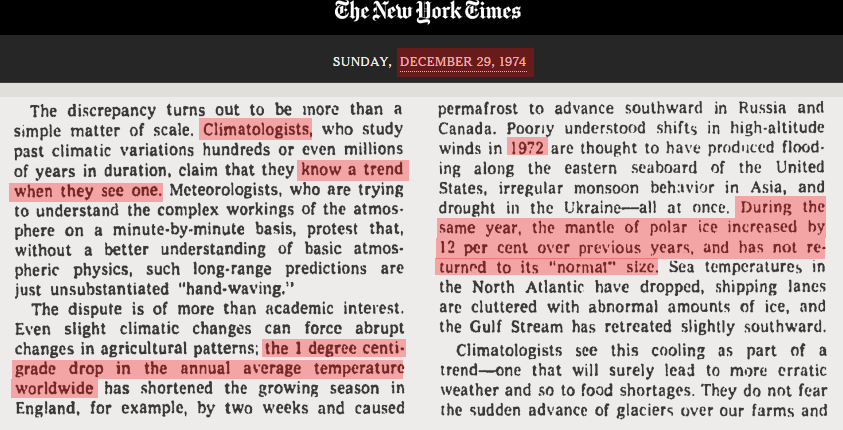
Ice cover increased by 12% in 1972, and climatologists reported a global 1°C drop in temperature since WWII.
PaintImage102

ScreenHunter_10405 Sep. 10 05.13

TimesMachine: December 29, 1974 – NYTimes.com

So why does NSIDC ignore years before 1979? Starting their graphs in 1979 is wildly misleading, and blatant scientific malfeasance. There is plenty of imagery available back to the 1960’s which they could use to extend a monthly ice graph, as the IPCC did in 1990.

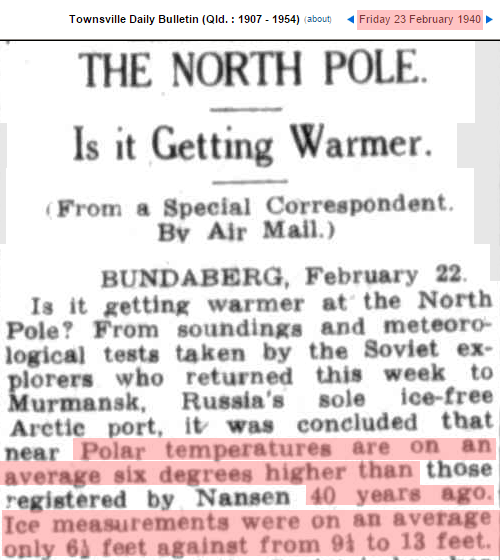
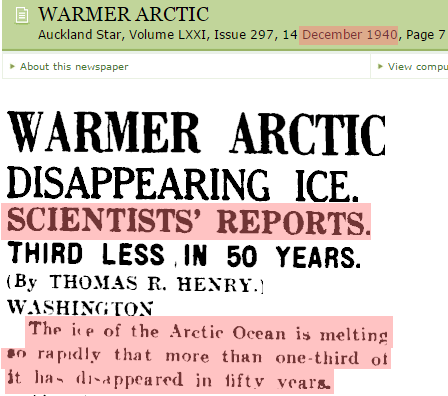
But it is even worse than that. The Arctic was very warm and lost half its ice volume by 1940, prior to the period of 1940-1970 cooling and ice increase.

 Polar Meltdown

PaintImage104

23 Feb 1940 – THE NORTH POLE. Is it Getting Warmer. | BUNDABER…
PaintImage107

Papers Past — Auckland Star — 14 December 1940 — WARMER ARCTIC

NASA (who funds NSIDC) doesn’t want you to know about the warm Arctic in 1940, so they simply made it disappear. NSIDC graphs start in 1979, which was the coldest year on record in Iceland. Cherry-picking doesn’t get any worse than what they did.
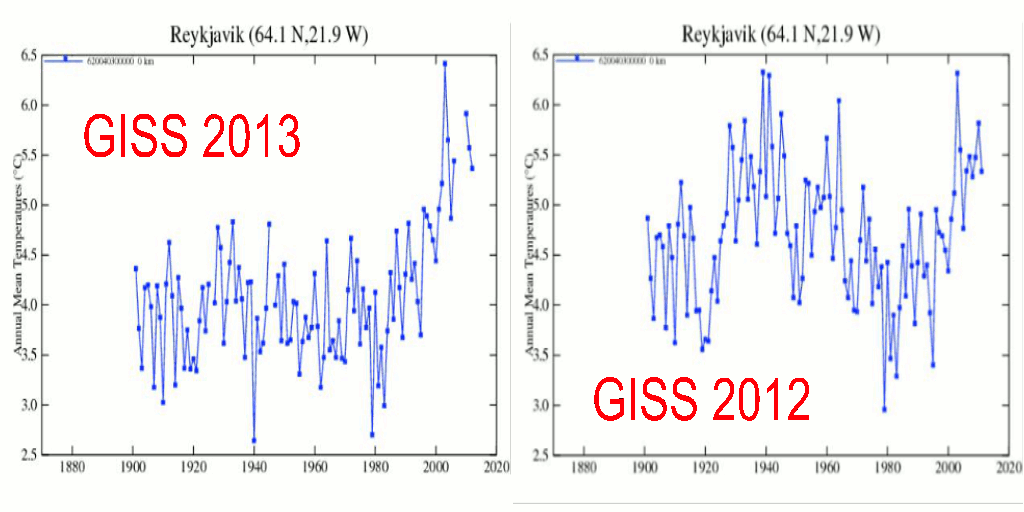
ReykjavikGISS2012-2013

NASA has completely erased the global 1°C drop in temperature from WWII to 1974.
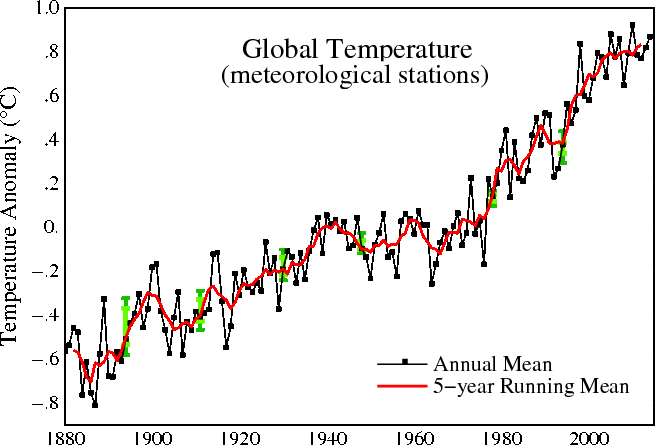
Fig.A (4)

giss-1981-2002-2014-global-

So next time someone tells you that NSIDC graphs show a “long term trend” – tell them to come here and get their facts straight. Vikings farmed Greenland in the 12th century, where it is too cold to farm outdoors now. NSIDC is ignoring key data, and NASA is actually altering data.

Posted in Uncategorized | 12 Comments