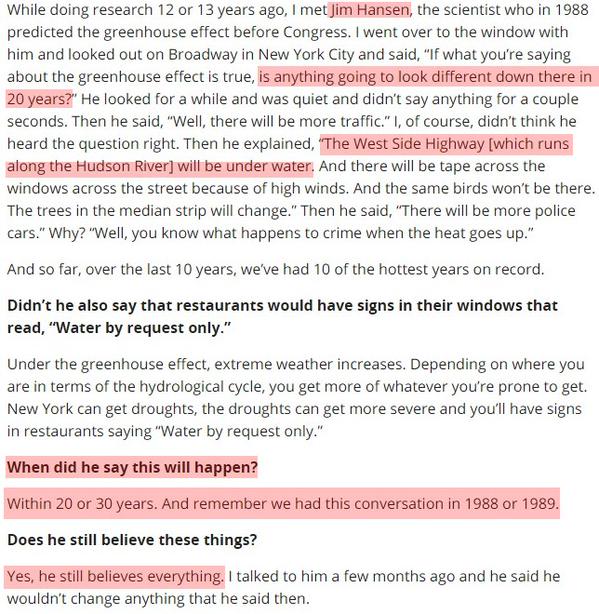
Three Years Until Manhattan And The Maldives Drown

Experts say the 1200 islands of the Maldives will disappear by 2018.

B9N_uIQCUAEXzU5

26 Sep 1988 – Threat to islands

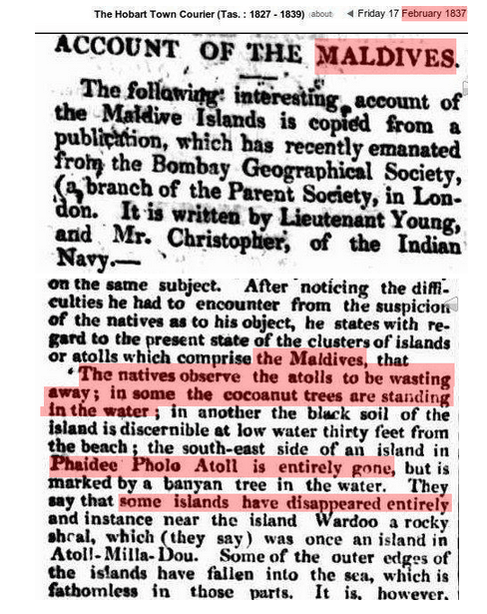
This is probably not going to happen, but the Maldives were disappearing in 1837.

CInTo4EUcAA3kKl

17 Feb 1837 – ACCOUNT OF THE MALDIVES.

Experts also say that Manhattan will drown by the year 2018.

CGoEaf-UgAARsS0Stormy weather – Salon.com

One might come to the conclusion that climate experts are complete morons.

Posted in Uncategorized | 12 Comments

More Detail On Gavin Hiding The Hiatus

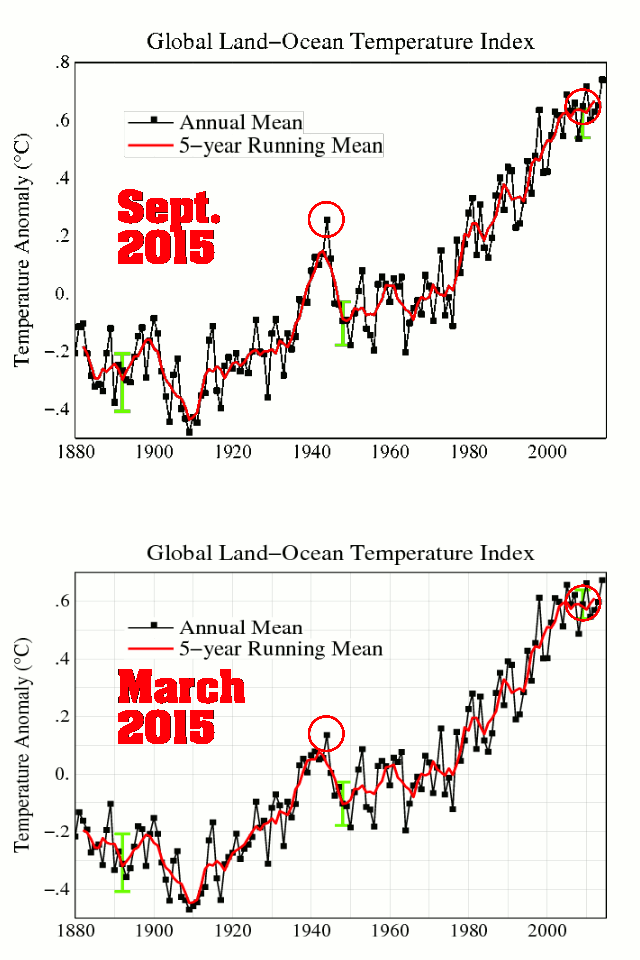
Apparently word came down to Gavin a few months ago that the global warming hiatus had to disappear. So he did that, by simply altering the data – outside of his own green error bars. Legitimate scientists don’t do that.

GISSFigA2ErrorBarChanges-Sept2005-March2015-Sept2015

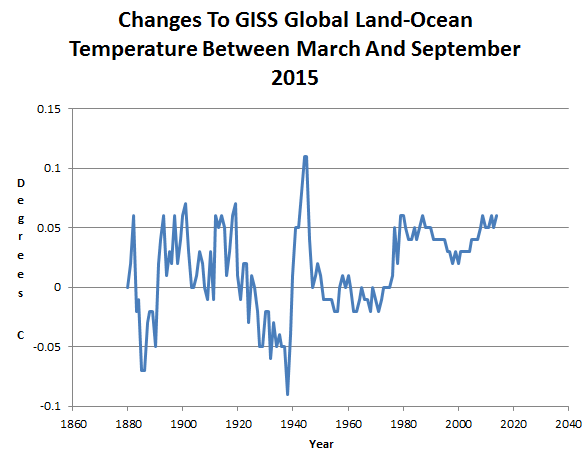
GISSFigA2Changes-March-Sept2015

NOAA and NASA are getting bolder and bolder with their temperature fraud. They apparently believe that they can get away with anything.

ScreenHunter_10394 Sep. 07 23.30

Posted in Uncategorized | 7 Comments

NASA Shows Only 0.5C Warming Since 1944

NASA is constantly tampering with their data to cool the past and warm the present – in order to make the hiatus disappear.

GISSFigA2Changes-Sept2005-March2015-Sept2015

But one interesting thing is that they now show 2014 less than 0.5C warmer than 1944.

Fig.A2 (4)

The stated goal of climate fraudsters to stay under 2C warming based on fake NASA data, seems to be happening.

Posted in Uncategorized | 1 Comment

Gavin’s Tangled Web

Gavin is digging his hole deeper and deeper. In order to get rid of the hiatus for his boss Barry, he bumped up all recent temperatures. Note in the animation below that since March he has moved recent years outside his March error bar. He must be under a lot pressure from the White House to do something so blatantly dishonest, though it is not the first time he has done that.

But something else interesting is going on. Having been called out for making the 1940’s blip disappear, he is apparently trying to bring it back. Note that he has increased 1940’s temperatures by a large amount since March, once again outside the error bar.

From: Tom Wigley <[email protected]>
To: Phil Jones <[email protected]>
Subject: 1940s
Date: Sun, 27 Sep 2009 23:25:38 -0600
Cc: Ben Santer <[email protected]>

It would be good to remove at least part of the 1940s blip, but we are still left with “why the blip”.

di2.nu/foia/1254108338.txt

GISSFigA2Changes-March-Sept2015

The overall data tampering since March is quite spectacular, with the apparent goals of making the hiatus disappear, and trying to cover his tracks with the previous disappearance of the 1940’s blip.

ScreenHunter_10394 Sep. 07 23.30

Posted in Uncategorized | 16 Comments

More On The Mind-Blowing NOAA CEI Fraud

NOAA claims that 2012 was the most extreme weather year on record in the US.

ScreenHunter_10361 Sep. 07 07.48

U.S. Climate Extremes Index (CEI): Graph | National Centers for Environmental Information (NCEI)

In fact, it was one of the quietest years on record for extreme temperatures. One year does stand out as extreme, and that was 1936 – which had by far the largest number of very hot and very cold days.

ScreenHunter_10392 Sep. 07 22.36

What NOAA did, was they (double) counted mild winter and spring days in 2012 as being “extreme.” They added one extreme count for mild winter days, and another for mild winter nights.  You just can’t make up fraud like this – it requires a concerted effort of government criminals to come up with something so insidious.

War is peace
Freedom is slavery
Ignorance is strength
Mild Is extreme

Posted in Uncategorized | 5 Comments

If You Build A House In The Sand, It Will Sink

Barack Obama is now an authority on permafrost.

20150905_USP001_0

Thirty Alaskan native villages on the coast are about to disappear into frigid waters; 12 are considering moving altogether. As sea ice melts earlier and forms later, more open water is left in the Chukchi and Bering Seas and the Arctic Ocean (which surround Alaska). Storms are larger and wreak more damage as a result (because ice protects the shoreline). And thawing permafrost, on which many villages are built, worsens matters by causing homes to sink towards calamity and releasing methane into the atmosphere.Climate is changing faster than our efforts to address it,” Barack Obama said at a conference on climate change in the Arctic on August 31st. Lee Stephan, president of the Tribal Council of Eklutna, a native village, agreed: “If all the ice on Mother Earth melts we will all live in water,” he said.

Greenhouse gases bear the blame; America alone produces 15% of global carbon-dioxide emissions.

Tales of Atlantis | The Economist

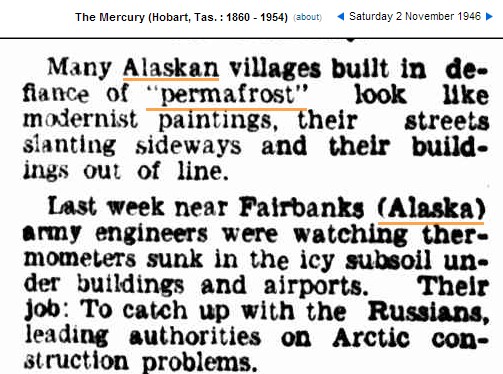
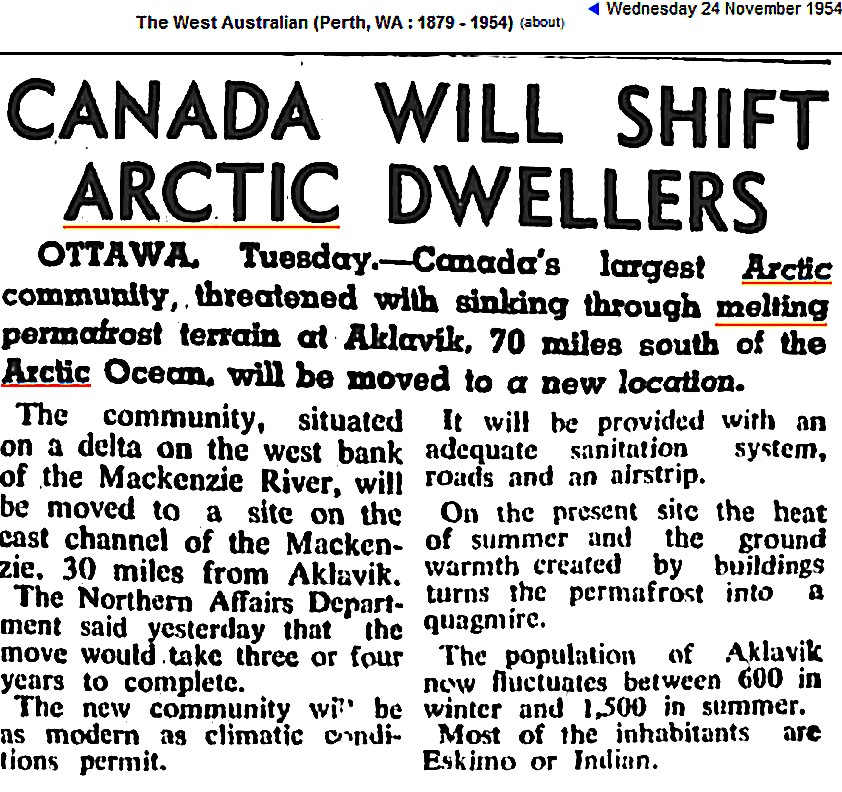
Unbelievable stupidity on the part of Obama and The Economist. Alaskan villages built on permafrost have been melting for as long as people have been stupid enough to build villages on permafrost.

ScreenHunter_1458 Oct. 13 14.11

02 Nov 1946 – NEWSFRONTS OF THE WORLD The Frozen North Was Not…

24 Nov 1954 – CANADA WILL SHIFT ARCTIC DWELLERS

And to make matters worse, these villages are built on sand/gravel bars which have been shifting since the dawn of gravel bars.

“It isn’t so much that liberals are ignorant. It’s just that they know so many things that aren’t so.”  

? Ronald Reagan

Posted in Uncategorized | 10 Comments

NCAR Video Demonstrates Why Climate Science Is A Complete Farce

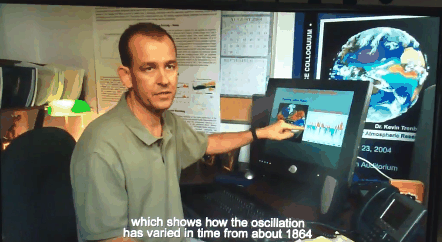
I rode up to NCAR earlier and went into their museum for my Trenberth provided weekly comedy. I was not disappointed.

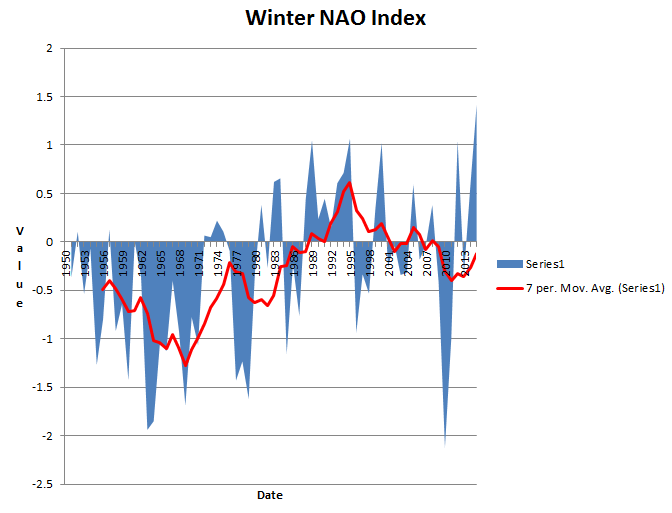
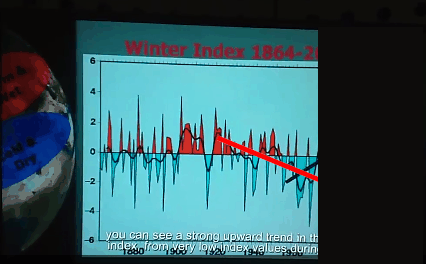
This video explained how the North Atlantic Oscillation (NAO) affects winter temperatures in Canada and Europe. That part of the video was interesting and informative.

ScreenHunter_10376 Sep. 07 16.07

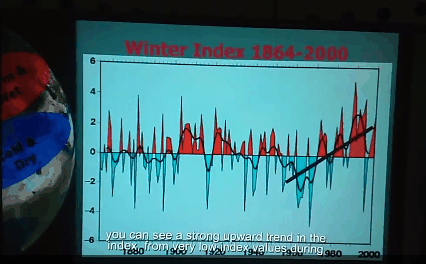
But then the stupidity began. This guy cherry-picked an interval starting in 1975 and ending in 2000 – which he blamed on CO2.

ScreenHunter_10377 Sep. 07 16.09

Had he included the entire time series, the audience would have seen that the NAO plummeted from 1995 to 2010, making his assertion about CO2 affecting the NAO completely mindless and absurd.

ScreenHunter_10373 Sep. 07 16.04

ftp://ftp.cpc.ncep.noaa.gov/wd52dg/data/indices/nao_index.tim

Had he wanted to prove global cooling, he could have done the same trick starting in 1930 and ending in 1975.

PaintImage60

These are our country’s top climate scientists – and they would all fail freshman engineering classes for dishonesty and incompetence.

Posted in Uncategorized | 9 Comments

Scientists Recycling The Identical Sea Level Fraud – Every Generation

Thirty years ago, scientists predicted one meter sea level rise in 60 years.

ScreenHunter_10371 Sep. 07 11.06

31 Aug 1986 – Sea level ‘to rise metre in 60 years’

How did that brainless forecast turn out? Sea level at Adelaide has hardly changed for 40 years.

ScreenHunter_10369 Sep. 07 11.05

And thirty years later, NASA is recycling the same brainless forecast – which has no basis in science or reality.

ScreenHunter_10372 Sep. 07 11.10

Global warming: NASA reveals Greenland ice shelf melting fast

These people are criminals, lying to you and using scare tactics to extort your money. Will you listen to them, or will you call them out for being the scumbags that they are?

Posted in Uncategorized | 10 Comments

Visualizing Extreme Climate Fraud At NOAA

According to NOAA, 2012 was the most extreme year on record in the US. The fraud which goes into making the Climate Extremes Index is breathtaking.

ScreenHunter_10361 Sep. 07 07.48

U.S. Climate Extremes Index (CEI): Graph | National Centers for Environmental Information (NCEI)

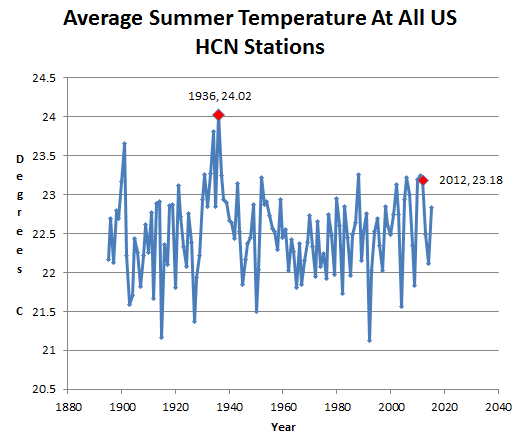
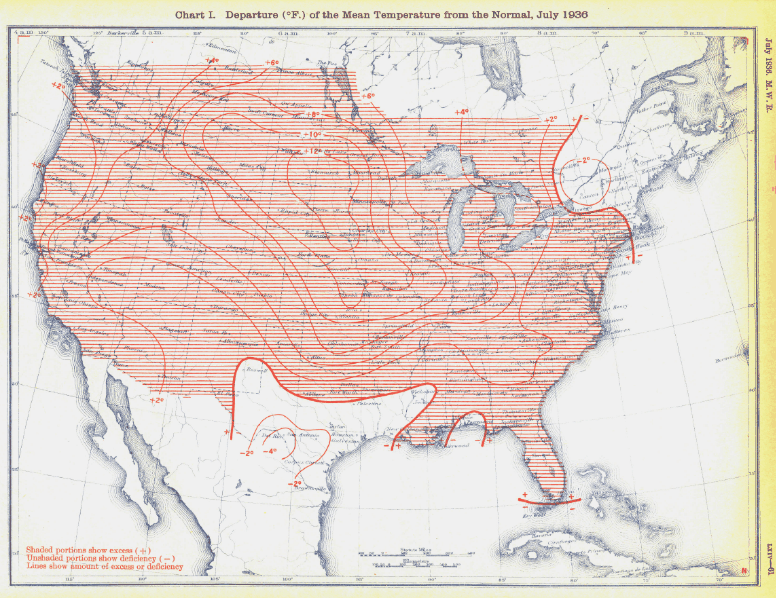
Let’s look at the actual data of 2012 vs. 1936. The summer of 1936 was the hottest on record in the US – nearly 1°C warmer than 2012.
 ScreenHunter_10357 Sep. 07 07.01

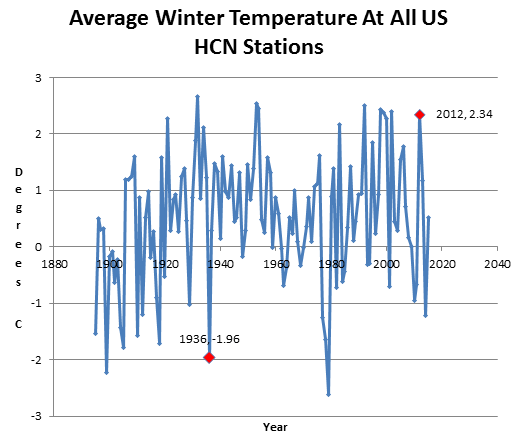
The winter of 1936 was the third coldest on record in the US – more than 4°C colder than winter 2012 – which was very mild.
ScreenHunter_10358 Sep. 07 07.01

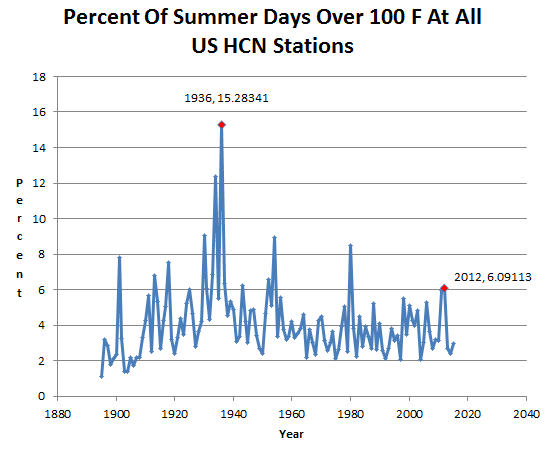
One hundred degree temperatures occurred more than twice as often  in 1936 as they did in 2012 – which wasn’t even in the top ten.
ScreenHunter_10360 Sep. 07 07.10

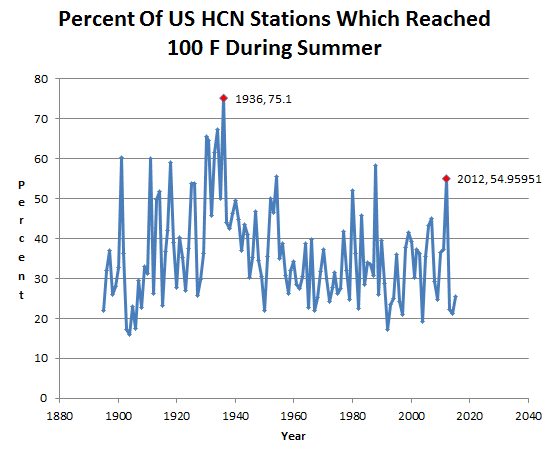
More than 75% of the country reached 100 F in 1936, compared to 55% in 2012 – which wasn’t in the top five.
ScreenHunter_10359 Sep. 07 07.09

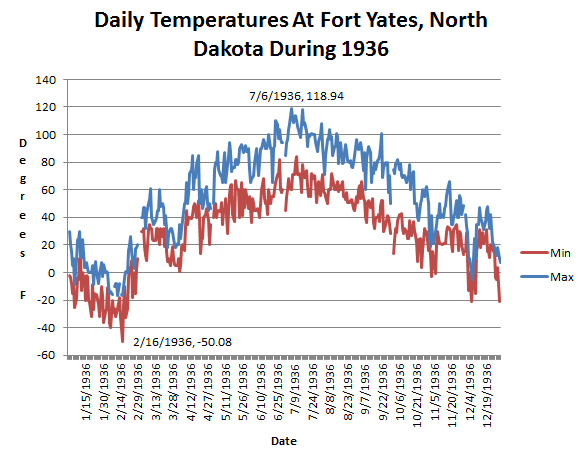
During 1936, Fort Yates, North Dakota had an incomprehensibly large 169 degree spread in temperatures, from -50F on February 16, to 119F on July 6.
ScreenHunter_10352 Sep. 07 06.26

The high plains were twelve degrees above normal temperature in July, 1936
 Below350.org

Continue reading

Posted in Uncategorized | 9 Comments

Saving Africa From Global Cooling

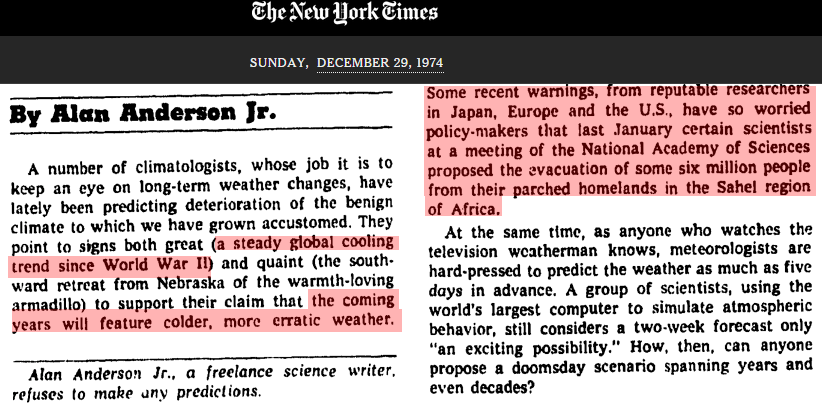
In 1974, the National Academy of Sciences wanted to evacuate six million people in the Sahel – to save them from global cooling.

ScreenHunter_10341 Sep. 06 18.42TimesMachine: December 29, 1974 – NYTimes.com

Posted in Uncategorized | 17 Comments