Part Two Of Greg’s Delusion

Greg believes that 100 degree days occur more often now in Missouri, when in fact the exact opposite is true.

ScreenHunter_2787 Aug. 28 14.06

August 28, 2015 at 4:07 pm

One hundred degree days occur about half as often as they did in the 19th century, and the hottest summer Greg experienced was his very first one, in 1954.

ScreenHunter_2796 Aug. 28 18.28

Greg has demonstrated how mass brainwashing through suggestion works.

Posted in Uncategorized | 7 Comments

A Case Study In Climate Delusion

An amazing story of delusion, from a person who imagines he remembers things from his past.

ScreenHunter_2787 Aug. 28 14.06

August 28, 2015 at 4:07 pm

Winter temperatures in Missouri have dropped during Greg’s life. His first winter was his warmest. It was 78 degrees on February 14, 1954.

ScreenHunter_2788 Aug. 28 14.18

U.S. Historical Climatology Network

Let’s compare Greg’s first winter with his most recent one. The winter of 1953-1954 averaged 3.42C in Jefferson City, compared to -0.54C in 2015. Year to date, 1954 was seven degrees Fahrenheit warmer than 2015

ScreenHunter_2786 Aug. 28 14.02

Greg believes there is a climate crisis, based on his faulty memory. He also believes that by cutting off the fuel supplies which keep him alive during the winter, he can fix his imaginary climate crisis.

Nothing ever changes:

ScreenHunter_1858 Jan. 15 22.36

10 Jan 1871 – IMAGINARY CHANGES OF CLIMATE. (Pall Mall Gazette.)

Posted in Uncategorized | 16 Comments

Hot Days Occurring Less Frequently In Australia

ScreenHunter_10210 Aug. 28 09.10

Contrary to the lies of climate criminals, hot days in Australia have become less frequent, not more frequent.

Posted in Uncategorized | 3 Comments

Sea Level Fraud – Worse Than It Seems

Currently active NOAA tide gauges average 0.63 mm/year sea level rise, or two inches by the year 2100.

ScreenHunter_2784 Aug. 28 08.42Sea Level Trends – MSL global stations trends table

The fraudsters at the University of Colorado claim five times that much. Eighty-seven percent of tide gauges are below CU’s claimed rate.

sl_ns_global

CU Sea Level Research Group | University of Colorado

And the criminals at NASA are claiming 20 times that much rise by the year 2100. Fraud is the new normal for academic and government science.

Sea level is not changing by a perceptible amount. This criminal activity needs to be stopped by Congress.

1960

ScreenHunter_4022 Oct. 25 08.20 

2014

ScreenHunter_4023 Oct. 25 08.22

‘Where the Boys Are’ Disproves Rising Seas Scare

Posted in Uncategorized | 20 Comments

Settled Science

Run away!

ScreenHunter_2781 Aug. 28 08.13

Meanwhile, back in the real world

ScreenHunter_2782 Aug. 28 08.14

Posted in Uncategorized | 15 Comments

Hot Days In Illinois Are A Thing Of The Past

Prior to 1960, 100 degree days were very common in Illinois, but they rarely happen any more.

ScreenHunter_2778 Aug. 27 19.01

The reason you don’t hear about this from government climate scientists, is because they are criminals pushing the White House global warming agenda – not actual scientists.

Posted in Uncategorized | 7 Comments

More On The Breathtaking NCAR Museum Climate Fraud

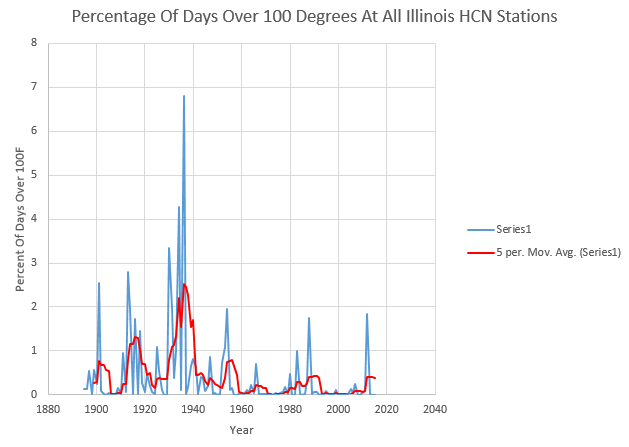
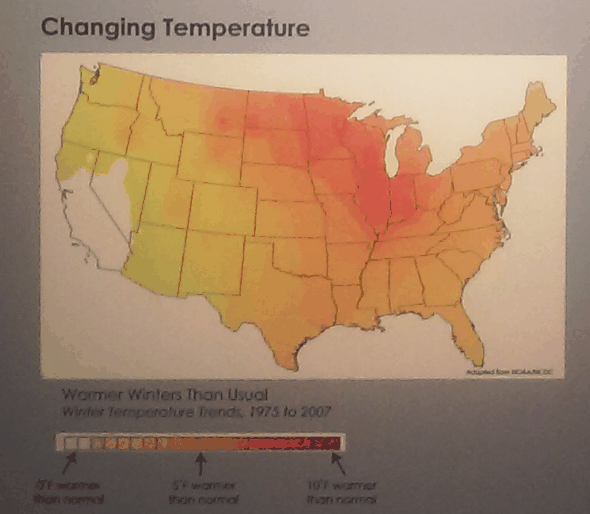
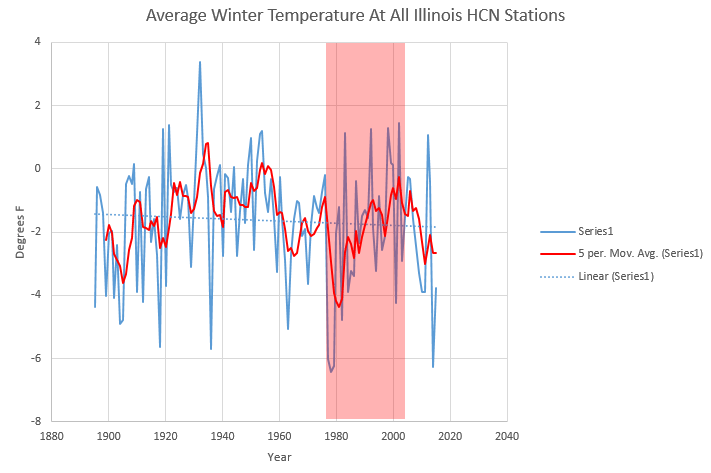
As I showed yesterday, NCAR has this map showing a huge amount of winter warming in Illinois.

ScreenHunter_10201 Aug. 26 16.12

The map is fairly precise, and 100% fraudulent at the same time. Winter temperatures in Illinois did indeed rise significantly from 1975 to 2007.

ScreenHunter_2771 Aug. 27 15.17

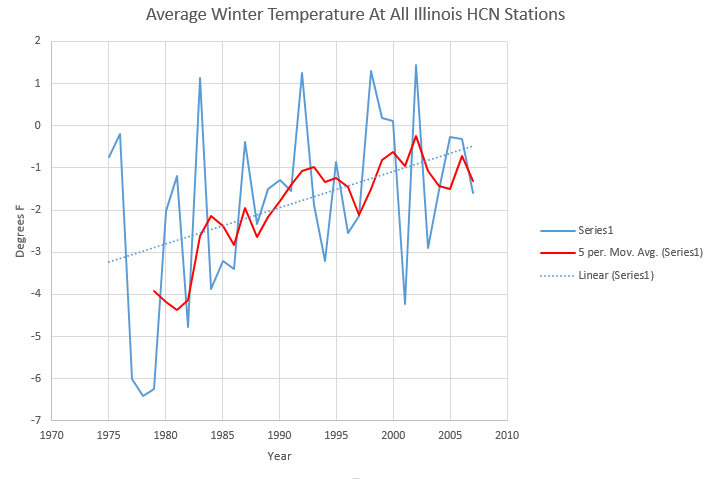
But the long term trend is down. They intentionally cherry picked A thirty year warming period, in order to defraud their visitors into believing that a non-existent warming phenomenon is happening in Illinois.

ScreenHunter_2772 Aug. 27 15.35

Illinois has been having very cold winters, with record amounts of ice on the Great Lakes.

Ice coverage on the Great Lakes reached 85.4 percent on Feb. 18, marking the second winter in a row that ice coverage has exceeded 80 percent. This figure has fluctuated up and down slightly since then and was at 88.8 percent as of Feb. 28. Of course, last year the Great Lakes went on to record their second highest total ice coverage in records dating to 1973.

Great Lakes Ice Coverage Tops 80 Percent in Consecutive Years For First Time Since 1970s – weather.com

The NCAR claim is flat out fraud, with no scientific value – and specifically intended to mislead their visitors.

Posted in Uncategorized | 15 Comments

Today’s Sea Level Fraud From NASA

Check out this moronic headline in the LA Times

ScreenHunter_2767 Aug. 27 13.16

New satellite measurements from NASA suggest that ocean levels could rise by 3 feet or more globally by the end of the century. The question faced by scientists and policymakers is not whether oceans will rise, but how fast and by how much.

“People need to be prepared for sea level rise,” said Joshua Willis, an oceanographer at NASA’s Jet Propulsion Laboratory in La Cañada Flintridge. “It’s not going to stop.”

Sea levels will rise, experts warn, and ‘it’s not going to stop’ – LA Times

Of course sea level is going to rise. It has been rising for 20,000 years – most of that time faster than now. Sea level will stop rising when we enter the next ice age.

Post-Glacial_Sea_Level (1)

NOAA Tide gauges indicate that global sea level will rise about four inches by 2100, not 40 inches.

ScreenHunter_2763 Aug. 27 12.31

Sea Level Trends – MSL global stations trends table

These fraudsters at NASA are pimping mindless and fraudulent propaganda for the White House, with no basis in science. Sea level in the San Francisco Bay is the same as 70 years ago.

ScreenHunter_2768 Aug. 27 13.24

http://www.psmsl.org/data/obtaining/stations/437.php

Posted in Uncategorized | 13 Comments

Today’s Fraud Focus – Sea Level

The University of Colorado claims that sea level is rising 3.3 mm/year.

sl_ns_global

CU Sea Level Research Group | University of Colorado

Boulder is the epicenter of climate fraud, and this is no exception. 85% of NOAA tide gauges show less than 3.3 mm/year, and the average is 1.1 mm/year.

ScreenHunter_2763 Aug. 27 12.31

Sea Level Trends – MSL global stations trends table

The CU numbers are absurd, and constantly increasing. In 2004, they were at 2.8 mm/year, and simply bumped their nonsensical numbers up further

ScreenHunter_2764 Aug. 27 12.37

web.archive.org/web/20040613002139/http://sealevel.colorado.edu/2004_rel1.2/sl_cu2004_rel1.2.pdf

They are well aware that their error is almost as great as their trend.

ScreenHunter_2765 Aug. 27 12.40

Global mean sea level results

Serious scientists wouldn’t publish crap like this, but these are climate scientists.

Posted in Uncategorized | 22 Comments

My Arctic Forecast

The map below (modified by me to include August changes) shows the approximate current state of old, thick multi-year Arctic sea ice (MYI)

In a few weeks, there will be a ~50% increase in the amount of MYI and an 80% increase in the amount of the oldest/thickest 4+ year old ice.

PaintImage43

The next map predicts approximately the state of the MYI on October 1.

 ScreenHunter_10209 Aug. 27 09.49

The Arctic is making a rapid return to the state it was in during the 1990s. The map below shows MYI on week 37 1998. Note that there is more MYI in western Arctic now than there was in 1998.

PaintImage14

Posted in Uncategorized | 96 Comments