
The University of Colorado claims that sea level is rising 3.3 mm/year.
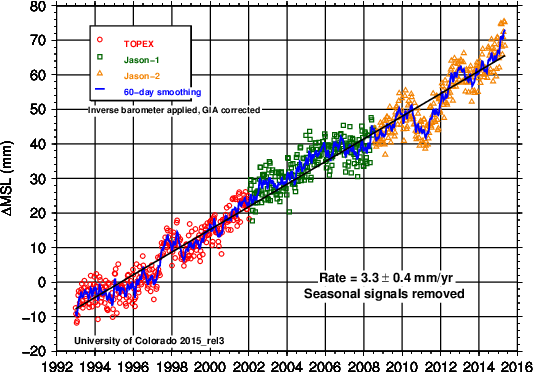
Boulder is the epicenter of climate fraud, and this is no exception. 85% of NOAA tide gauges show less than 3.3 mm/year, and the average is 1.1 mm/year.
Sea Level Trends – MSL global stations trends table
The CU numbers are absurd, and constantly increasing. In 2004, they were at 2.8 mm/year, and simply bumped their nonsensical numbers up further
web.archive.org/web/20040613002139/http://sealevel.colorado.edu/2004_rel1.2/sl_cu2004_rel1.2.pdf
They are well aware that their error is almost as great as their trend.
Serious scientists wouldn’t publish crap like this, but these are climate scientists.

Thank you, Steven aka Tony, for speaking frankly of fraud disguised as consensus science. Blog owners of few other sites are starting to speak out.
How many of NOAA tide-gauges are in the middle of the ocean? Think about it…real hard…
The bulges of a sensitive mind …
How many coastlines vulnerable to flooding are in the middle of the ocean?
Beat me to it! 😆
Non-because it is not an issue out in the ocean!
Bingo! 😉
Here’s one..
http://jonova.s3.amazonaws.com/graphs/ocean/tuvalu-sea-levels-web.gif
cfht fails again !!
And another
http://tidesandcurrents.noaa.gov/sltrends/sltrends_global_station.htm?stnid=750-012
Numbers crunching is so 19th century. Modern climate science requires the sensitive mind of a psychic medium that can detect the predicted changes without relying on crude measurements and statistical methods.
Alarmist sea level claims fall under bullet point #5 of “The ‘Cult’ of Climate Change”…
5) The climate change cult appears to worship the computer models that its shamans built with their own hands — literally man-made idols. Needless to say, much of the content of IPCC’s texts comes from these computer models.
http://wattsupwiththat.com/2015/08/26/the-cult-of-climate-change-nee-global-warming/
SEA LEVEL RISE SCAM TYPICAL STUPIDITY FROM THE #AGWstooges. See more:
http://wp.me/p5UsvC-2J
are the high areas more or less alway in the same place? if so we will soon have mountains of water.
Explaining how mass and gravity effects sea levels.
https://www.youtube.com/watch?v=q65O3qA0-n4
A minute of physics a day keeps cfgjd away.
I had to unlike NASA at fb because they were flooding my news-feed with oversimplified fluff prop. about climate change and sea level rise. Bye nasa don’t get Lost In Space.
https://www.youtube.com/watch?v=Wz2_d6zWDhg
Thats all well and good Rah, but the gravitational effect is constant over century scales at least. That being the case the relative surface level cannot change in any measurable way at all. If it was 10mm higher than the average sea level a century ago it will be pretty much the same today.
Essay PseudoPrecision on SLR cited the publically available satellite specs for JASON 2, the newest sealevel altimetry satellite. The precision is 3mm. The annual instrument drift is plus minus 1mm/year. Tide gauges are shakey because the land they sit on does not stand still. Then there is the closure problem. The estimated amount of ice sheet loss plus the estimated amount of thermosteric rise from increasing OHC does not add up to the supposed SLR. Put on the error bars, and one finds a lot of contrived nonsense.
Boulder is the epicenter of climate fraud, and this is no exception. 85% of NOAA tide gauges show less than 3.3 mm/year, and the average is 1.1 mm/year.
And what effect will this possibly have, if this has been true. Looking at the effect sea levels have had over the past 230 years, what has been the result.
See – An Accurate Map of North and South Carolina With Their Indian Frontiers, Shewing in a distinct manner all the Mountains, Rivers, Swamps, Marshes, Bays, Creeks, Harbours, Sandbanks and Soundings on the Coasts, ’1775′
– http://dc.lib.unc.edu/cdm4/item_viewer.php?CISOROOT=/ncmaps&CISOPTR=125&CISOBOX=1&REC=15
from NC Map
Compare with a side by side google map and most of the features are still there. A side note that 1775 was at the end of the Little Ice Age and a whole lot of ice was on shore and not in the ocean. – See Glacier Bay NP.
Glacier Bay was first surveyed in detail in 1794 by a team from the H.M.S. Discovery, captained by George Vancouver. At the time the survey produced showed a mere indentation in the shoreline. That massive glacier was more than 4,000 feet thick in places, up to 20 miles wide, and extended more than 100 miles to the St. Elias mountain range
That’s 1 watershed valley.
Worried about sealevel rise. Do as an Auzzie official suggested. – Every 50 years, take one step back from the sea.
50 years.. for Sydney , that’s a massive 3.25cm !!
Its worse than we thought !!! 🙂
http://tidesandcurrents.noaa.gov/sltrends/sltrends_global_station.htm?stnid=680-140
And it Aussie… not Auzzie, thanks you !! grrrrrr. !
When modern history and science are viewed in the current social context, it appears that lock-step, consensus science and totalitarian, politically-correct social values are independently confirming Stalin’s unreported victories at Konan, Korea in Aug-Sept 1945.
http://thegoombagazette.com/2015/08/28/definition-of-pc-by-two-great-men/
https://tinyurl.com/o8tmzcx
https://brittius.wordpress.com/2015/08/16/dr-o-manuel-ph-d-stalins-science/
http://jonathanturley.org/2015/08/28/university-of-tennessee-considers-adopting-gender-neutral-pronouns-like-ze-hir-and-xyr-to-avoid-discrimination/
http://tomfernandez28.com/2015/08/28/us-pressured-norway-to-arrest-extradite-snowden-seize-all-devices-documents/