Another Very Cold Month In The US

Before data tampering by NCDC, the past two years were both well below average temperature in the US

ScreenHunter_6558 Jan. 30 06.48

2015 is also starting out very cold, with 33 of 48 states below normal temperature and many more than 8 degrees below normal.

ScreenHunter_6572 Jan. 30 09.39

Government climate experts say that the US faces dangerous overheating, because they are paid to lie. There isn’t one shred of evidence to suggest that the US is getting hot.

Posted in Uncategorized | 6 Comments

The One Who Must Not Be Named

ScreenHunter_6565 Jan. 30 07.36

Lots of press coverage coming out about evidence of temperature data tampering. But there is one researcher who must not be named. I used to ride the train from London to Cambridge frequently. It normally leaves King’s Cross on platform 9 or 10.

ScreenHunter_6566 Jan. 30 07.57

Posted in Uncategorized | 21 Comments

Spectacular Climate Fraud From The White House

This White House document is a textbook example of Soviet style propaganda

ScreenHunter_6556 Jan. 30 06.40

downloads.globalchange.gov/usimpacts/pdfs/national.pdf

Lets look at this one claim at a time

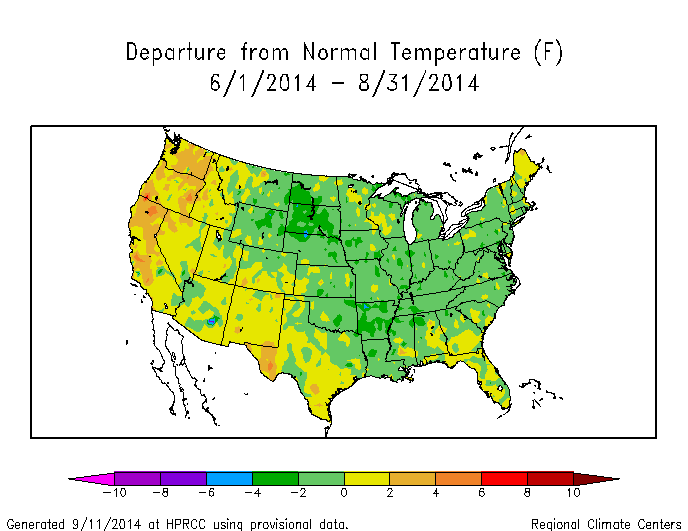
U.S. average temperature has risen more than 2ºF over the past 50 years and is projected to rise more in the future; how much more depends primarily on the amount of heat-trapping gases emitted globally and how sensitive the climate is to those emissions.

They cherry-picked a start point at a local minimum. There has been no net change over the past century.

ScreenHunter_6558 Jan. 30 06.48


The reason why they expect temperatures to increase as CO2 increases, is because they are tampering with the data in proportion with atmospheric CO2. It is 100% fraudulent self-fulfilling prophesy.

ScreenHunter_3233 Oct. 01 22.59

The amount of rain falling in the heaviest downpours has increased approximately  20 percent on average in the past century, and this trend is very likely to  continue

This is complete BS. Heavy precipitation events were more common in the 19th century, and haven’t changed over the past 100 years.

ScreenHunter_6371 Jan. 24 15.42

Many types of extreme weather events, such as heat waves and regional droughts, have become more frequent and intense during the past 40 to 50 years.

Once again, they cherry-picked a misleading start point. The EPA shows that heatwaves were much worse in the 1930s

ScreenHunter_6553 Jan. 30 06.03

Droughts were much worse in the 1930’s and 1950s, and have been trending towards less severe and frequent

ScreenHunter_6559 Jan. 30 07.01

The destructive energy of Atlantic hurricanes has increased in recent decades. The intensity of these storms is likely to increase in this century.

The US is currently experiencing the longest stretch on record without a major (category 3-5) hurricane strike.

Sea level has risen along most of the U.S. coast over the last 50 years, and will  rise more in the future.

There has been little or no sea level rise on the West Coast.

ScreenHunter_6562 Jan. 30 07.06

There has been no change in sea level rise rates on the East Coast, and they are due to land subsidence, not climate

ScreenHunter_6561 Jan. 30 07.06

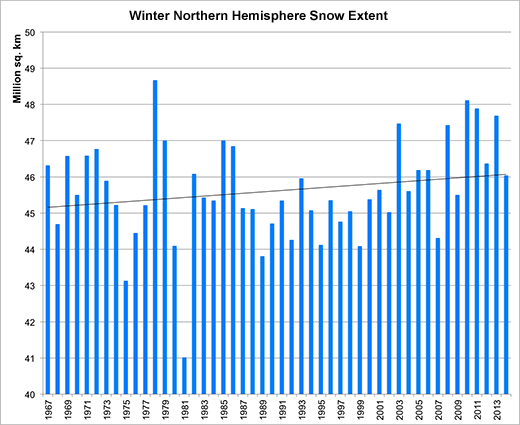
Cold-season storm tracks are shifting northward and the strongest storms are likely to become stronger and more frequent.

Exact opposite of the data. North American winter snow cover has increased to record levels, due to storm tracks and cold air pushing further south.

nhland_season1 (5)

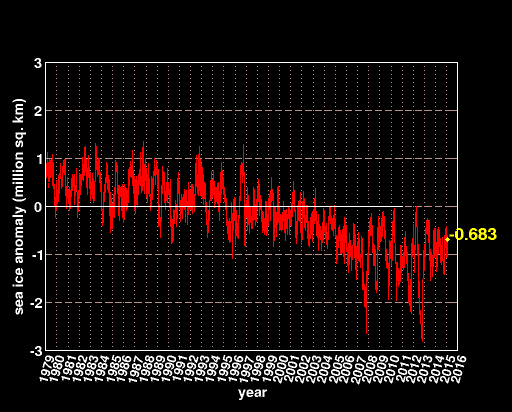
Arctic sea ice is declining rapidly and this is very likely to continue.

There has been no change in Arctic sea ice for a decade.

iphone.anomaly.arctic (3)

Essentially all of the White House climate claims are the inverse of the data.  It is breathtaking.

Posted in Uncategorized | 9 Comments

2014 Was The Least Hot Year On Record In The US

Two thirds of the US was below normal temperature last summer.

JJA14TDeptUS

Current Climate Summary Maps – Powered by ACIS – High Plains Regional Climate Center

The percentage of US HCN stations which reached 90 degrees in 2014, was the smallest on record. The highest percentage occurred in 1931, when almost every single station reached 90 degrees. The area of the US which is hot has been plummeting since the 1930s.

ScreenHunter_6552 Jan. 30 05.45

1931-2014Below90degrees

This is the exact opposite of the 100% fraudulent NCDC climate extremes index (CEI) which reports that the region of the country with unusually hot days has increased to record levels.

ScreenHunter_6542 Jan. 29 22.23High and Low Temperatures | Climate Change | US EPA

My graph was generated using the identical HCN data set used in the NCDC/EPA graph. The difference is that I use the actual thermometer data, whereas CEI uses “adjusted” data. The EPA has another graph on the same web page which directly contradicts the NCDC CEI graph above.

ScreenHunter_6553 Jan. 30 06.03 High and Low Temperatures | Climate Change | US EPA

The area of the US over 100 degrees and 110 degrees also peaked in the 1930’s, and has plummeted since.

ScreenHunter_6549 Jan. 30 05.30

1934-2014100degrees

ScreenHunter_6551 Jan. 30 05.38


1936-2014110degrees

These are critical indicators, because they are not affected by time of observation bias (TOBS) and show unequivocally that NCDC data tampering is incorrect. The reason that the CEI is wrong, is because they use adjusted data.

This is a smoking gun that the adjustments are fraudulent.

Posted in Uncategorized | 11 Comments

NCDC Fraud Visualization For The Evening

ScreenHunter_6542 Jan. 29 22.23

NCDC claims that more of the US is hot now than during the 1930’s. This is one of the biggest lies the climate scamsters have come up with yet.

1934-2014100degrees

Posted in Uncategorized | 8 Comments

A Fast Start At NCDC

Our friends at the National Climatic Data Center are poised to break data tampering records again this year. Through January 28, they are fabricating more than 50% of their station data, with an average upwards adjustment of 1.0F

ScreenHunter_6520 Jan. 29 08.32

ScreenHunter_6521 Jan. 29 08.32

These numbers will go down as more raw data is received, but it shows how their data tampering algorithms are strongly biased towards creating warming. The more missing data, they more they cheat.

Posted in Uncategorized | 35 Comments

Only One Thing Has Changed Since 1977

In 1977, the US had a spectacularly incompetent left wing president. It was cold and snowy in New York.

ScreenHunter_6506 Jan. 29 00.02

Jerry Brown was governor of California, and they were facing a drought disaster

ScreenHunter_1417 Jul. 29 23.22ScreenHunter_1419 Jul. 29 23.23

The jet stream made Alaska warm, California dry and brought snow to Florida,.

screenhunter_224-jan-21-20-19

The Lewiston Journal – Google News Archive Search

BgETnxaCIAA0ZcZ

Everything was identical to the present, except for one thing. In 1977, experts blamed it on global cooling, instead of the current global warming wankers.

ScreenHunter_53 Jul. 17 14.00

Is global warming causing extreme weather via jet stream waves? | John Abraham | Environment | theguardian.com

Posted in Uncategorized | 25 Comments

No, It Isn’t The TOBS Stupid

gissustemperature1999-2001-2015 (1)

The TOBS adjustment did not change between the 1990’s USHCN V1 and the current V2. They can’t use Time Of Observation Bias as an excuse for this data tampering.

Posted in Uncategorized | 8 Comments

Trenberth Demonstrates Again That He Is An Idiot

One particular graphic that was popular on the Web on Tuesday showed the average snow cover during December, January and February. It showed that snow cover in the Northern Hemisphere was about 45.5 million square kilometers — at least 1 million square kilometers more than what it was in most of the 1990s.

“If you wanted to say that there’s no global warming, then, yeah, look at December, January and February,” said Kevin Trenberth, a distinguished senior scientist in the climate analysis section of the National Center for Atmospheric Research in Boulder, Colo. “But as soon as you look at March, April, May and June, you have a very different picture.”

What’s at play with the high winter snowfall, he said, is increased moisture in the air, which leads to bigger snowstorms. And that, says Trenberth, is not a result of colder air, but of warming ocean temperatures.

Winter snow cover must be weighed against springtime lack, scientists say – LA Times

The high winter snow extent is due to cold air pushing the snow line further south. Trenberth is suggesting that snow in Florida is due to an increase in humidity? It doesn’t get much stupider than that.

Posted in Uncategorized | 25 Comments

More From The Whack-A-Doodle

Posted in Uncategorized | 29 Comments