Enjoying God’s Creation

I just took an amazing walk through the forest and got to a clearing where there were probably a thousand fireflies flashing every second, against an almost pitch black background. Simply incredible sight. Like the 4th of July.

It is unfortunate that people have been trained to rot their brains out getting propagandized by TV, rather than going outside and enjoying all the amazing gifts God has created for us.

The world would be a much better place if everyone shot their television, and got back in touch with the real world.

I want to know how God created this world. I am not interested in this or that phenomenon, in the spectrum of this or that element. I want to know His thoughts; the rest are details.

– Albert Einstein

My religion consists of a humble admiration of the illimitable superior spirit who reveals himself in the slight details we are able to perceive with our frail and feeble mind.

– Albert Einstein

The scientists’ religious feeling takes the form of a rapturous amazement at the harmony of natural law, which reveals an intelligence of such superiority that, compared with it, all the systematic thinking and acting of human beings is an utterly insignificant reflection.

– Albert Einstein

Science without religion is lame. Religion without science is blind.

– Albert Einstein
Posted in Uncategorized | 49 Comments

Just How Bad Is The USHCN Data Tampering?

According to the USHCN V1 docs, they were done adjusting after 1990.

ts.ushcn_anom25_diffs_urb-raw_pg

ts.ushcn_anom25_diffs_urb-raw_pg.gif (650×502)

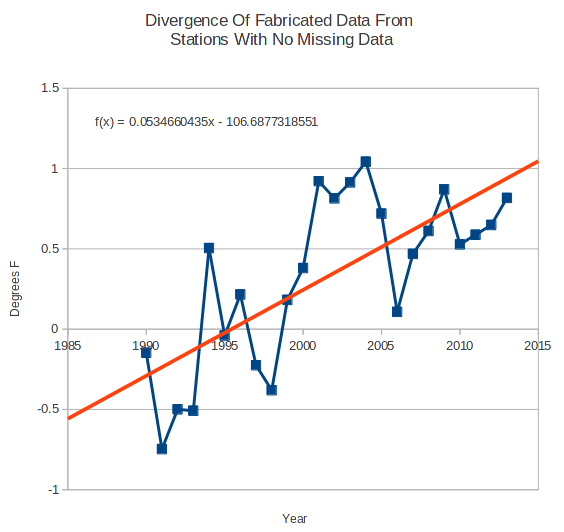
According to the V2 specs, they use the same TOBS algorithm as in V1. So it seems safe to assume that stations with no missing data after 1990 need no adjustments.

1990 was also the year when they started exponentially losing station data, and started doing a lot of infilling.

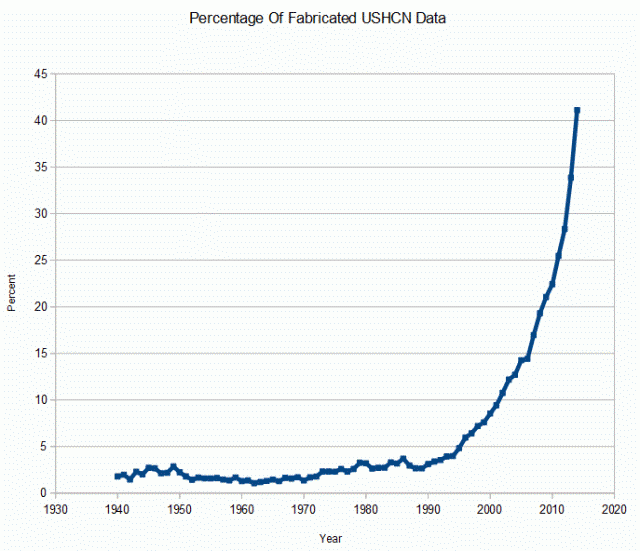
So I did an experiment. I calculated the post-1990 measured temperatures for all stations with no missing data, and the post 1990 temperatures for all of the fabricated data. The fake data is diverging from the real station data at a phenomenal 5.3 degrees per century.

ScreenHunter_693 Jun. 28 20.18

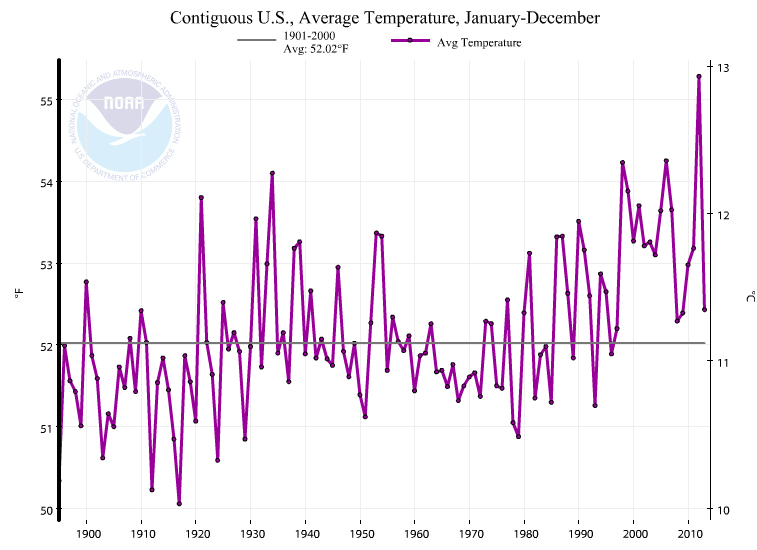
That huge spike in temperatures after 1990 which NCDC shows (and  I asked you to bookmark last night) is almost entirely due to fake data. Unbelievable.

ScreenHunter_680 Jun. 27 21.17


I’ve been talking about the discontinuity after 1990 for a long time, and there you have it.

Posted in Uncategorized | 58 Comments

Software Verification Part Two

I have been emphasizing the difference between commercial and government software.

Commercial software goes through constant review. Mine gets reviewed 2-3 times a day by my boss.

Government software on the other hand has no quality control. Consider the Obamacare web site or the just announced USHCN software disaster.

The scientific method is at work on the USHCN temperature data set | Watts Up With That?

A bunch of scientists with no software training cranking out code, with the only review process being that the output confirms their biases. The error USHCN has uncovered is so blatant, that it obviously has never been through any kind of serious verification.

They were just happy to see a lot of warming, and it didn’t matter that global warming research, climate models, and US domestic policy in Washington were based on their graphs. It wasn’t worth spending two hours doing any verification.

Posted in Uncategorized | 55 Comments

Night Of The Living Infillers

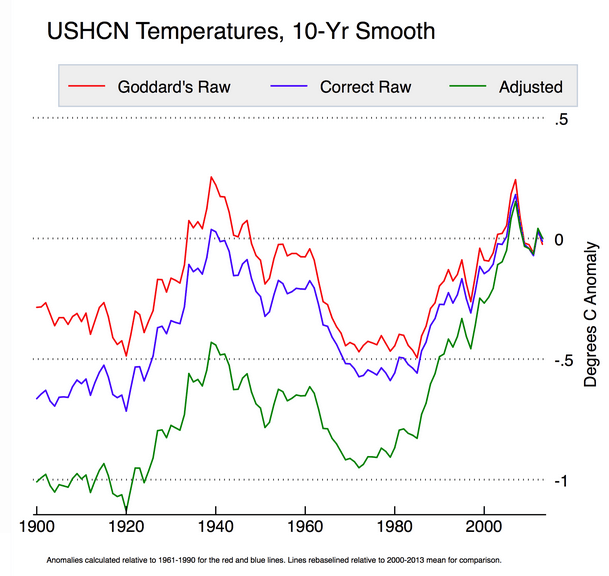
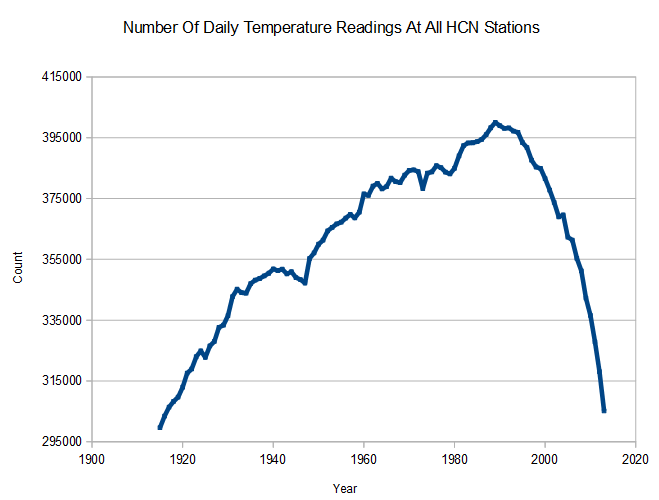
Zeke just can’t grasp what he is doing wrong. Around 1990, USHCN started losing a lot of mainly rural stations. Using their clever infilling and gridding, they turned those disappearing stations into urban stations – which created a huge spurious warming trend.

Zeke likes the meaningless green line.

ScreenHunter_689 Jun. 28 15.47

The Blackboard » How not to calculate temperatures, part 3

See the graph below. Essentially all of the warming since 1990 is due to fabricated (no underlying temperature records) data shown below in green – which strongly hints at cooler rural stations being lost, and their missing data being replaced by infilled urban data.

This is so blatantly obvious, that only a temperature expert couldn’t grasp it.

ScreenHunter_297 Jun. 05 06.17

It is like dealing with anomaly/infilling/gridding zombies. Do they actually think that their large spike in temperatures after 1990, coinciding with their large spike in lost (mainly rural) stations – was coincidence?

unnamed

If you lose a cool rural station and replace the data with that from a warm urban station, it raises your average temperature. Now repeat over and over again several hundred times since 1990.

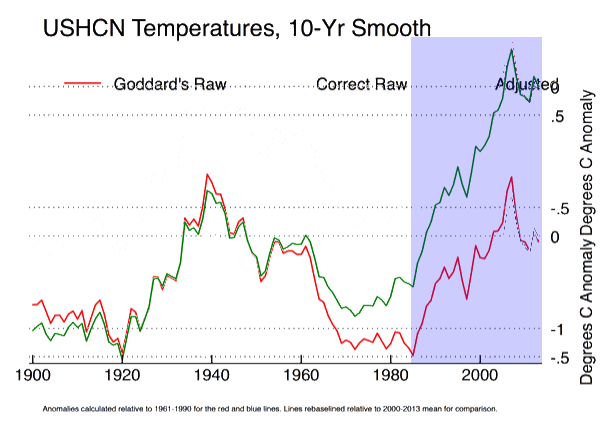
In the next graph, I normalized Zekes data properly, and highlighted the period of rapid station loss in blue.  The huge spike in temperatures in the green line is due to garbage data handling practices, not warming.

ScreenHunter_691 Jun. 28 16.22

Just say no to data tampering. This nonsense has to come to an end.

Posted in Uncategorized | 24 Comments

Another Nail In The TOBS Coffin

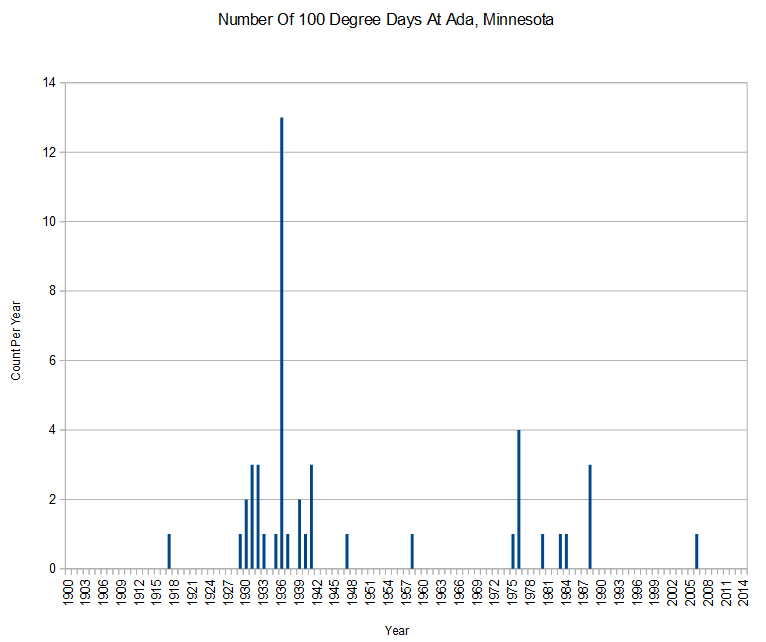
The USHCN station at Ada, Minnesota took their temperature readings at 7 am during the 1930s. They show exactly the same pattern of very hot weather during the 1930’s, and much cooler since 1988.

The “blame the hot 1930s on TOBS” scam is just the latest of many from the team.

ScreenHunter_688 Jun. 28 15.25

Posted in Uncategorized | 7 Comments

One More Time …..

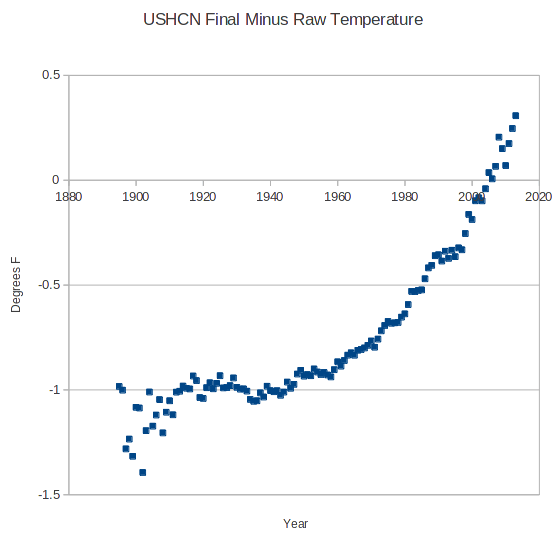
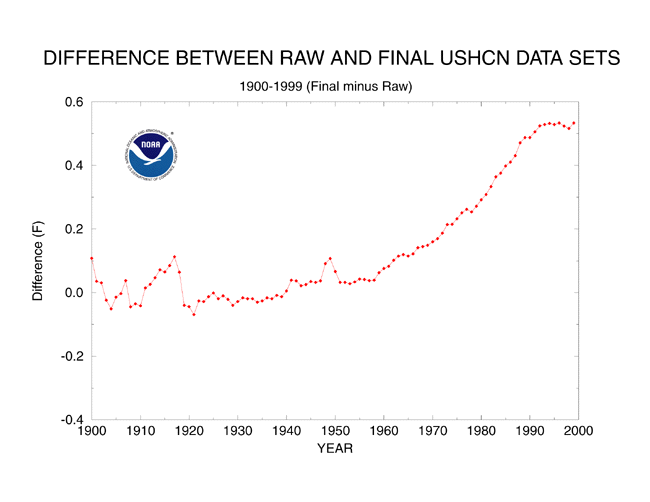
I have posted this graph dozens of times, and hopefully this time it will be clear to everyone. The graph shows the average final temperature for all USHCN stations minus the average raw temperature for all USHCN stations.  This is a very simple calculation which shows the average adjustment for all USHCN stations.

It shouldn’t be a surprise to NOAA or anybody else that an exponential increase in adjustments is occurring, as I have been showing the same graph (crying wolf) for many years.

ScreenHunter_687 Jun. 28 14.49

Posted in Uncategorized | 21 Comments

USHCN Adjustments In Kansas

Paul’s work show exactly why you have to use untarnished absolute temperatures rather than anomalies, infilling and gridding for this type of analysis.

Posted in Uncategorized | 2 Comments

Mexico Vs. England

Up till now, I have been I have been watching the World Cup on a Mexican web site with very animated announcers, who are obviously having a lot of fun and make watching the match more fun.

They aren’t showing the rest of the tournament to non-subscribers, so I had to switch over to ESPN-Live with stuffy, boring English announcers. Could be worse, though. They could have American announcers.

ZZZZzzzzz….

Posted in Uncategorized | 10 Comments

Progressive Journalists Remain 100% Fact Free

Check out this garbage in Forbes

ScreenHunter_684 Jun. 28 10.02

The Public Relations Debate About Global Warming Heats Up

Anyone who has watched the rather animated debate this week between myself and Anthony Watts will understand that there is no denier conspiracy, and that we have no organization and little or no money. We are scientists with different opinions trying to end the massive misinformation campaign being waged with $29 billion per year of government money, and being directed by the President of The United States.

Donors are afraid to fund skeptics, out of fear that the IRS will be used to target them if they do.

Progressive journalists like Robert Wayne simply make “facts” up without doing any research. They need to held liable for their dishonesty.

Posted in Uncategorized | 17 Comments

Dispelling The TOBS Myth

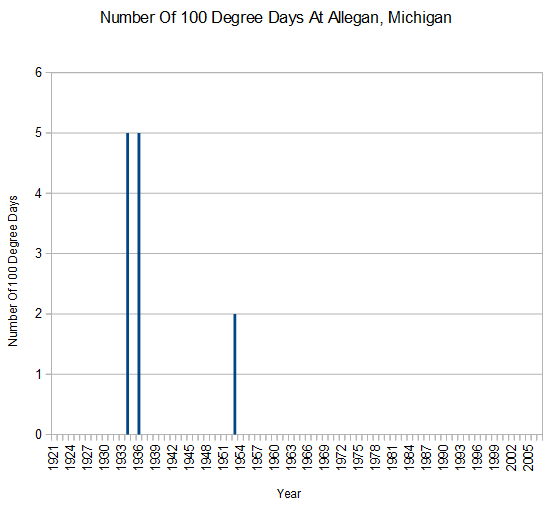
Someone was trying to blame the high incidence of 100 degree readings during the 1930s on time of observation bias.

Allegan, Michigan took their readings at midnight during the 1930’s, and showed the same pattern as the rest of the stations. One hundred degree readings during the 1930’s and 1950’s – and none since. The 1930s were the hottest on record in the US, and attempts to hide this are dishonest.

ScreenHunter_683 Jun. 28 08.56

Posted in Uncategorized | 13 Comments