
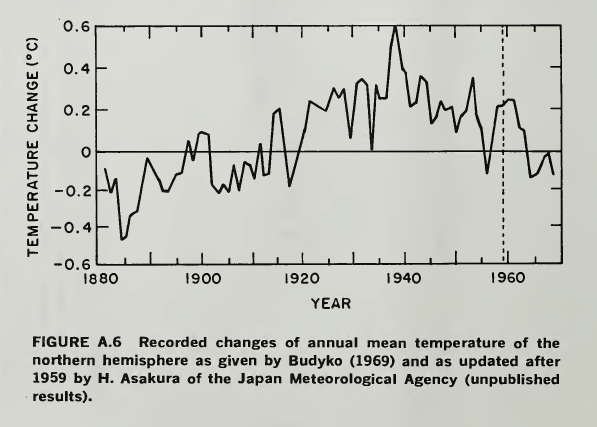
When future generations try to understand how the world got carried away around the end of the 20th century by the panic over global warming, few things will amaze them more than the part played in stoking up the scare by the fiddling of official temperature data. There was already much evidence of this seven years ago, when I was writing my history of the scare, The Real Global Warming Disaster. But now another damning example has been uncovered by Steven Goddard’s US blog Real Science, showing how shamelessly manipulated has been one of the world’s most influential climate records, the graph of US surface temperature records published by the National Oceanic and Atmospheric Administration (NOAA).
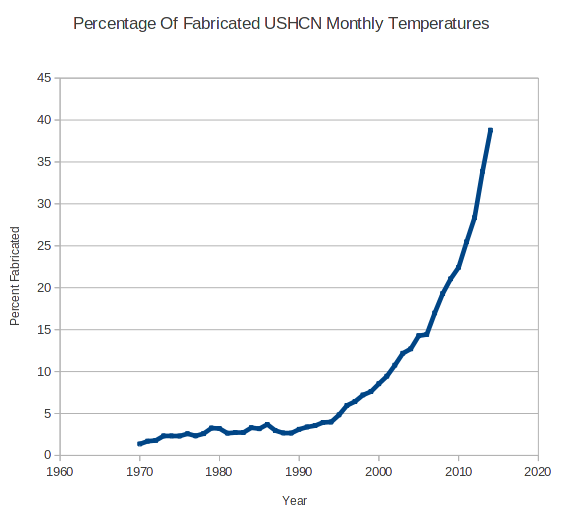
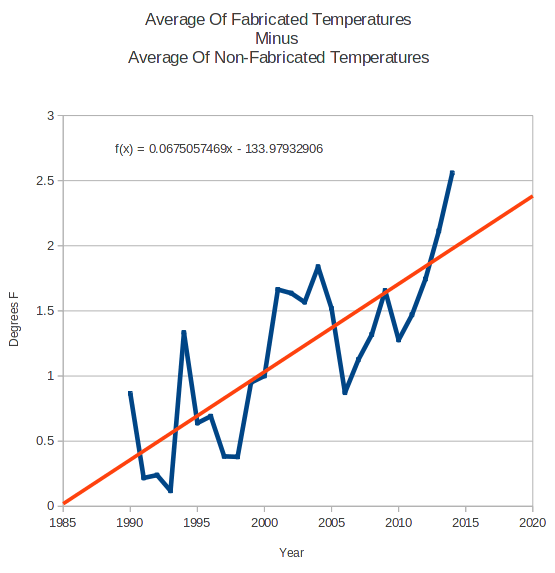
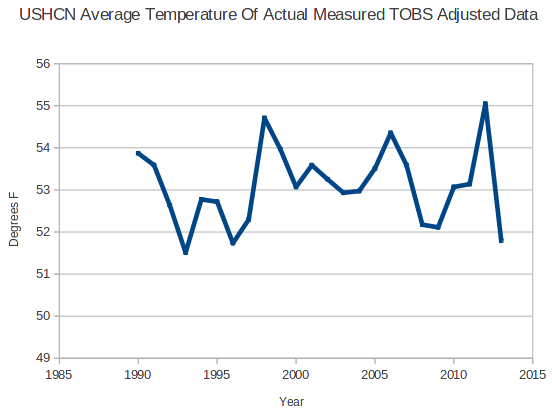
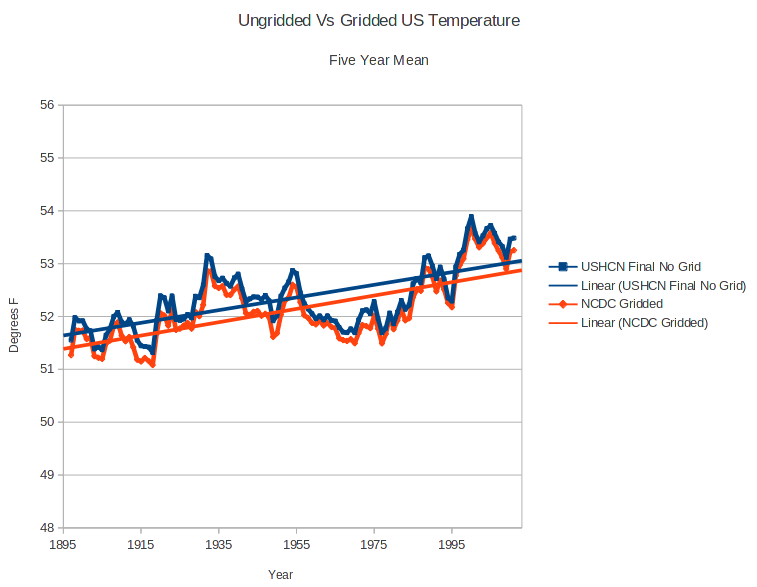
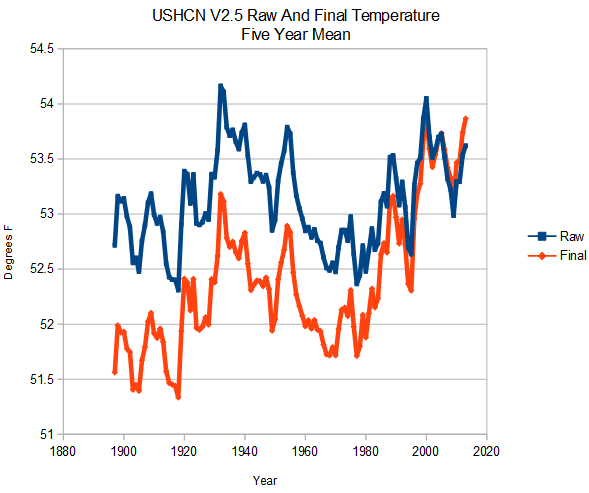
Goddard shows how, in recent years, NOAA’s US Historical Climatology Network (USHCN) has been “adjusting” its record by replacing real temperatures with data “fabricated” by computer models. The effect of this has been to downgrade earlier temperatures and to exaggerate those from recent decades, to give the impression that the Earth has been warming up much more than is justified by the actual data. In several posts headed “Data tampering at USHCN/GISS”, Goddard compares the currently published temperature graphs with those based only on temperatures measured at the time. These show that the US has actually been cooling since the Thirties, the hottest decade on record; whereas the latest graph, nearly half of it based on “fabricated” data, shows it to have been warming at a rate equivalent to more than 3 degrees centigrade per century.
Disrupting the Borg is expensive and time consuming!

Google Search
-
Recent Posts
- One Atomic Bomb Per Hour
- New Video : Analyzing Oil And Gas
- Is Antarctica Melting?
- High Speed Analysis And Visualization
- El Nino To The Rescue?
- Fake News Update
- Growth Of Antarctic Sea Ice
- 65 Years Of Progress!
- El Nino To The Rescue?
- Worst March Drought On Record
- ChartGL Process Control Demo
- The Biggest Money Laundering Scam
- Drought In The Headwaters Of Lake Powell
- Unrealistic Expectations Of Water Availability
- Did Bill Gates Do This?
- Worst March Drought On Record In The US
- The Real Hockey Stick Graph
- Analyzing The Western Water Crisis
- Gaslighting 1924
- “Why Do You Resist?”
- Climate Attribution Model
- Fact Checking NASA
- Fact Checking Grok
- Fact Checking The New York Times
- New Visitech Features
Recent Comments
- Bob G on One Atomic Bomb Per Hour
- Bob G on One Atomic Bomb Per Hour
- Crispin Pemberton-Pigott on One Atomic Bomb Per Hour
- Crispin Pemberton-Pigott on One Atomic Bomb Per Hour
- william on 65 Years Of Progress!
- arn on One Atomic Bomb Per Hour
- Gordon Vigurs on One Atomic Bomb Per Hour
- Gordon Vigurs on One Atomic Bomb Per Hour
- Gordon Vigurs on One Atomic Bomb Per Hour
- Bob G on One Atomic Bomb Per Hour