



Disrupting the Borg is expensive and time consuming!

Google Search
-
Recent Posts
- El Nino To The Rescue
- Bullseye!
- It’s Getting Closer
- Greenland Meltdown Scam
- Greenland Ice Update
- Wyoming Gold
- Three Years Since The Apocalypse
- Arctic Report card Summer 2026
- Elon Pushing Pushing Geoengineering
- Earth, Wind And Fire
- On The Road Again
- Vandalism At The Reflecting Pool
- Fifty Years Ago Today
- Truth Or Consequences
- US Climate Trend Maps
- Declining Spring Snow Cover In Northern New Mexico
- You Can’t Fool Mother Nature
- Cattle And The Climate
- One Atomic Bomb Per Hour
- New Video : Analyzing Oil And Gas
- Is Antarctica Melting?
- High Speed Analysis And Visualization
- El Nino To The Rescue?
- Fake News Update
- Growth Of Antarctic Sea Ice
November 2026 M T W T F S S 1 2 3 4 5 6 7 8 9 10 11 12 13 14 15 16 17 18 19 20 21 22 23 24 25 26 27 28 29 30 Recent Comments
- Bob G on El Nino To The Rescue
- Bob G on El Nino To The Rescue
- Bob G on El Nino To The Rescue
- Stuart Hamish on Bullseye!
- Bob G on El Nino To The Rescue
- Bob G on El Nino To The Rescue
- Terry Shipman on El Nino To The Rescue
- Bob G on El Nino To The Rescue
- Jack the Insider on El Nino To The Rescue
- Bob G on El Nino To The Rescue
Santa Obama Wants You To Spend The Last Of Your Christmas Money Saving His Ass
Posted in Uncategorized
5 Comments
NASA : Cooling Down The Whole World’s Past
Dave Burton sent over a bunch of archive links which have turned up some more history of NASA’s data tampering.
The graph below shows NASA’s 2004 version of global surface temperatures in red, and current version in green – normalized to 1998. Note that in 2004 the 1880’s were just as warm as the 1960’s, but they have since cooled way down. Hansen must have traveled back in time and changed the past.
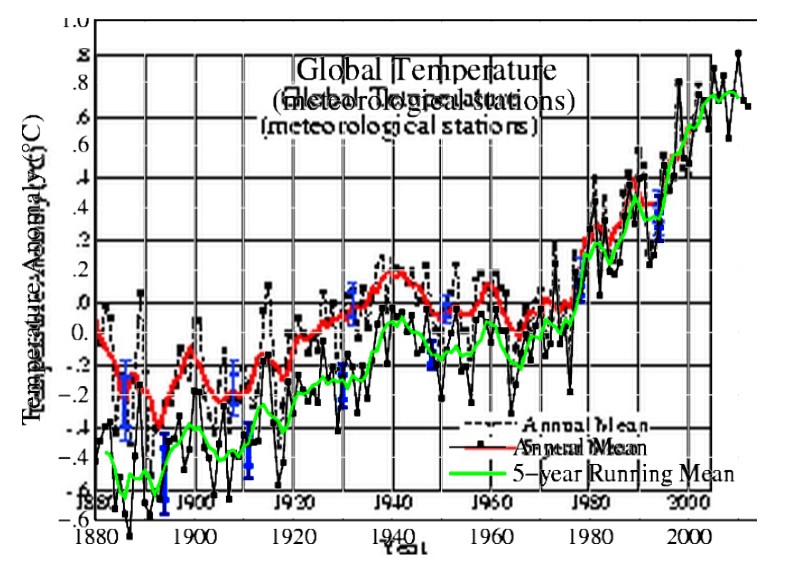
2004 version : Fig.A.gif (274×203)
2013 version : Fig.A.gif (656×446)
The next graph shows the extent of their changes. NASA has completely eliminated the hot 1880’s, when Europe set their all-time record high temperature. Thoughtful of them to go back in time and cool those poor people down.

2001 version : http://www.giss.nasa.gov/data/update/gistemp/graphs/FigA.txt
2013 version : http://data.giss.nasa.gov/gistemp/graphs_v3/Fig.A.txt

NCDC: Global Measured Extremes of Temperature and Precipitation
Posted in Uncategorized
11 Comments
NASA : Cooling The Past Down Under Too
Prior to 1960, people all over the world always read temperatures too high. This was probably because they were very short and had to look up at the glass thermometer.
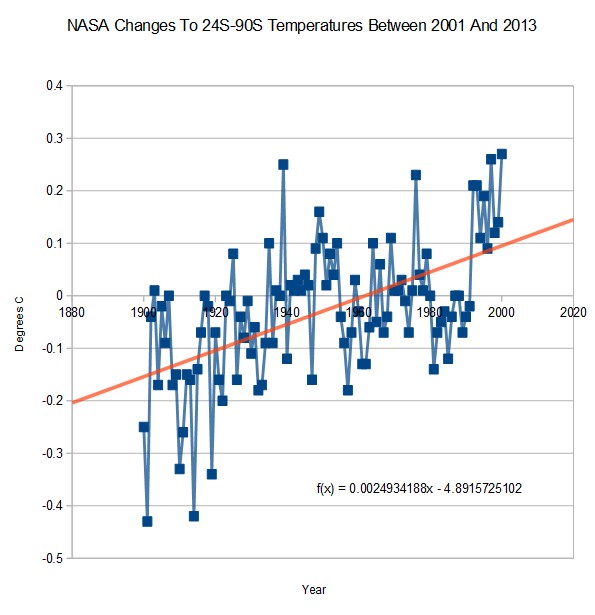 http://www.giss.nasa.gov/data/update/gistemp/graphs/FigB.txt
Posted in Uncategorized
5 Comments
Phil Shows That He Is Just As Good At Rewriting History As Jimmy And Tom
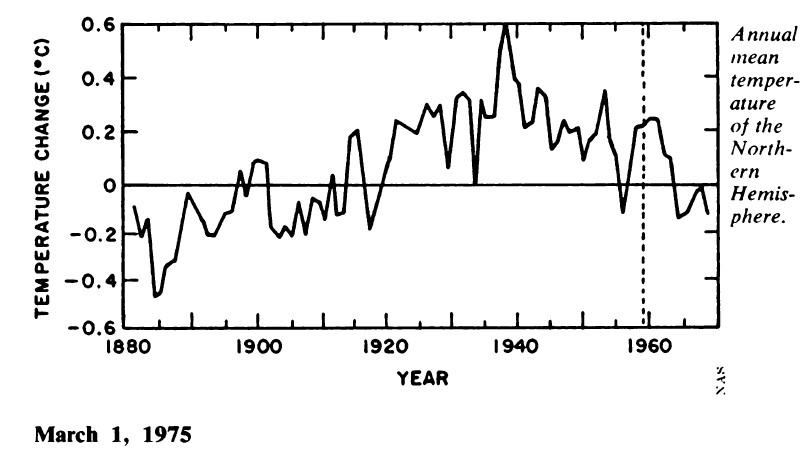
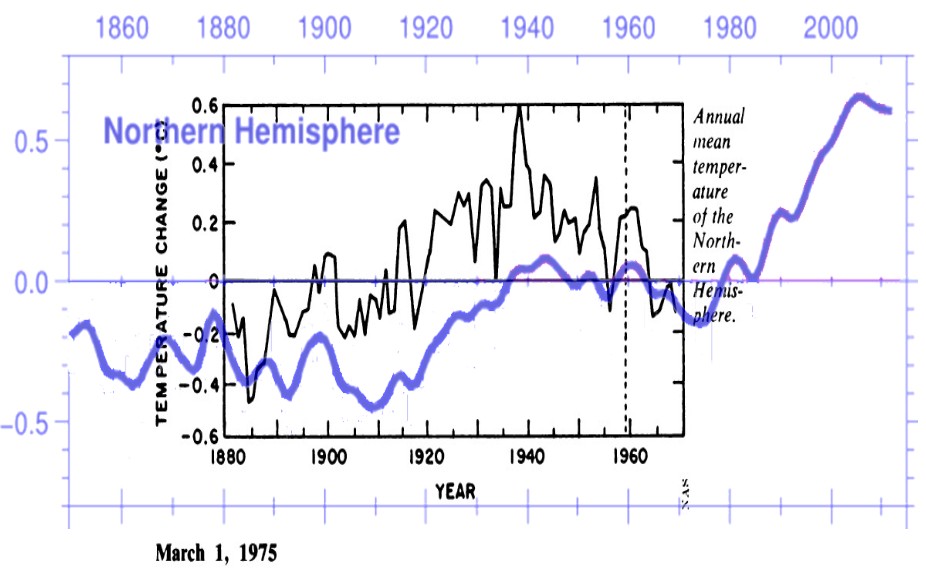
In 1975, the National Academy of Sciences showed that global cooling had erased all 1900-1940 Northern Hemisphere warming.
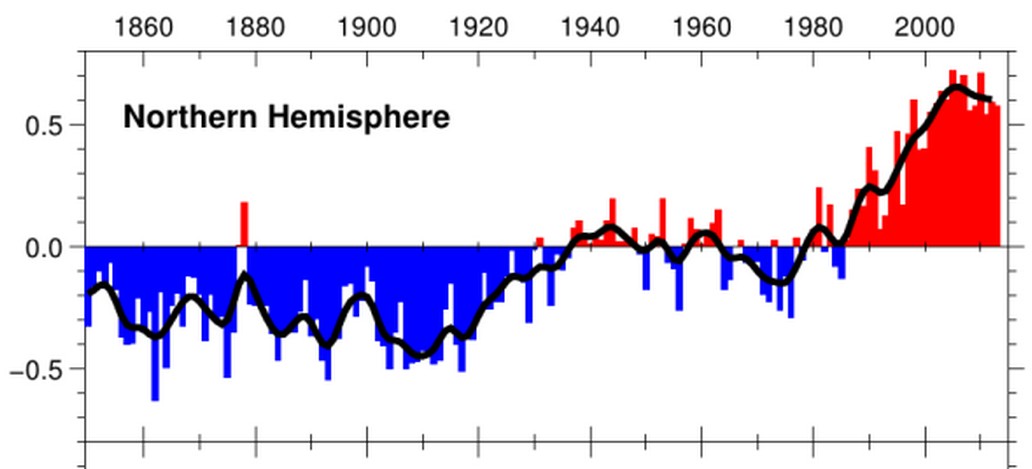
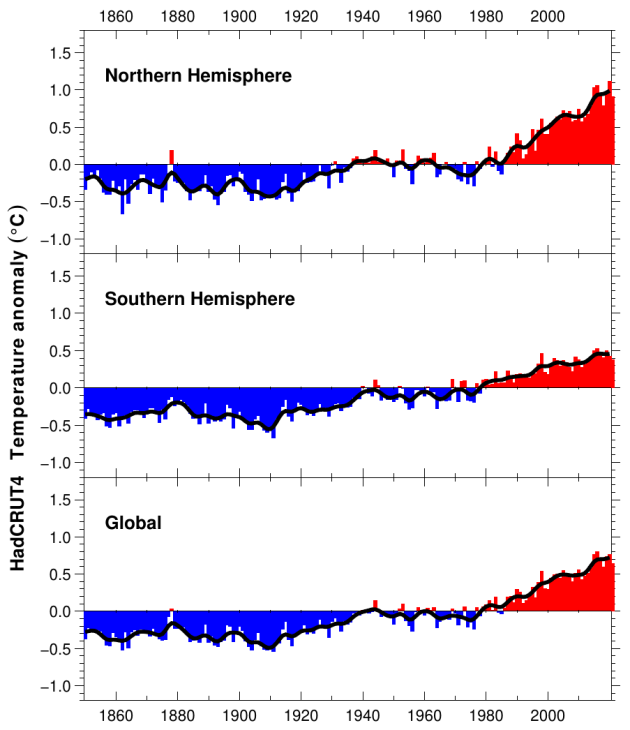
That didn’t make for a very good story, so Phil Jones erased half of the 1910-1940 warming.
Next graph shows Phil’s handiwork in blue, overlaid on the 1975 NAS graph.
Posted in Uncategorized
2 Comments
1986 : Leading Experts – 6 Degrees Warming By 2010, Eight Degrees By 2030, With 4.5 Feet Of Sea Level Rise
Average global temperatures would rise by one-half a degree to one degree Fahrenheit from 1990 to 2000 if current trends are unchanged, according to Dr. Hansen’s findings. Dr. Hansen said the global temperature would rise by another 2 to 4 degrees in the following decade.
While the effect of small increases in global temperature is now unclear, Andrew Maguire, vice president of the World Resources Institute, a Washington research and policy group, said that the doubling of atmospheric carbon dioxide that is foreseen would cause a rise of 3 to 8 degrees in temperature by the 2030’s. He said this would devastate agriculture in the United States and elsewhere, and would cause a rise in sea level of some 4.5 feet as polar ice melted.
Posted in Uncategorized
3 Comments
1982 : Global Warming To Bring Lions And Elephants To England, And Drown Major Cities
Dr. Hansen said the probability was that a warmer climate would make some places wetter while others were likely to be drier than today, but that it was too early to say which effects any given region would experience. Several specialists have noted that a pronounced warming trend could raise sea levels sufficiently to inundate many of the world’s major cities. There has already been a small rise in sea level simply because of expansion of the warmer surface waters of the ocean, Dr. Hansen said.
Hermann Flohn of University of Bonn said warming effects on the climate would be small at first, but, through the next century, might give the planet its warmest spell since an interglacial period 125,000 years ago. In that period, he noted, lions, elephants and other warm-climate animals roamed what is now England.
WARMING OF WORLD’S CLIMATE EXPECTED TO BEGIN IN THE 80’S – NYTimes.com
Posted in Uncategorized
4 Comments
1982 : Hansen Said Mann-Made Global Warming Set To Begin
WARMING OF WORLD’S CLIMATE EXPECTED TO BEGIN IN THE 80’S
WASHINGTON, Jan. 6— Mankind’s activities in increasing the amount of carbon dioxide and other chemicals in the atmosphere can be expected to have a substantial warming effect on climate, with the first clear signs of the trend becoming evident within this decade, a scientist at the National Aeronautics and Space Administration said here today.
The changes are in prospect because of excess carbon dioxide put into the atmosphere as humans burn coal, gas, oil and wood and cut forests for agriculture and other purposes. More recently there has also been an atmospheric buildup of methane, nitrous oxide and other chemicals as a result of agriculture and industry, said Dr. James Hansen of the space agency’s Goddard Institute for Space Studies in New York.
WARMING OF WORLD’S CLIMATE EXPECTED TO BEGIN IN THE 80’S – NYTimes.com
That would mean that 70% of the hockey stick is natural variability.
Posted in Uncategorized
1 Comment
1981 : Crack Government Scientists Announced That Venus Has A Thin Atmosphere
The orbiting spacecraft sampled Venus’ atmosphere from top to bottom, enabling the scientists to establish the exact amounts of sunlight absorbed at various places in the atmosphere and at the surface. Measurements of atmosphere composition, temperature profiles and radiative heating predicted Venus’ surface temperature very accurately.
Although the planet is closer to the Sun than Earth, and has a relatively thin atmosphere like Earth’s, that atmosphere consists of more than 90 percent of carbon dioxide, compared to less than four percent for Earth. Thus, the much higher percentage of carbon dioxide in Venus’ atmosphere traps much more heat radiation than does Earth.
Amazing! Scientists in 1981 almost as stupid as Hansen. Venus has an extremely thick atmosphere, and very little sunlight reaches the surface because of thick clouds. You can’t heat a greenhouse without sunlight. Hot temperatures on Venus have just about nothing to do with the greenhouse effect.
The Venus studies are believed to be important to the understanding of posssible adverse effects on Earth’s agriculture and sea levels that could result from society’s long-term use of fossil fuels, which add carbon dioxide to the atmosphere.
The findings, released recently by the National Aeronautics and Space Administration, were made by a team of scientists from NASA’s Ames Research Center in Mountain View, Calif., and the University of Arizona in Tucson.
Illustrations: Photo of a mummy cat
Posted in Uncategorized
13 Comments
You May Be Wondering ….
You may be wondering ….. why all the old New York Times articles?
It is because Google has disabled searching their newspaper archives .

Posted in Uncategorized
8 Comments
Climate Scientists – In Their Fourth Decade Looking For The Missing Heat
SOME POLAR ICE MELTING LINKED TO GLOBAL HEATING By WALTER SULLIVAN
January 8, 1982
The Federal agency’s scientists cited an estimate by Dr. K.O. Emery of the Woods Hole Oceanographic Institution that over 40 years the seas had risen more than an inch a decade. In that period, the global warming of the previous century reversed itself, at least in northern latitudes; hence the sea-level rise is attributed to ice melting, rather than ocean expansion due to warming.
One effect of such extensive melting, the article in Science says, would be halving of the rate at which the oceans become heated. Melting ice absorbs an immense amount of heat. The scientists suggest that while a pronounced global warming may be under way, much of its effects have been hidden by the heat absorption of melting ice.
SOME POLAR ICE MELTING LINKED TO GLOBAL HEATING – NYTimes.com
Posted in Uncategorized
4 Comments