Disrupting the Borg is expensive and time consuming!
Google Search
-
Recent Posts
- El Nino To The Rescue
- Bullseye!
- It’s Getting Closer
- Greenland Meltdown Scam
- Greenland Ice Update
- Wyoming Gold
- Three Years Since The Apocalypse
- Arctic Report card Summer 2026
- Elon Pushing Pushing Geoengineering
- Earth, Wind And Fire
- On The Road Again
- Vandalism At The Reflecting Pool
- Fifty Years Ago Today
- Truth Or Consequences
- US Climate Trend Maps
- Declining Spring Snow Cover In Northern New Mexico
- You Can’t Fool Mother Nature
- Cattle And The Climate
- One Atomic Bomb Per Hour
- New Video : Analyzing Oil And Gas
- Is Antarctica Melting?
- High Speed Analysis And Visualization
- El Nino To The Rescue?
- Fake News Update
- Growth Of Antarctic Sea Ice
November 2026 M T W T F S S 1 2 3 4 5 6 7 8 9 10 11 12 13 14 15 16 17 18 19 20 21 22 23 24 25 26 27 28 29 30 Recent Comments
- Bob G on El Nino To The Rescue
- Stuart Hamish on Bullseye!
- Bob G on El Nino To The Rescue
- Terry Shipman on El Nino To The Rescue
- Bob G on El Nino To The Rescue
- Jack the Insider on El Nino To The Rescue
- Bob G on El Nino To The Rescue
First Round Knockout At Madison Square Gardens
Twitter / SteveSGoddard: @ClimateOpp @tan123 @USATODAY …
Change in Manhattan sea level shows essentially no correlation with change in global temperature, but correlates almost perfectly with time (i.e. linear glacial rebound.)
Posted in Uncategorized
43 Comments
2013 Will Finish One Of The Ten Coldest Years In US History, With The Largest Drop In Temperature
Before NASA and NOAA start tampering with the data, 2013 is one of the ten coldest years in the US since 1895, and has had the largest year over year decline on record.
NOAA of course won’t talk about this, and will massively tamper with the data before releasing it.
The graph below is the monthly average of all daily high and low temperatures at all NOAA USHCN stations.

Thermometer data is here : Index of /pub/data/ghcn/daily/hcn/
December isn’t complete yet, but is running far below normal and forecast to get colder.
NOAA will reporting something very different, because they subtract up to 1.7 degrees from older temperatures. Essentially all reported US warming is due to a hockey stick of temperature adjustments, which makes the past appear to be much colder than what the thermometers measured at the time. (They of course do not mention this in their press releases.)
Complete station list can be seen below
Posted in Uncategorized
480 Comments
October 8, 1871 Fires Were The Worst In US History
If this happened now, the death toll would be tens or hundreds of thousands of people.
Papers Past — Nelson Evening Mail — 11 December 1871 — AWFUL TORNADO AND FIRES IN AMERICA.
Posted in Uncategorized
5 Comments
Five Years Since Hansen Forecast 200 Feet Of Sea Level Rise And Total Polar Meltdown
Gaia celebrates the anniversary of Hansen’s brain damaged forecast, with near record global sea ice.
Posted in Uncategorized
11 Comments
Government Passing New Laws To Make You Safe
“There’s no way to rule innocent men. The only power any government has is the power to crack down on criminals. Well, when there aren’t enough criminals, one makes them. One declares so many things to be a crime that it becomes impossible for me to live without breaking laws. Who wants a nation of law-abiding citizens? What’s there in that for anyone? But just pass the kind of laws that can neither be observed or enforced nor objectively interpreted – and you create a nation of law-breakers – and then you cash in on guilt.”
? Ayn Rand, Atlas Shrugged
Posted in Uncategorized
9 Comments
December 16 Global Sea Ice Area Is Second Highest On Record, And Highest In 25 Years
arctic.atmos.uiuc.edu/cryosphere/timeseries.global.anom.1979-2008
It is closing in on an all-time record.
Posted in Uncategorized
45 Comments
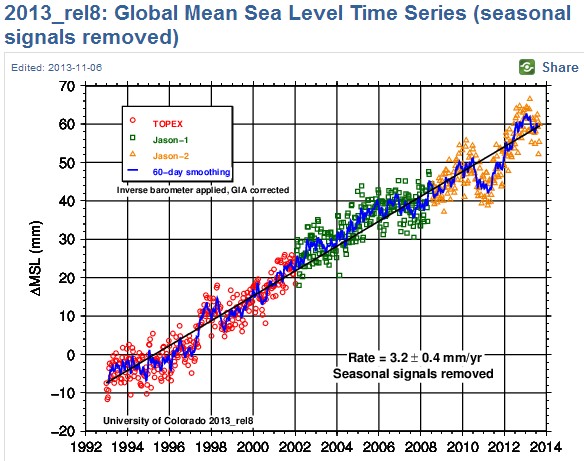
Satellites Massively Perturb Sea Level
Climate geniuses tell us that sea level was rising about 1.8 mm/year until 1993, when it suddenly shifted to 3.2 mm/year. This amazing transition occurred exactly when satellites were launched to monitor sea level.
The only plausible explanation for a certified Mannian climate genius, is that satellites are massively affecting sea level.
Posted in Uncategorized
11 Comments
NOAA Responds To My Query About Data Tampering
The recent addition of seven states since President Obama took office has necessitated scaling the average temperature proportional to the number of states, thus the 14% increase in adjustments since 2008.
Similarly, the lack of states in the 18th century (fourteen including Kenya) requires a significant downwards adjustment.
Posted in Uncategorized
19 Comments