
Creepy ass cracka chases down cute 12 year old Obamason lookalike who went to the store for candy, profiles him and kills him in cold blood – while he screams for help.

Thus summary provided by the world class professionals at NBC News.
Creepy ass cracka chases down cute 12 year old Obamason lookalike who went to the store for candy, profiles him and kills him in cold blood – while he screams for help.
Thus summary provided by the world class professionals at NBC News.
Climate change
When you have regular droughts or ones over a 15-year span, when does it stop being an abnormal weather pattern and become your new climate?
That’s a tough question to answer. Stooksbury said this weather pattern is similar to one Georgia experienced from the mid-1920s through the mid-1930s, so it could be part of a periodic cycle.
Or it could indicate the new direction the Southeastern climate is headed. Climatologists won’t be able to tell for about 10 more years.
“Our computer models don’t help us on this,” Stooksbury said. “That’s one of the frustrations. The computer long-term climate models for the Southeast are all over the place. Some have us wetter, some drier. Some have us wetter but with much more variability.”
Marshall Shepherd, director of the Atmospheric Sciences program at the University of Georgia, pointed to Columbia University research after the drought that ended in 2008.
“The frequency and perhaps intensity of droughts is consistent with what models say would occur with climate change,” he said.
“There is likely some shift in our climate that is occurring and creating new norms,” said Tom Mote, head of the UGA Geography department. “(The National Oceanic and Atmospheric Administration) recently released its new 30-year climate normals, and ours are now warmer and drier than they were.”
Repeated droughts taking toll on midstate | Local & State | Macon.com
Some small melt ponds have appeared near the North Pole, about two weeks later than normal. Note that the Sun is already starting to descend towards the horizon, below the summer peak of 23.5º elevation

Oakland, California TV station KTVU put this information live on their news broadcast.
“the NTSB has confirmed that these are the names of the pilots”
[youtube=http://www.youtube.com/watch?feature=player_embedded&v=L1JYHNX8pdo]
h/t to Dave Stealy
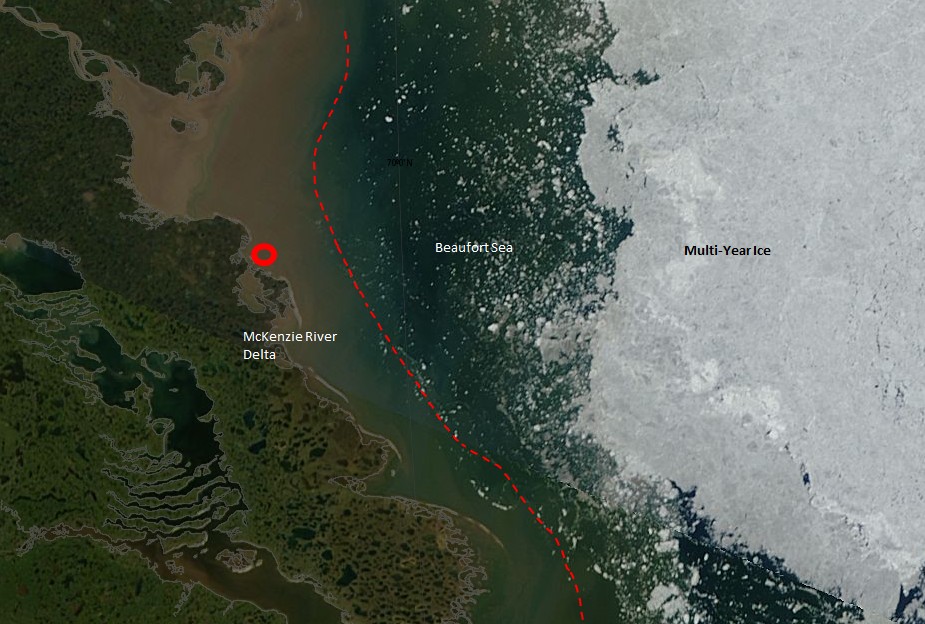
Red circle is the boat’s location. (We still haven’t seen any pictures of them actually rowing the boat.)
Left (south) of the red dashed line is dominantly muddy freshwater in the McKenzie River delta.
Right (north) of the red dashed line is Beaufort Sea saltwater.
Large bright ice mass on the right is multi-year ice, which is being pushed by the wind towards the coast. The image was taken three days ago. The ice is closer to shore now, but is obscured by clouds.
The prosecution failed to produce any evidence showing that Zimmerman committed murder, and the star prosecution witnesses made complete fools out of prosecution lawyers – so the jury is having a tough time deciding if they proved guilt beyond a reasonable doubt.
The graphs below were generated using all reported HCN temperatures on July 13, 1936 and July 13, 2012.
On July 13, 2012 four percent of the US was over 100F, compared to forty percent in 1936. Remarkably, the 1936 area over 110F was almost the same area as the 2012 area over 100F.
The summer of 1936 was much hotter than the summer of 2012, but through the magic of extreme data tampering, NOAA has been able to convince many people that 2012 was the hottest year ever.
During July 1936, Ada, Minnesota recorded twelve consecutive days over 100F, eight consecutive days over 105F, and four consecutive days over 110F.

Climate alarmists get hysterical now over temperatures like this in Arizona. If it happened in Minnesota now, they would blame Republicans and call for immediately world communism to control the weather.
Only July 13, 1936 381 out of 949 reporting HCN stations were over 100F.
208 stations were over 105F – in Illinois, Indiana, Missouri, Indiana, Kentucky, Iowa, Wisconsin, Minnesota, Arizona, Oklahoma, South Dakota, Arkansas, Kansas, Michigan, Nebraska, Ohio, North Dakota, and California
Thirty-six stations were over 110F in Illinois, Indiana, Kentucky, California, Iowa, Missouri, Wisconsin, Arizona and Minnesota.
The weather in 1936 was far more extreme than anything experienced since CO2 hit 350 PPM.


