“He who controls the past controls the future. He who controls the present controls the past.”
? George Orwell, 1984
WMO just published this graph, which completely erased the cooling from 1940 to 1970.
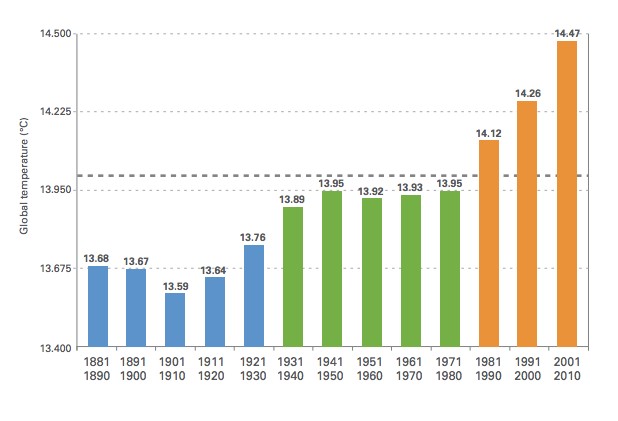
You can’t deny global warming after seeing this graph
In 1975, the National Academy of Sciences showed more than half a degree cooling in the Northern Hemisphere from 1940 to 1970, and that 1970 was no warmer than 1900.
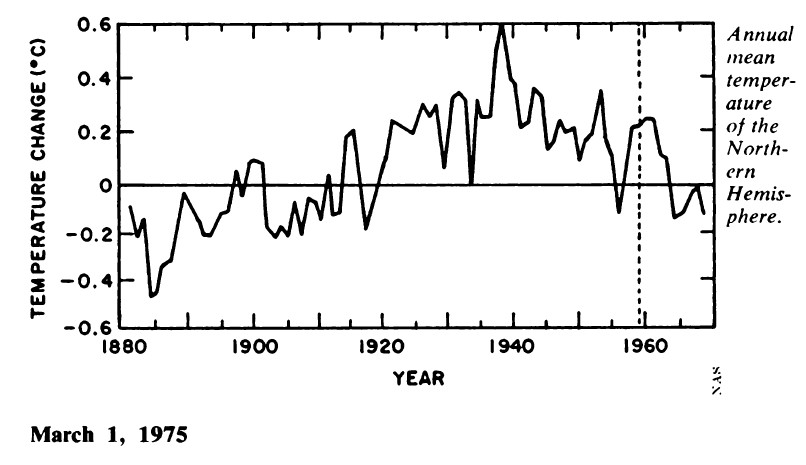
Science News
NCAR showed exactly the same thing in 1975.
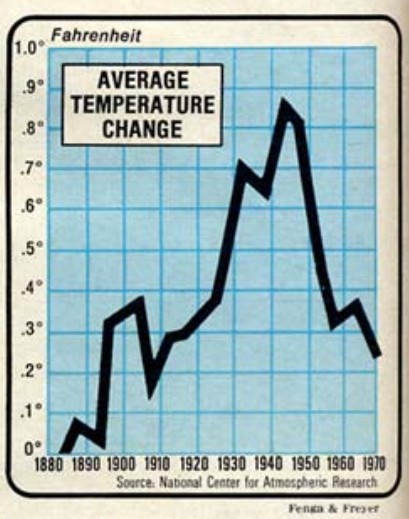
denisdutton.com/newsweek_coolingworld.pdf
The graph below overlays the 1975 National Academy of Sciences Northern Hemisphere graph on the current WMO Global graph, and shows how the UN has created a 100% political data set, which has no basis in the actual temperatures which were recorded.
The Northern Hemisphere data is not going to exactly match the global data, but both are driven by ENSO which means that it is not credible that the two hemispheres could be moving in opposite directions..
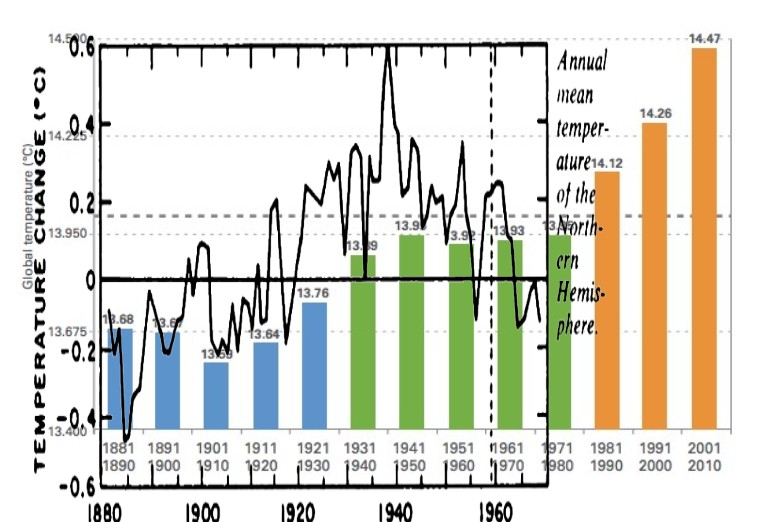
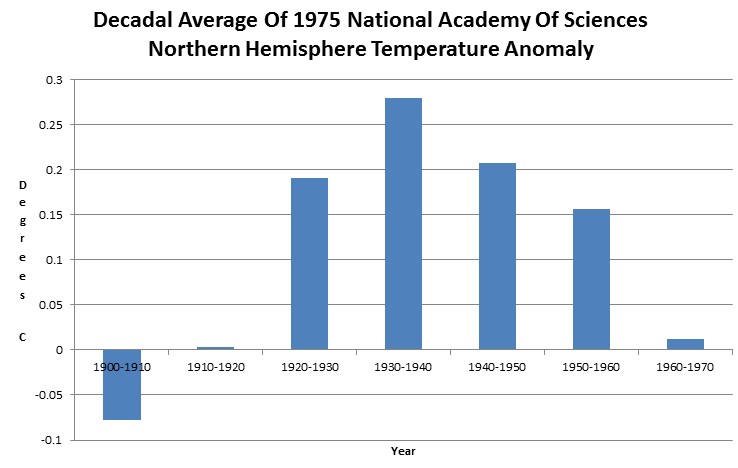
The next graph shows the decadal average of the NAS graph, calculated by numerical integration. Note that 1930-1940 was 0.25C warmer than 1960-1970, but through the magic of data tampering – WMO made the 1930s colder than the 1960s.