A couple of days ago I showed how Hansen had erased the global cooling scare. Mosher complained that I was comparing Hansen’s global temps with National Academy of Sciences northern hemisphere temperatures.
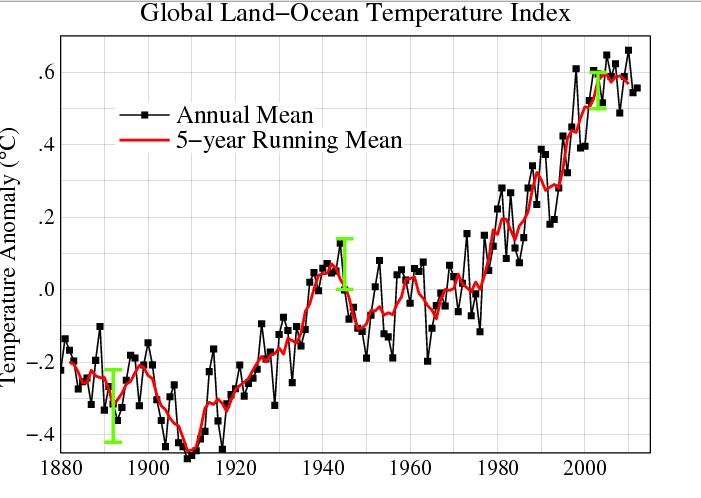
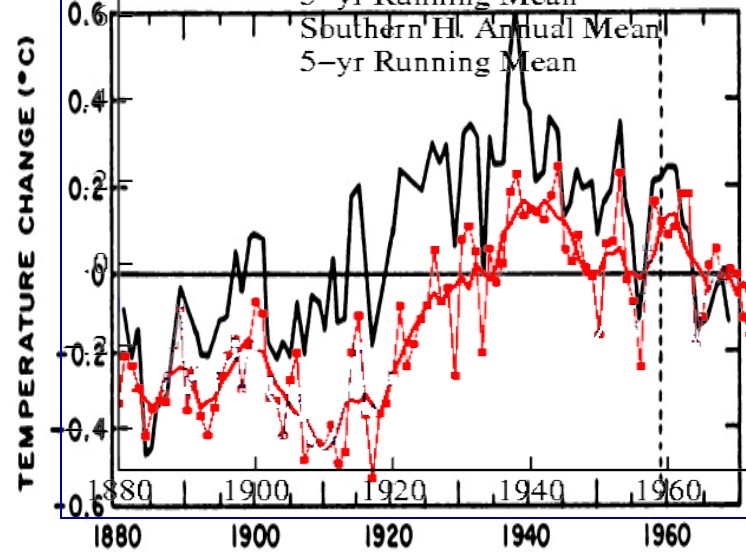
So here is the comparison which Mosher wanted, which shows how Hansen tampered with Northern Hemisphere temperatures. Black is the 1975 National Academy of Sciences version, and red is Hansen’s version. Hansen cooled the 1930s by about 0.3C, and cooled the entire period from 1895-1960. He wiped out half of the warming from 1880 to 1940.
The graph is normalized to +0.6 and -0.4, as the y-scale is not exactly linear in the 1975 graph. This makes Hansen look not quite as bad as if I had normalized it to zero.
Hansen Fig.A3.gif (625×474)
1975 National Academy Of Sciences