More evidence that vegetables are more intelligent than climate alarmists.
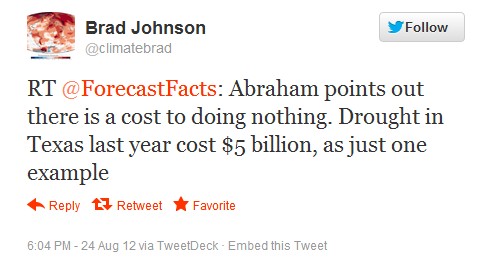
Twitter / climatebrad: RT @ForecastFacts: Abraham …
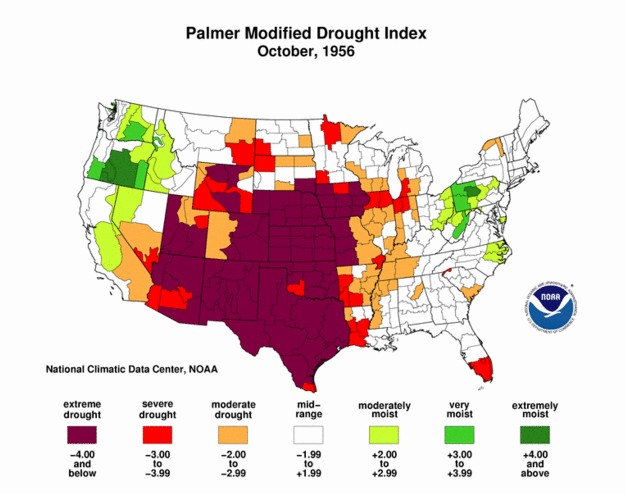
h/t to Marc Morano
More evidence that vegetables are more intelligent than climate alarmists.
Twitter / climatebrad: RT @ForecastFacts: Abraham …
h/t to Marc Morano
Bouncing around from one mindless paranoid fear to the other. The midwest was burning up, until it turned cold. They were obsessed with Greenland for a couple of hours. Now it is Arctic ice.
You alarmists are a bunch of total nutcases.
I’m guessing that bonuses at NOAA depend on the number of clouds which they name.
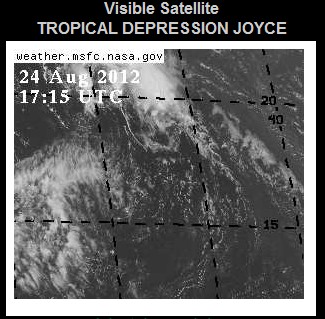
DISCUSSION AND 48-HOUR OUTLOOK
——————————
AT 500 AM AST…0900 UTC…THE CENTER OF TROPICAL DEPRESSION JOYCE
WAS LOCATED NEAR LATITUDE 16.9 NORTH…LONGITUDE 45.0 WEST. THE
DEPRESSION IS MOVING TOWARD THE NORTHWEST NEAR 14 MPH…22 KM/H. A
MOTION IN THIS DIRECTION AT A FASTER FORWARD SPEED IS EXPECTED
DURING THE NEXT TWO DAYS.
MAXIMUM SUSTAINED WINDS ARE NEAR 35 MPH…55 KM/H…WITH HIGHER
GUSTS. LITTLE CHANGE IN STRENGTH IS FORECAST DURING THE NEXT 48
HOURS.
Near 35 MPH at altitude in the middle of the Atlantic. Chalk another funny one up for the team.
An early winter storm broke the ice in the Chukchi Sea up into chunks of a size which microwave sensors are missing, so the alarmist community goes full stupid over their own defective measurements.
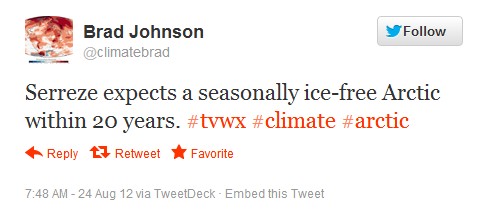
Twitter / climatebrad: Serreze expects a seasonally …
Summer temperatures north of 80N have been running below the long term mean for many years, and the ice there is several metres thick. How could anyone be daft enough to predict an ice-free Arctic?
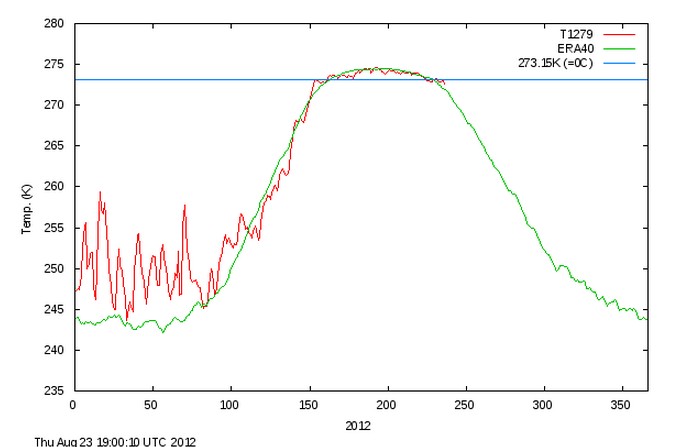
COI | Centre for Ocean and Ice | Danmarks Meteorologiske Institut
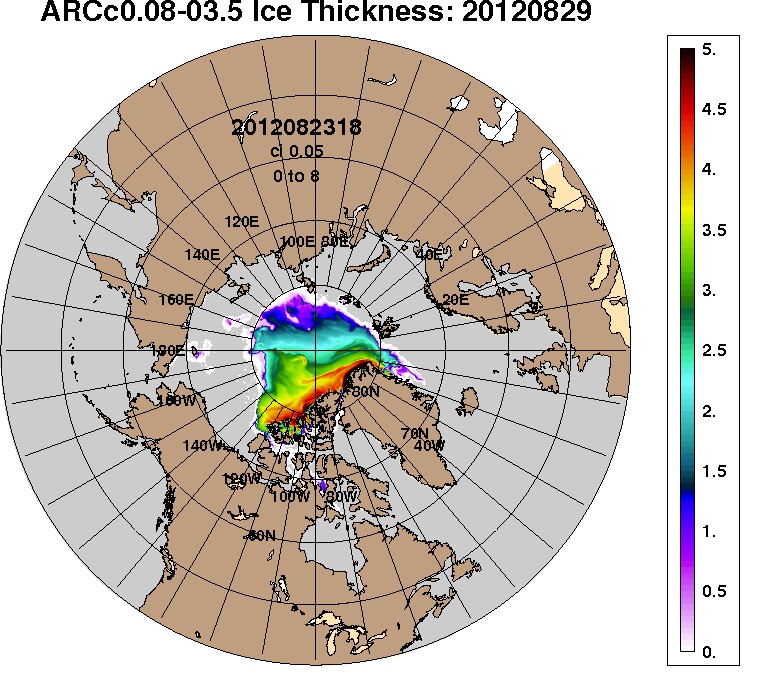
arcticictn_nowcast_anim30d.gif (740×666)
There is plenty of ice up there, but your methodology and thought process is broken, Mark Serreze
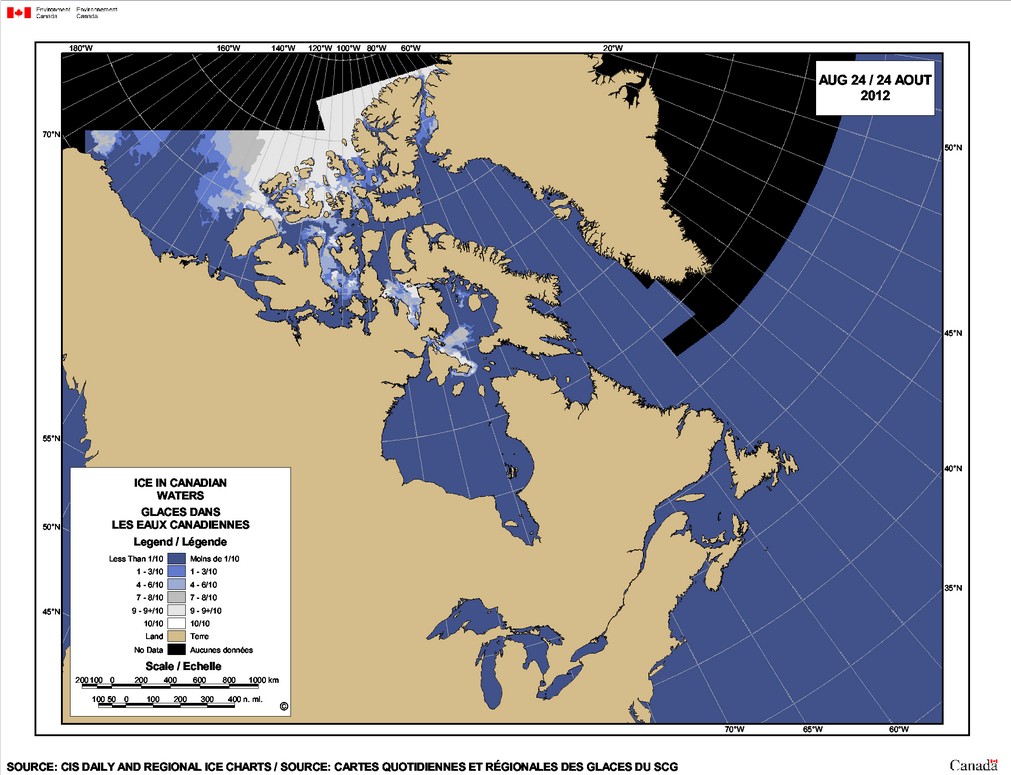
Your own web site says that you miss a large percentage of the summer ice.
“NIC charts are produced through the analyses of available in situ, remote sensing, and model data sources. They are generated primarily for mission planning and safety of navigation. NIC charts generally show more ice than do passive microwave derived sea ice concentrations, particularly in the summer when passive microwave algorithms tend to underestimate ice concentration. The record of sea ice concentration from the NIC series is believed to be more accurate than that from passive microwave sensors, especially from the mid-1990s on (see references at the end of this documentation), but it lacks the consistency of some passive microwave time series.”
Fabius tells us that you can’t do Google news searches from the 19th century and that Google news hasn’t scrubbed their Goderich Obama stories from May
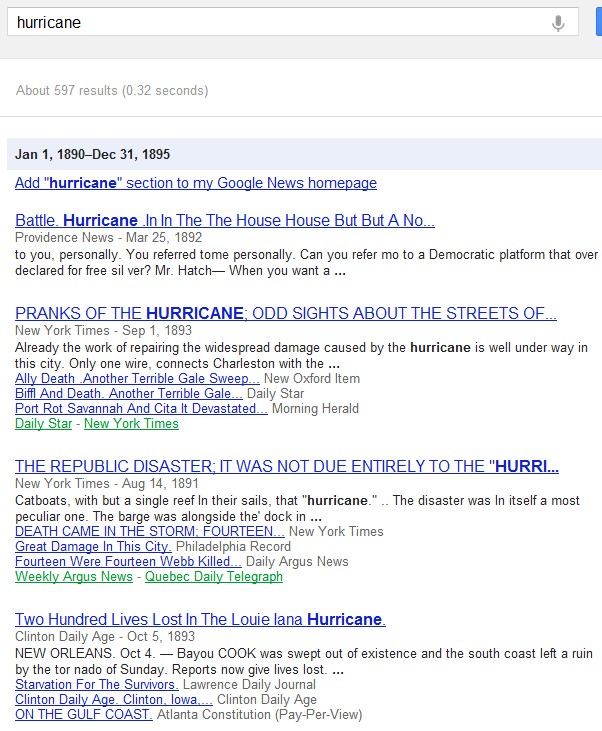

We are all going to freeze to death. It is all the fault of global cooling deniers. They made this happen.
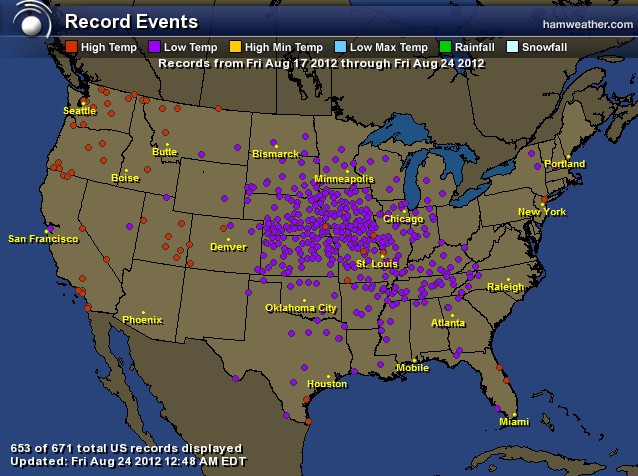
HAMweather Climate Center – Record Events for The Past Week – Continental US View
USADA TO STRIP LANCE ARMSTRONG OF 7 TOUR TITLES
The federal probe was closed in February, but USADA announced in June it had evidence Armstrong used banned substances and methods – and encouraged their use by teammates. The agency also said it had blood tests from 2009 and 2010 that were “fully consistent” with blood doping.
The definition of “fully consistent” is that they are on a mission and have little or no evidence. The fall in temperatures after 1950 was fully consistent with entering an ice age.
“NIC charts are produced through the analyses of available in situ, remote sensing, and model data sources. They are generated primarily for mission planning and safety of navigation. NIC charts generally show more ice than do passive microwave derived sea ice concentrations, particularly in the summer when passive microwave algorithms tend to underestimate ice concentration. The record of sea ice concentration from the NIC series is believed to be more accurate than that from passive microwave sensors, especially from the mid-1990s on (see references at the end of this documentation), but it lacks the consistency of some passive microwave time series.”
http://nsidc.org/data/g02172.html
h/t to Ron C
In 1955, major hurricane Connie struck Virginia. Since then, the only other hurricane was category 2 Isabel in 1993.
During the 1870s (when CO2 was very safe) Virginia was hit by three hurricanes, including a major hurricane.