
Paging Hansen. A full week between 127 and 134F – when CO2 was very low. Isn’t that impossible?
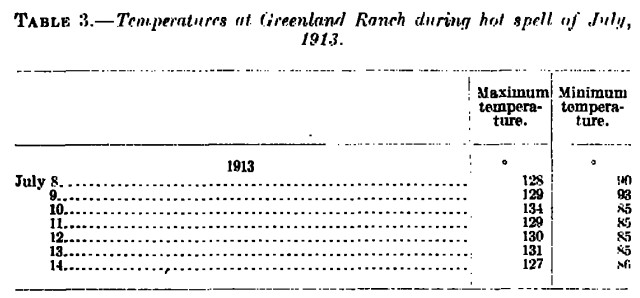
docs.lib.noaa.gov/rescue/mwr/050/mwr-050-01-0010.pdf
Romm says that everything melts at 113F, so things must have been a real mess in 1913.
Paging Hansen. A full week between 127 and 134F – when CO2 was very low. Isn’t that impossible?
docs.lib.noaa.gov/rescue/mwr/050/mwr-050-01-0010.pdf
Romm says that everything melts at 113F, so things must have been a real mess in 1913.
Damien Biggs says:
I’m not sure exactly what argument you’re trying to make.
Records by their very definition only go upwards.
This line
There were twice as many daily all-time high temperature records set or tied during the 1930s as in the 2000sdoesn’t actually mean that the 30s were warmers than the 2000s! If Septemer 20th 1931 set an all time record of 120 degrees then 120 degrees on September 20th 2005 wouldn’t break that record. If you’re skeptical about global warming surely it would be better to present data that shows that previous decades were actually warmer.
Had I actually used the algorithm Damien claims I did, the graph would look like this. Every day at every station would have been a record in the first year.
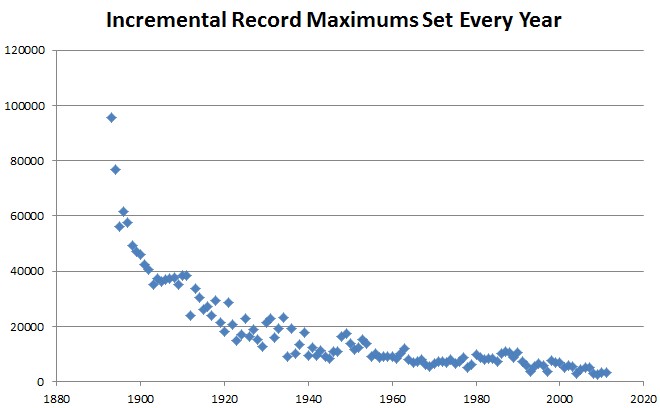
A little thought before posting can be a good thing.
Romm and Masters keep touting the ratio of record maximums to record minimums this summer, but their numbers are both lower than 1936, and hugely skewed by a large number of newer stations which had no records from the 1930s. Not to mention UHI – which keeps recent nighttime temperatures up.
Here are some legitimate numbers from 1936, which use only the USHCN stations that have 80+ year long databases.
June 1936 TMax/Tmin = 18 / 1
July 1936 TMax/Tmin = 19 / 1
August 1936 TMax/Tmin = 14 / 1
I won’t be able to do any analysis of the 2012 numbers until USHCN releases them next year, but they won’t be anywhere close to 1936.
The summer of 1936 was much hotter than the summers of 2011 or 2012. Hansen is a disgrace to NASA and science in general.
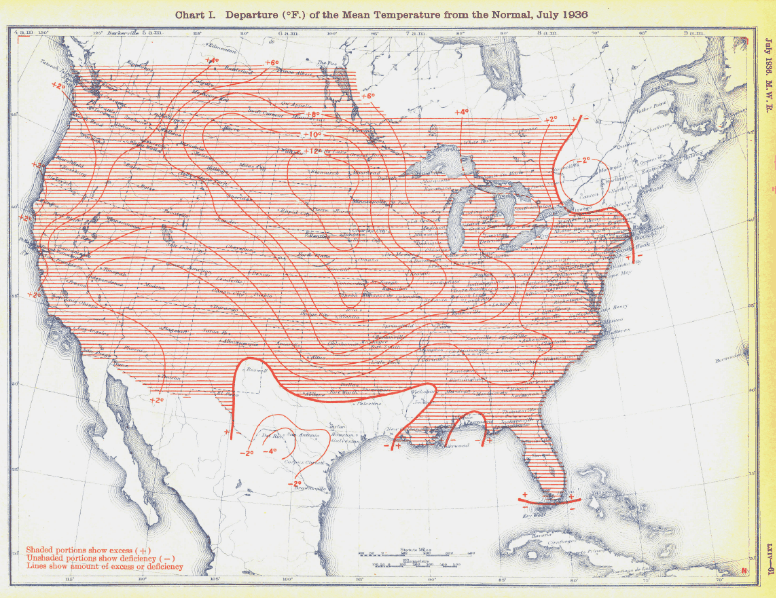
http://docs.lib.noaa.gov/rescue/mwr/064/mwr-064-07-c1.pdf
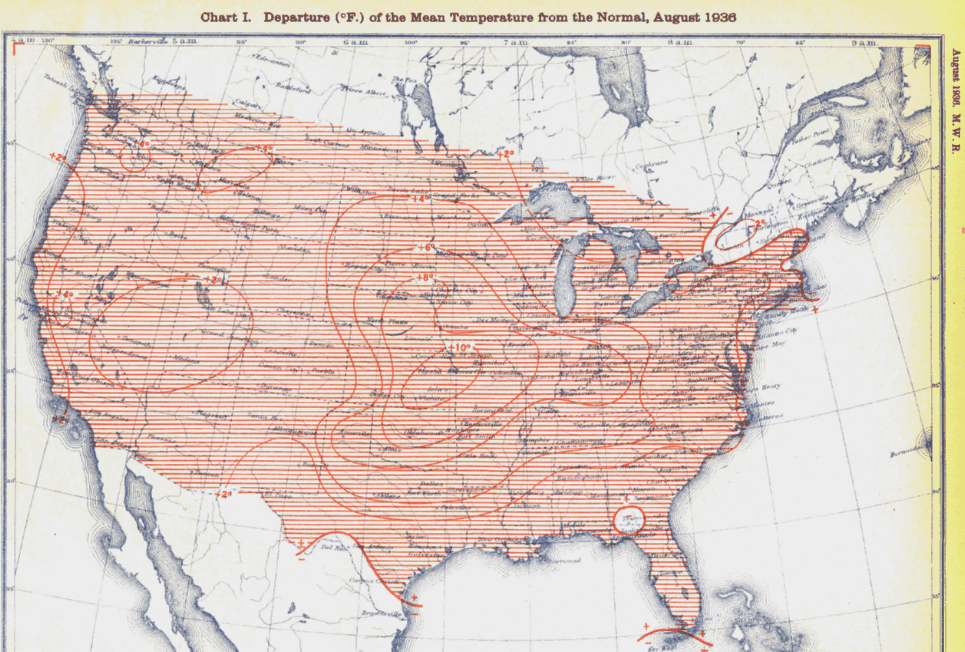
http://docs.lib.noaa.gov/rescue/mwr/064/mwr-064-08-c1.pdf

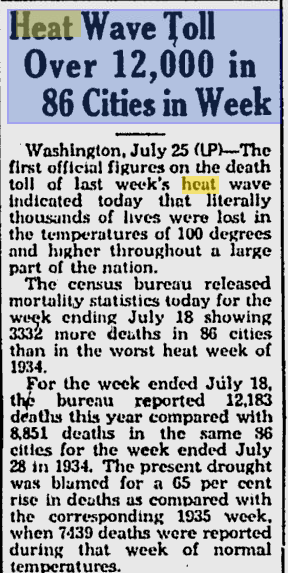
http://news.google.com/newspapers


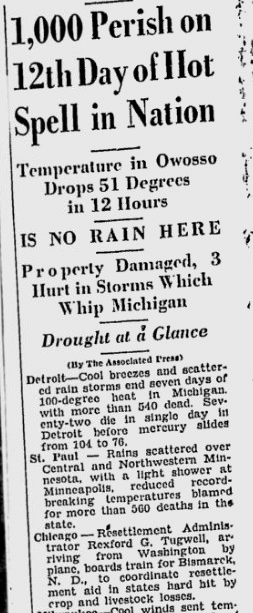
http://news.google.com/newspapers

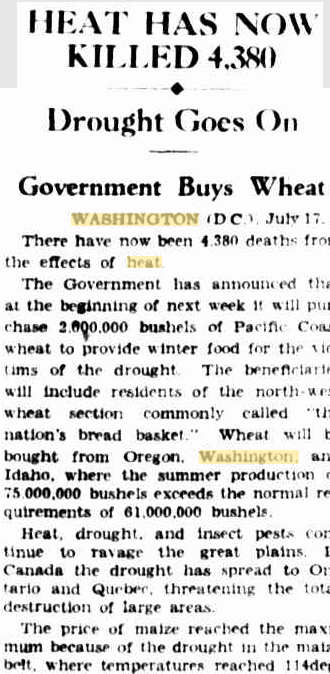
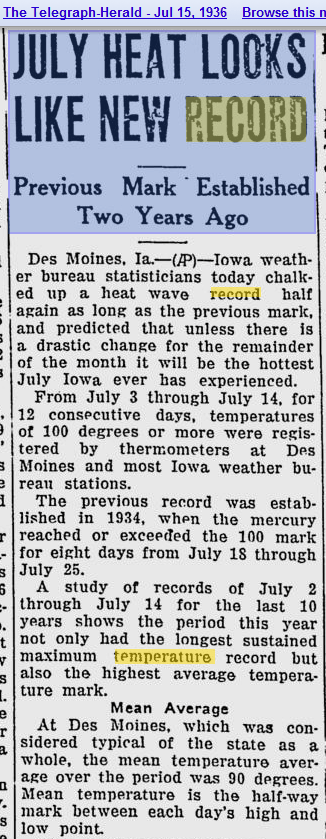
Time of observation bias can not affect record high temperatures.
The forecast for Meeker on August 10, 2012 is twenty-two degrees cooler than 1936.
Oklahoma August 10, 1936
  MEEKER 5 W     	119
  DURANT         	118
  HOLDENVILLE 2SS	118
  MUSKOGEE       	118
  TAHLEQUAH      	118
  JEFFERSON      	117
  ANTLERS        	116
  CARNEGIE 5 NE  	116
  CLAREMORE 2 ENE	116
  ENID           	116
  GUTHRIE 5S     	116
  PERRY          	116
  ADA            	115
  ALTUS IRIG RSCH	115
  HENNESSEY 4 ESE	115
  KINGFISHER     	115
  OKEMAH         	115
  WEBBERS FALLS 5	115
  CHEROKEE       	114
  MIAMI          	114
  NEWKIRK 1NW    	114
  OKMULGEE WTR WK	114
  STILLWATER 2 W 	114
  ARDMORE        	113
  BARTLESVILLE MU	113
  LAWTON         	113
  MUTUAL         	113
  PAULS VALLEY 4 	113
  PAWHUSKA       	113
  GEARY          	112
  HOBART MUNI AP 	112
  MANGUM         	112
  WAURIKA        	112
  WEATHERFORD    	112
  BUFFALO 2 SSW  	111
  BEAVER         	110
  HOOKER         	106
  GOODWELL RSCH S	105
  BOISE CITY 2 E 	101
  KENTON         	101
  DAYTON 1 WSW   	114
  RITZVILLE 1 SSE	112
  ODESSA         	110
  POMEROY        	109
  KENNEWICK      	108
  NORTHPORT      	108
  WILBUR         	105
  SUNNYSIDE      	103
  DAVENPORT      	102
  WENATCHEE      	102
  WINTHROP 1 WSW 	102
  ELLENSBURG     	100
Temperature forecast for Dayton today is 97
August 1936 was spectacularly hot in much of the central and eastern US, but it isn’t happening in 2012. Their strategy of pouring on the lies during hot weather has hit a brick wall.
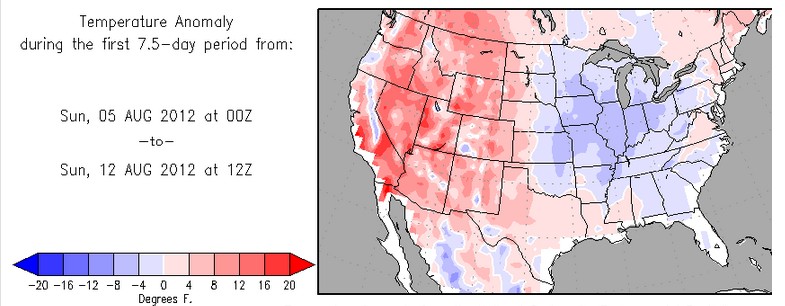
You can’t make this stuff up. He claims that the weather is the most extreme in 10,000 years based on a baseline of “the last few decades”
[youtube=http://www.youtube.com/watch?v=TX2KyF0p-xU]
What a brazen liar this man is. He wrote the exact opposite ten years ago.
Empirical evidence does not lend much support to the notion that climate is headed precipitately toward more extreme heat and drought. The drought of 1999 covered a smaller area than the 1988 drought, when the Mississippi almost dried up. And 1988 was a temporary inconvenience as compared with repeated droughts during the 1930s “Dust Bowl” that caused an exodus from the prairies, as chronicled in Steinbeck’s Grapes of Wrath.
There were twice as many daily all-time high temperature records set or tied during the 1930s as in the 2000s, for USHCN stations which were operational during both decades. That is why he doesn’t start his baseline until the 1950s.
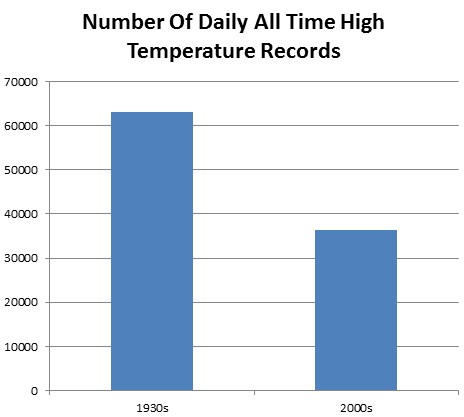
Perhaps the 1930s was more than 10,000 years ago?
Barring a huge change in the weather, the map below shows the minimum possible extent for 2012 vs. 2007
Green is 2012 and red is 2007. This is based on current ice thickness and temperature forecasts. Chances are that 2012 will finish larger than what I showed, because there is a lot of MYI in the Chukchi Sea which is not likely to melt out.
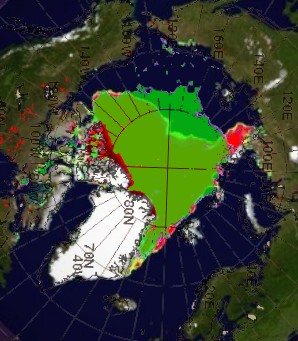
The only thing which could change this would be very strong southerly winds, like those which occurred in late summer 2007.
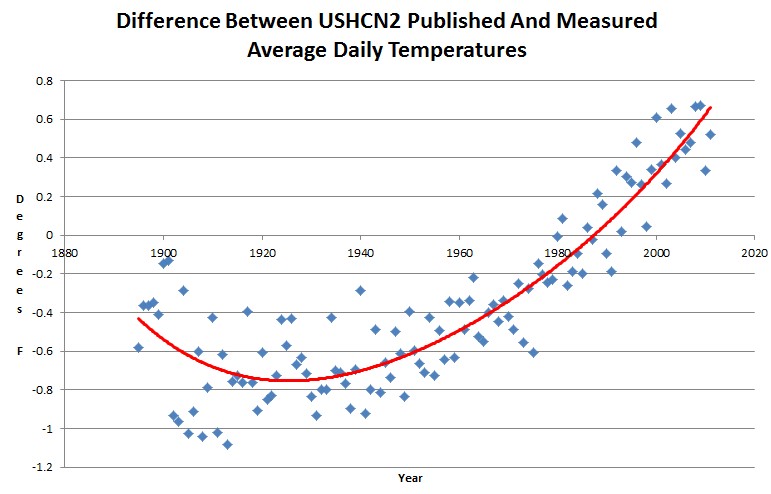
According to Tom Karl, Americans are very stupid people who have severe trouble taking temperature readings – except during the year 1988. Americans are currently in an exponentially increasing stupid state, where temperatures need to be adjusted upwards by more and more every year.
In other words, USHCN is desperately trying to hide the decline.

