Disrupting the Borg is expensive and time consuming!
Google Search
-
Recent Posts
- Bullseye!
- It’s Getting Closer
- Greenland Meltdown Scam
- Greenland Ice Update
- Wyoming Gold
- Three Years Since The Apocalypse
- Arctic Report card Summer 2026
- Elon Pushing Pushing Geoengineering
- Earth, Wind And Fire
- On The Road Again
- Vandalism At The Reflecting Pool
- Fifty Years Ago Today
- Truth Or Consequences
- US Climate Trend Maps
- Declining Spring Snow Cover In Northern New Mexico
- You Can’t Fool Mother Nature
- Cattle And The Climate
- One Atomic Bomb Per Hour
- New Video : Analyzing Oil And Gas
- Is Antarctica Melting?
- High Speed Analysis And Visualization
- El Nino To The Rescue?
- Fake News Update
- Growth Of Antarctic Sea Ice
- 65 Years Of Progress!
Recent Comments
- Stuart Hamish on Three Years Since The Apocalypse
- Stuart Hamish on Cattle And The Climate
- Bob G on Bullseye!
- conrad ziefle on Bullseye!
- arn on Greenland Ice Update
- D. Boss on Bullseye!
- scott allen on Bullseye!
Waiting For That Greenland Tsunami
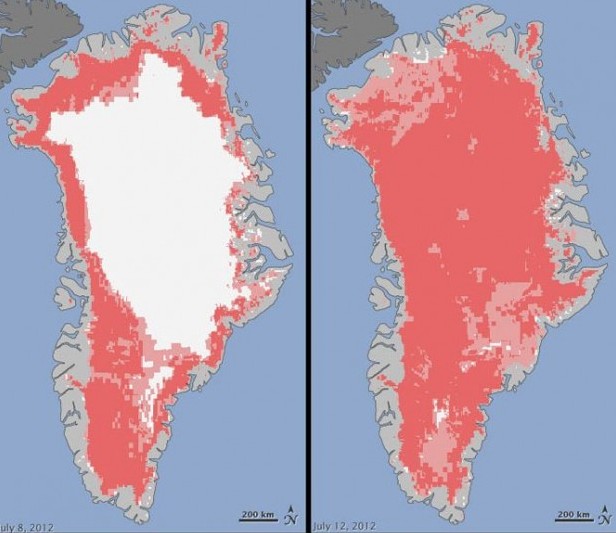
According to NASA, Greenland experienced a massive ice melt last week which turned the entire country red hot and apparently melted all the ice.
It is surprising that no one issued a tsunami warning, because our beaches must certainly have drowned by now.
NASA also says that if this predictable, cyclical event continues to be cyclical and predictable – we should be worried.
Although some of these descriptions aren’t entirely untrue, even within NASA’s own announcement of this observation, a Goddard Space Flight Center scientist said these types of melting events occur every 150 years, on average.
With the last event happening in 1889, Lora Koening said “this event is right on time.”
She does note that if strong melting events like this continue in future years, “it will be worrisome.”
Indeed, I’m worried that the sun will come up tomorrow, and it will heat up my side of the planet.
Posted in Uncategorized
4 Comments
Note To Alarmists
If you have to lie, cherry pick and deceive – then your belief system isn’t worth the cheap recycled toilet paper it is written on.
Posted in Uncategorized
9 Comments
Jeff Masters Continues To Lie About The Heatwave
St. Louis is seeing some unbelievable heat this summer: On Wednesday, the city hit 108 degrees, Weather Underground meteorologist Jeff Masters said. “This marked the 11th day this summer in St. Louis with temperatures of at least 105 degrees,” he says, “beating the old record of 10 such days in 1934.”
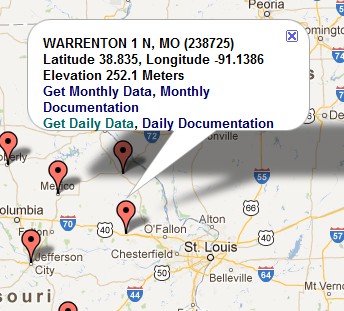
The closest USHCN station to St. Louis is at Warrenton, Missouri. Here are their official maximum temperatures for July 1936.
88 94 97 104 104 102 104 103 103 106 105 106 107 111 111 104 104 100 100 91 91 96 105 105 106 107 108 104 93 90 89
There were eleven days 105 and above and two days 110 and above. The average high that month was 101.23 They had sixteeen days in a row over 100 degrees.
July 2012 has seen no days over 110 and the average maximum has been 99 degrees – more than two degrees cooler than 1936. The longest stretch over 100 degrees this month was four days.
July 1936 was much hotter in St. Louis than July 2012.
Posted in Uncategorized
27 Comments
Meltdown #2 Begins
Posted in Uncategorized
2 Comments
Pachauri Proves He Is Scientifically Incompetent Again
Railroad engineer Pachauri demonstrates once again that he understands nothing about science
“it’s possible that part of this huge body of ice (Greenland) could collapse, and fall into the ocean which would lead to several meters of sea level rise.
Mindless drivel. The Greenland ice sheet is a 3 km thick chunk of ice spread across a 1000 km wide island. You could visualize it as being a thick piece of paper. Can you imagine a piece of paper lying flat on a table, collapsing?
But it is worse than it seems. The land under the ice sheet is depressed due to the weight of the ice above it, and is bowl shaped. Furthermore, the island is full of mountain ranges buried under the ice – which prevent lateral movement.
Perhaps Pachauri thinks that ice cream can spontaneously jump out of a bowl? What a maroon.
Posted in Uncategorized
23 Comments
Visualizing The Magnitude Of The NCDC July 2012 Fraud
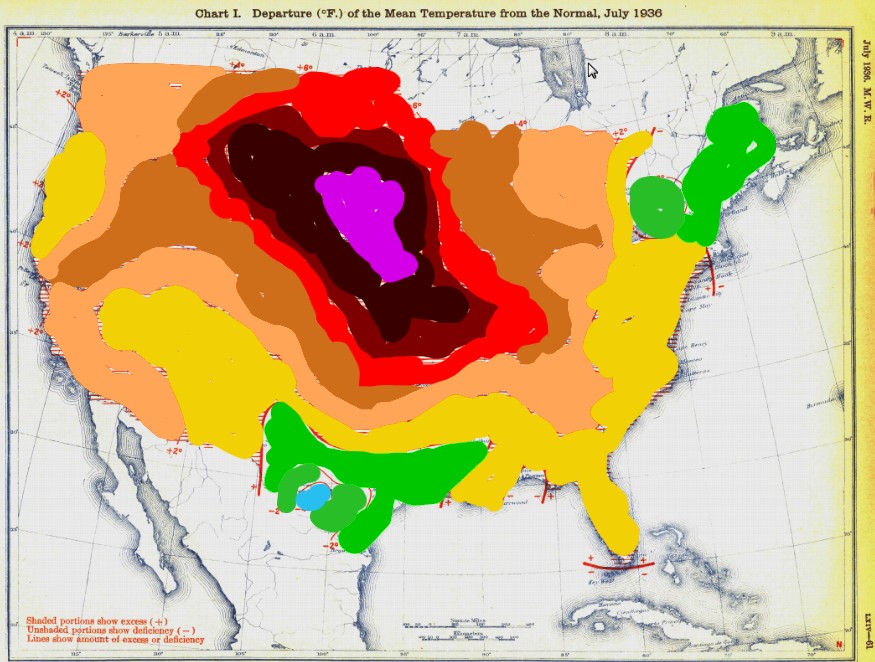
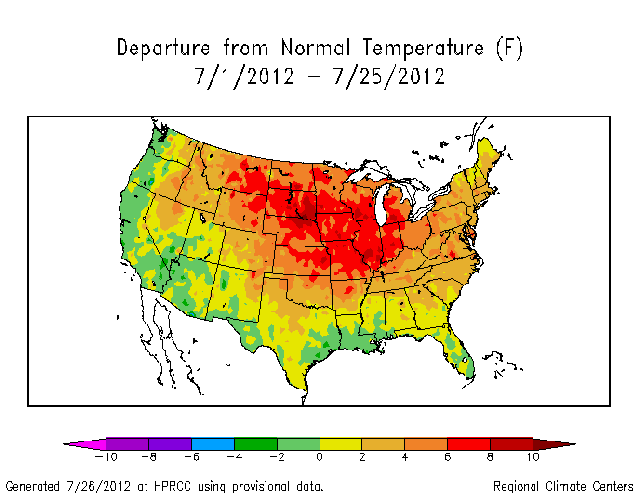
I painted in the July 1936 temperature anomaly map with the same color scale as the July 2012 map, with pink added for +12 anomaly. As you can see, July 1936 was much hotter than July 2012 over 70% of the US – but that isn’t going to stop NOAA from claiming that 2012 was the hottest.
Posted in Uncategorized
8 Comments
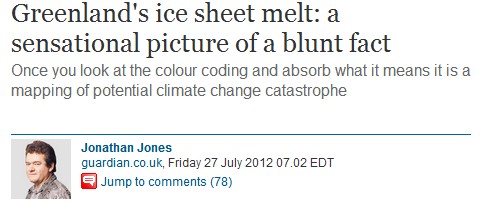
Jonathan Jones Gets The Full Stupid Award For The Morning
Greenland’s ice sheet melt: a sensational picture of a blunt fact
The NASA report which he is referring to, said that the non-event which just happened occurs every 153 years and was right on schedule.
What kind of moron would interpret a cyclical event which is right on schedule – as being due to climate change?
Posted in Uncategorized
14 Comments
NCDC Setting Up the Big July Lie
With five days to go in July, preliminary data show that the heat could top records set decades ago: “The warmest July for the contiguous U.S. was in 1936, when the nationally averaged temperature was 77.43 degrees, 3.14 degrees above average,” said climate scientist Jake Crouch of the National Climatic Data Center.
The actual average temperature for July 1936, before they adjust it down – is 77.93 degrees. They knocked it down half a degree from the measured daily temperatures.
Preliminary data from the center show the national temperature for the first three weeks of July was 3.63 degrees above average. If the heat continues, and after the data are more closely analyzed, that would top July 1936.
How horrid? July on pace to be hottest month on record – USATODAY.com
Complete bullshit. July, 1936 was much hotter, but they now upwards adjust more than 1.5 degrees on to the monthly temperature relative to 1936.
Compare the huge region of +10 and +12 degrees in 1936 to the tiny region of +8 in 2012. The area of +10 was probably two hundred times larger in 1936. There is no +12 in 2012. Every band +2 or above was much larger in 1936.
This July isn’t even close to 1936, but by tampering with the data they get the political result they are looking for. I doubt that July 2012 is even in the top five without their tampering.
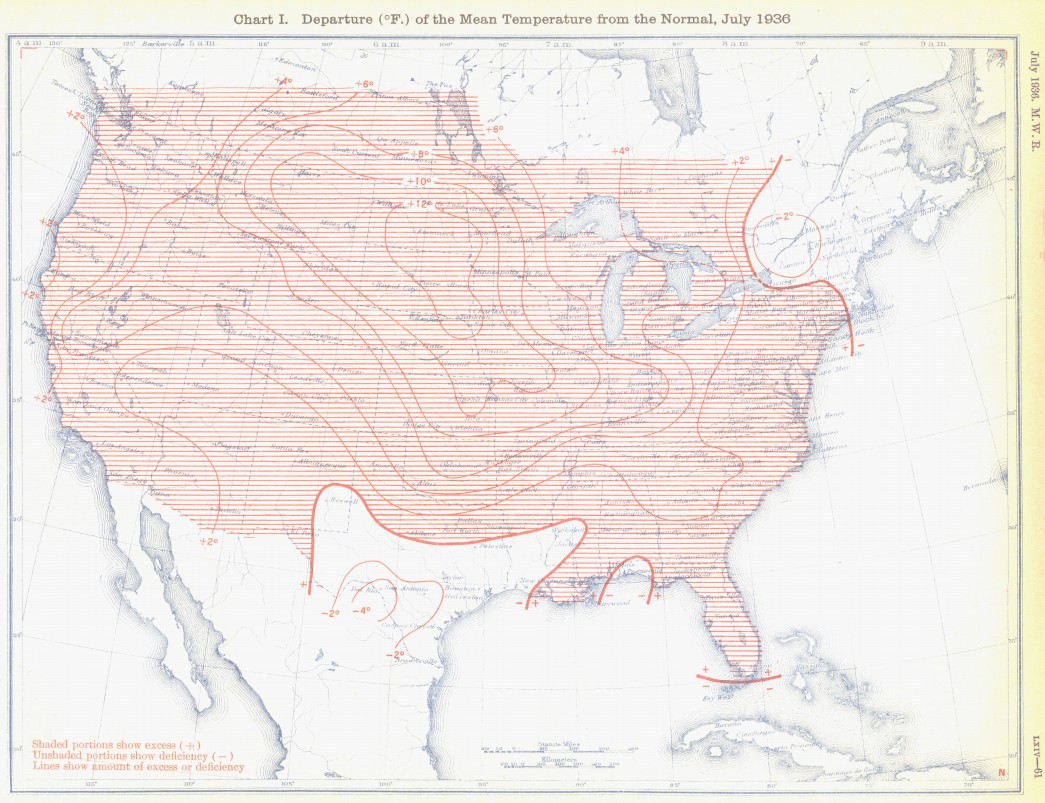
docs.lib.noaa.gov/rescue/mwr/064/mwr-064-07-c1.pdf
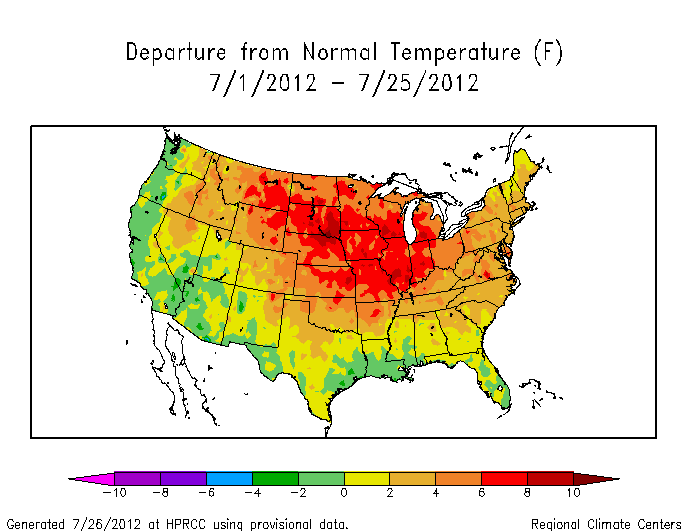
Just another huge climate scandal in the making.

Posted in Uncategorized
18 Comments