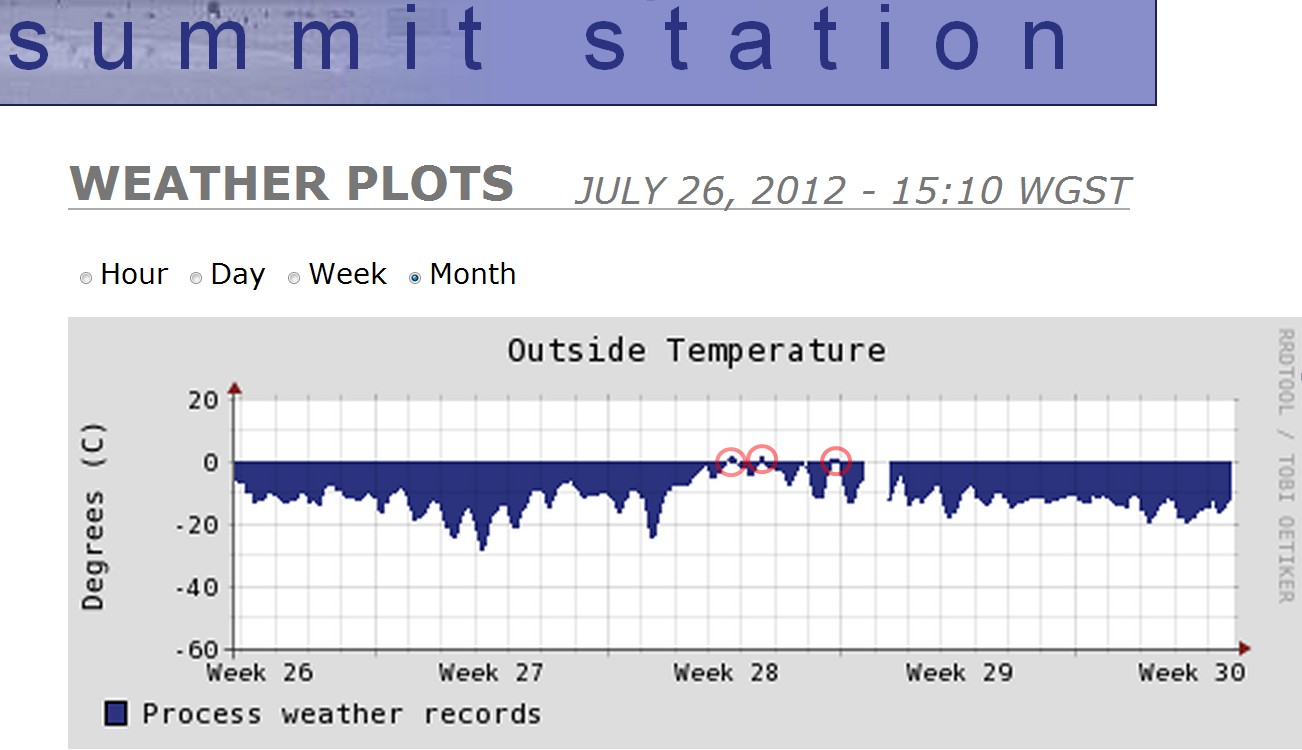
NASA is obsessed with three or four of hours when temperatures got barely above freezing.
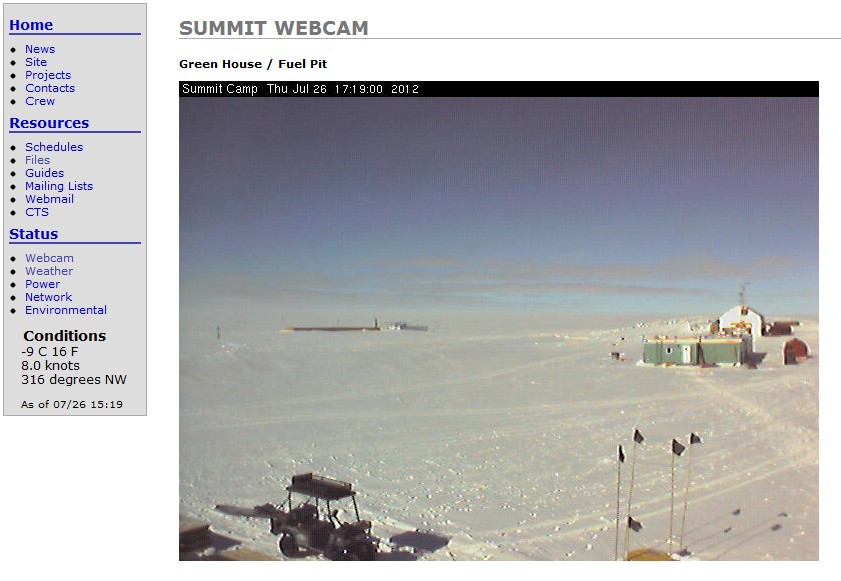
Someone parked their golf cart on the green again.
NASA is obsessed with three or four of hours when temperatures got barely above freezing.
Someone parked their golf cart on the green again.

This is what melting ice in Greenland looks like. There is a 100 mile wide strip on the southwest coast of Greenland which is covered with dirt and soot and is melting. It does this ever summer.
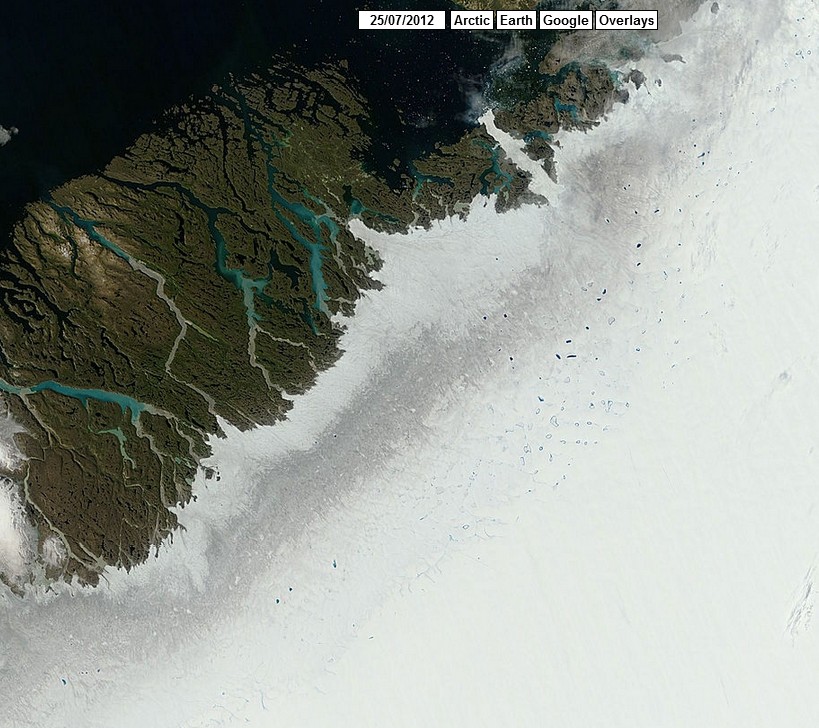
//ARCTIC.IO/OBSERVATIONS/8/2012-07-25/Greenland

The rest of the ice sheet (95% +) is zinc-oxide white, and is not melting. The demarcation line between melting and not melting is very clear.
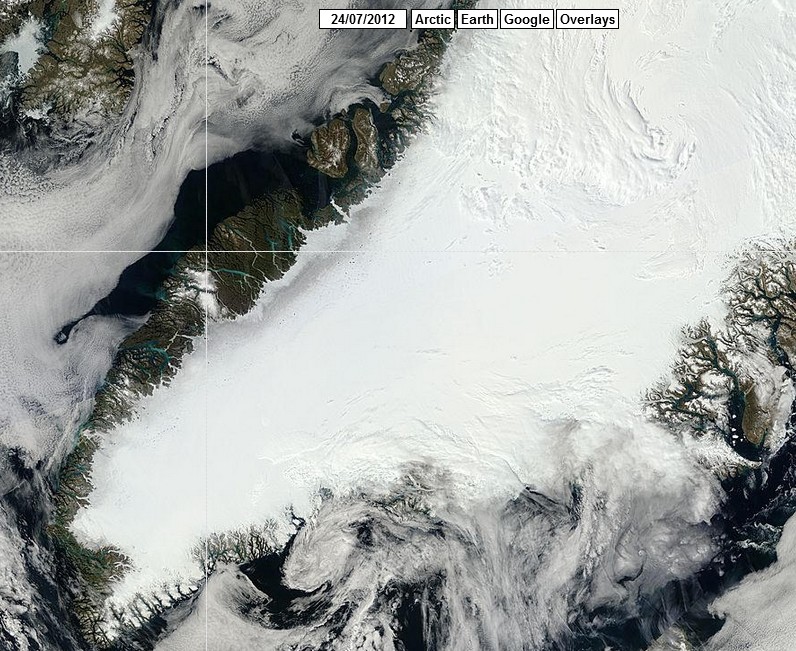
When these experts talk about unprecedented melting, you can be pretty certain that they either didn’t pass third grade or they are spewing propaganda rather than science.
Bookmark this – it is important.
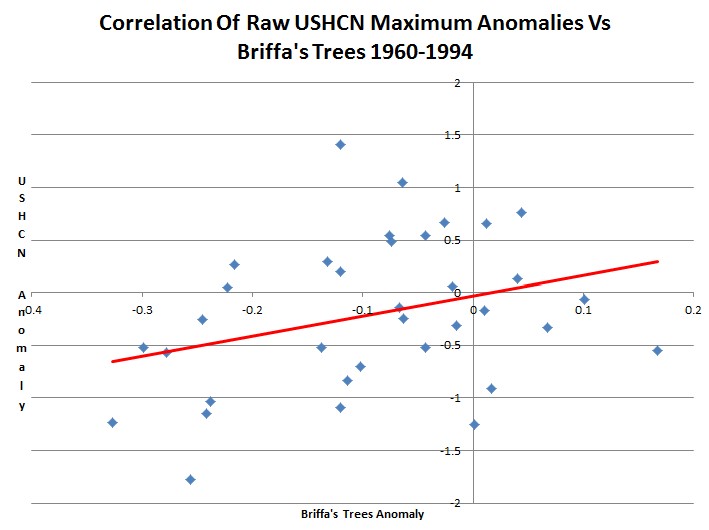
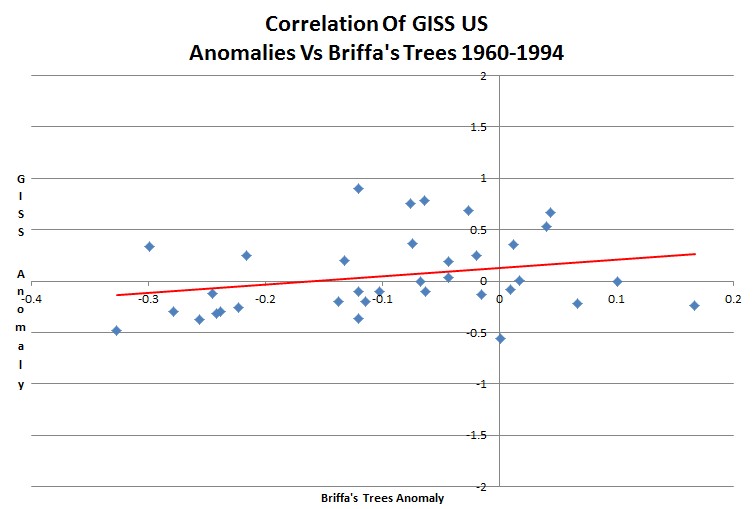
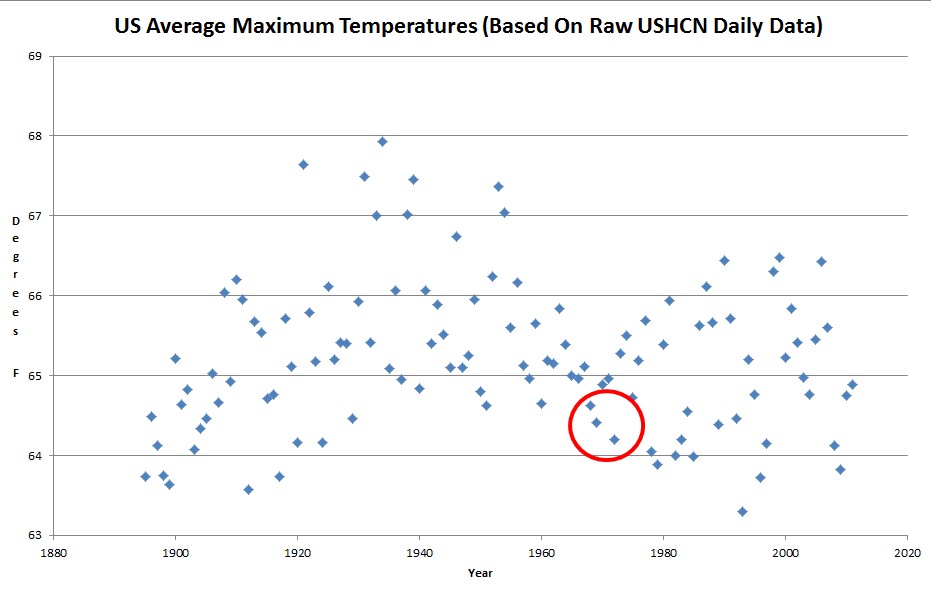
The graph below plots the correlation between raw USHCN maximum temperatures and Briffa’s trees from 1960-1994. Those are the trees which Mann threw out when he did his nature trick. The correlation is pretty decent (rsq=0.103) considering that the USHCN data only covers the US. The USHCN anomalies are calculated vs. the average raw maximum temperature from 1895-2011.
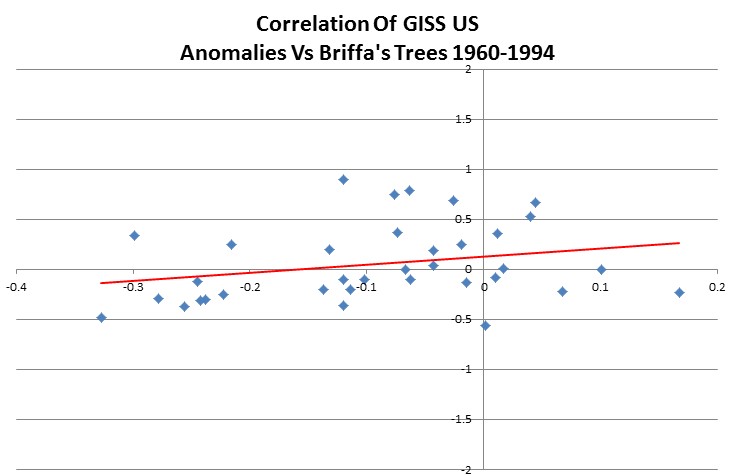
The next graph shows the weaker correlation (rsq=0.066) between GISS US adjusted temperatures and Briffa’s trees from 1960-1994.
Here are the adjustments which Hansen has made to the US data vs. what he published in 1999. (Note how they look just like a hockey stick.)
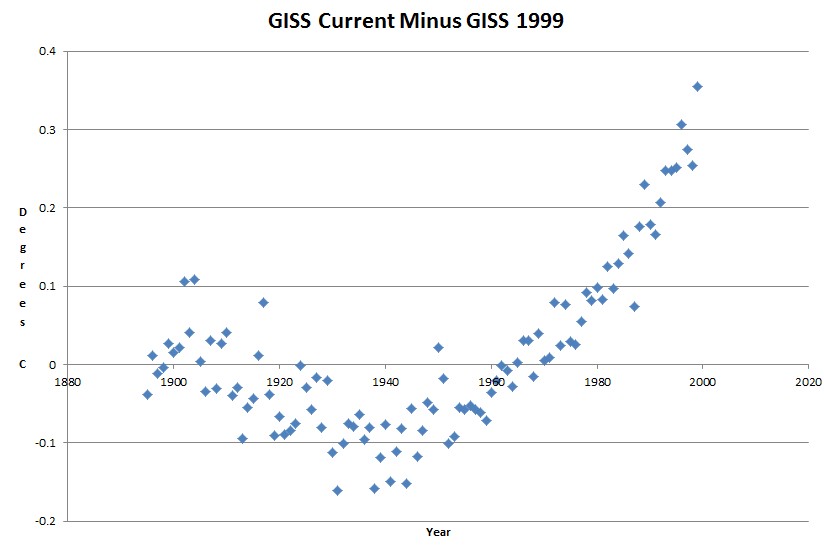
This shows us two things.
This is an amazing story. Hansen made incorrect adjustments to the data. Mann looked at the incorrect adjustments and decided to throw out the tree ring data – because they didn’t match the incorrect adjustments. Then Mann replaced the correct tree ring data with the incorrectly adjusted data – based on the belief that a rise from 318 to 319 PPM CO2 had somehow corrupted the trees’ ability to function properly.
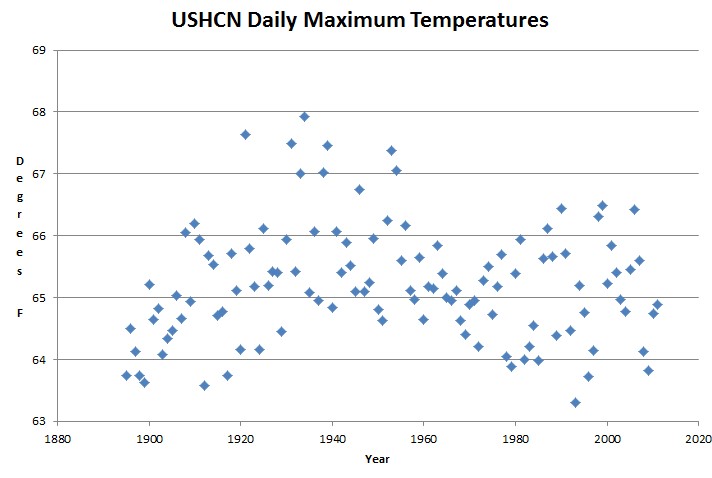
The USHCN data I have been plotting for the entire US has a warming bias to it. The density of USHCN stations is higher in the northeast, where there has been a warming trend.
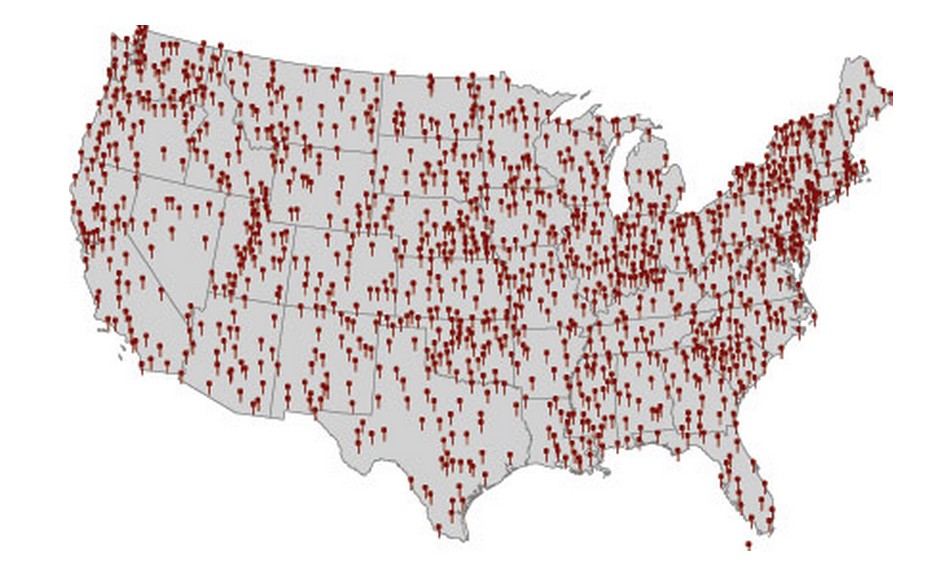
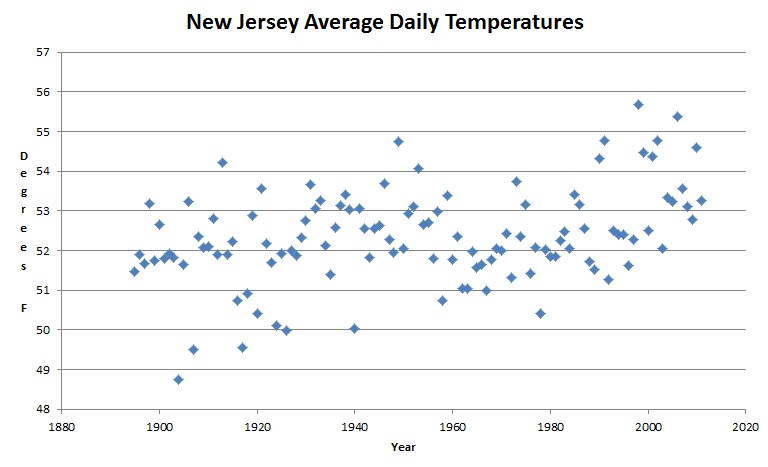
By contrast, Texas has a much lower density of stations, and shows a cooling trend.
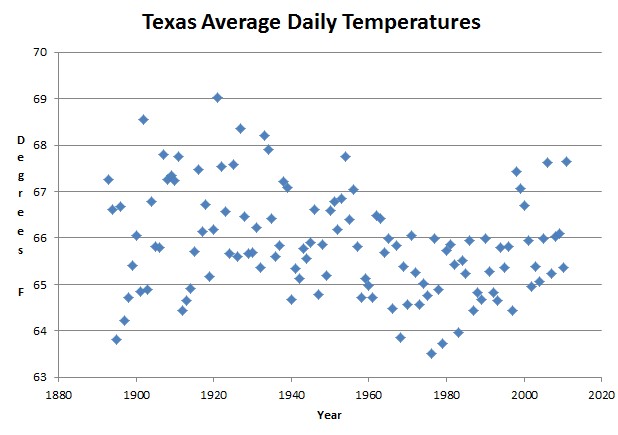
If the stations were area weighted, we would likely see an even stronger cooling trend in the US – which already looks more like Texas than New Jersey.
Hansen is more scientific about this. He heavily weights the high Arctic region (which is about the size of the US) where he has no thermometers.
Some Christian fundamentalists believe that the earth was created 5,000 years ago, but Katherine’s data indicates that Earth was actually created much later during the 1970s – which coincidentally happened to be the coldest decade of the last 80 years.
The one hundred hottest 36 month periods in Oklahoma – all occurred before 1960.
Hottest Average 36 month periods
Rank  End Month	Year    Temperature
1	8	1934	62.5495
2	5	1955	62.3987
3	4	1955	62.3413
4	12	1956	62.3343
5	12	1954	62.3261
6	7	1934	62.3184
7	3	1935	62.3139
8	10	1956	62.3001
9	11	1954	62.283
10	9	1934	62.277
11	11	1956	62.2526
12	10	1934	62.2319
13	1	1957	62.2246
14	10	1955	62.2152
15	11	1934	62.2091
16	9	1956	62.2061
17	12	1955	62.1987
18	11	1955	62.1886
19	7	1955	62.1862
20	1	1955	62.1821
21	4	1935	62.1704
22	1	1935	62.1661
23	6	1934	62.1622
24	8	1956	62.1573
25	6	1955	62.1531
26	9	1955	62.134
27	12	1935	62.1315
28	3	1955	62.1308
29	12	1934	62.1
30	8	1936	62.0928
The hottest temperature this month in McPherson was 108 degrees, nine degrees cooler than 1936. Experts tell us that 2012 heatwave is comparable to the 1930s – because they are completely incompetent.
 Kansas Temperatures - July 24, 1936
  MCPHERSON      	117
  MINNEAPOLIS    	117
  ELLSWORTH      	116
  HAYS 1 S       	116
  NORTON 9SSE    	116
  MANHATTAN      	115
  WAKEENEY       	115
  OBERLIN        	114
  LAWRENCE       	112
  ASHLAND        	111
  COLDWATER      	111
  EL DORADO      	111
  LARNED         	111
  OTTAWA         	111
  SAINT FRANCIS  	111
  LAKIN          	110
  MEDICINE LODGE 	110
This is what global warming looks like.
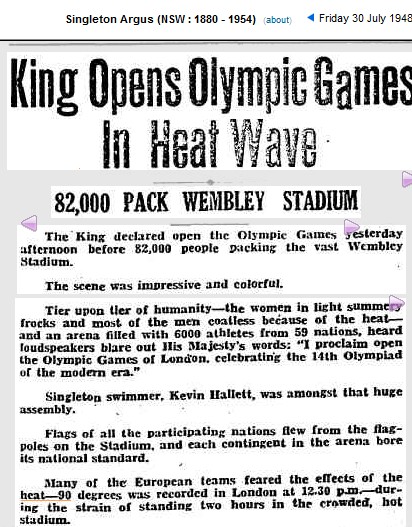
The last time London hosted the Olympics was in 1948. King George VI opened the games at the end of July in 35C weather.
After 74 years of unprecedented global warming, the forecast high in London for Sunday is 19C – a cool down of only 16 degrees coming on the heels of the worst first half of summer on record.