How The Hockey Stick Works

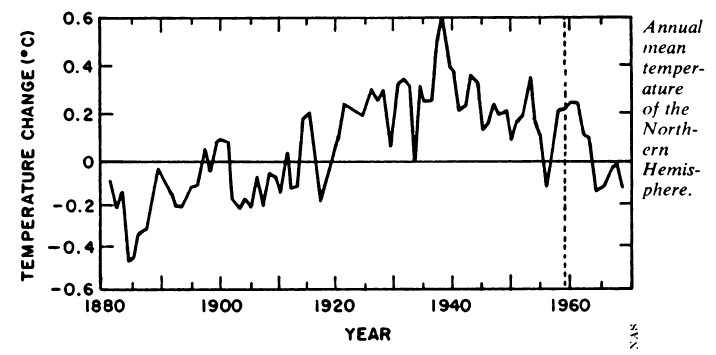
Like Briffa’s trees, the National Academy Of Sciences 1975 report showed that temperatures were plummeting since 1940.

www.sciencenews.org/view/download/id/37739/name/CHILLING_POSSIBILITIES

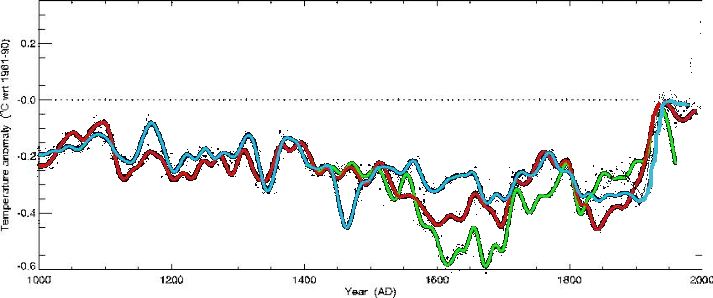
Briffa’s trees in green below.

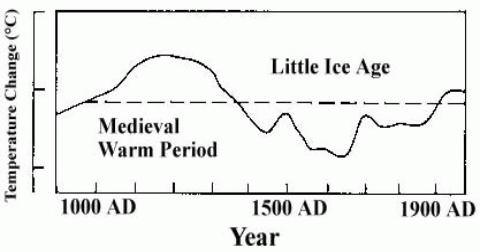
The 1990 IPCC report showed that temperatures were warmer during the MWP, and had been flat since 1940.

Even Hansen said in 1999 that there wasn’t much going on.

Empirical evidence does not lend much support to the notion that climate is headed precipitately toward more extreme heat and drought.

NASA GISS: Science Briefs: Whither U.S. Climate?

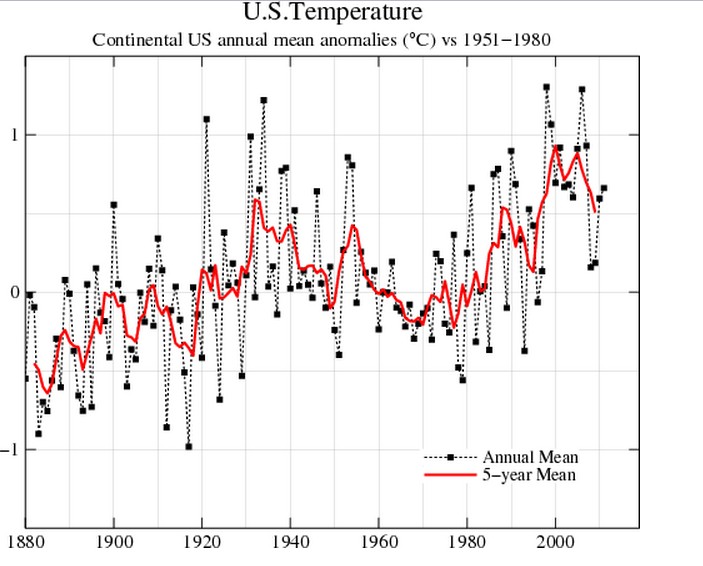
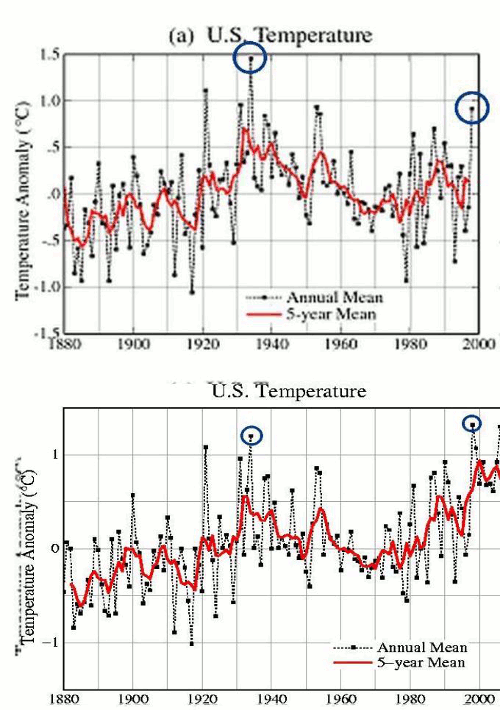
But the year 2000 breathed new life into the global warming charlatans. Hansen adjusted the temperatures upwards, and then Mann overwrote the tree ring data with Hansen’s phony temperatures.

After obliterating the temperature record and all sense of scientific integrity, they went on a speaking tour. And it was bad.

Posted in Uncategorized | 3 Comments

New Study : 97% Of People Want To Keep Their Jobs

A new study has shown conclusively that 97% of people who make their living studying global warming want to keep their jobs.

Posted in Uncategorized | Leave a comment

97% Of Scousers Believe That You Will Never Walk Alone

Where you stand depends on where you sit

[youtube=http://www.youtube.com/watch?v=Xfgqi-UahE8]

Posted in Uncategorized | 3 Comments

What A Bunch Of Crooks

NOAA adjusts temperatures upwards by 1.4F relative to 1940, and then has the audacity to announce every month that temperatures have been above normal for X months

Posted in Uncategorized | Leave a comment

Another Smoking GISS/USHCN Nuke

In my previous GISS/USHCN post I reconstructed what current GISS US should look like by calculating the USHCN yearly adjustments and subtracting them from the current GISS data. I came up with this.

Then I remembered that John Daly saved off a version of GISS US temperatures in 1999.

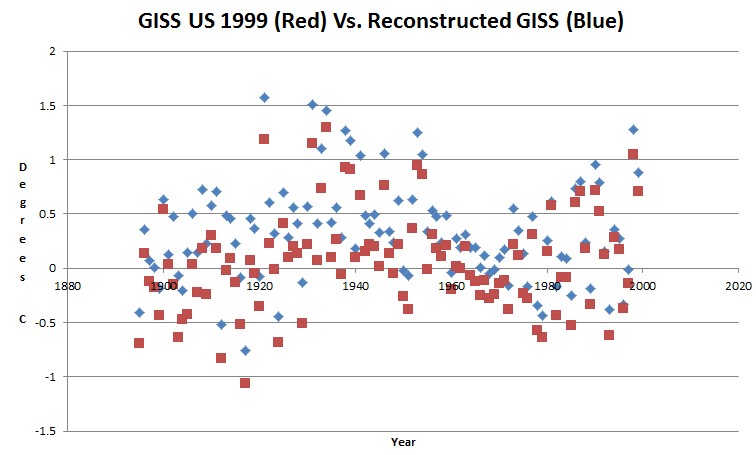
The graph below plots 1999 GISS  and my reconstructed GISS

Bingo, we have a pretty good match!. This proves that the post 2000 USHCN adjustments are much larger (more than 200%) than they are publishing. Game over. They show 0.5F, when the real adjustments are closer to 1.2F

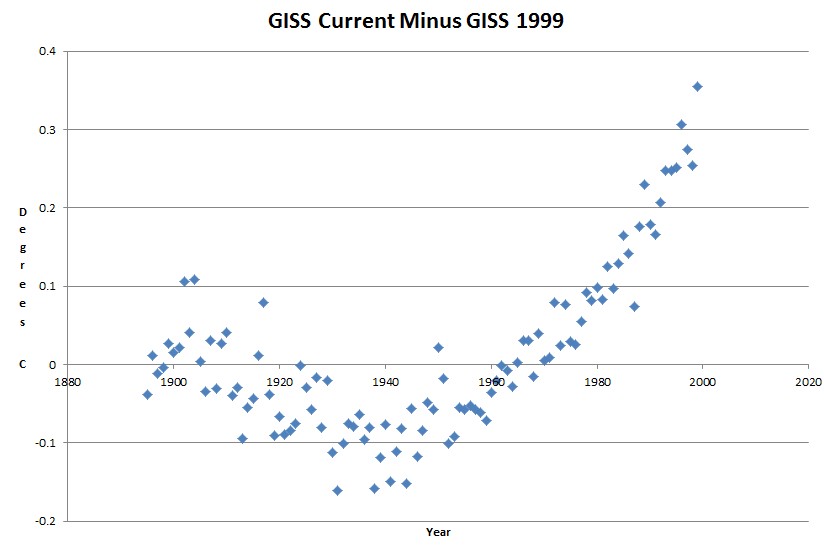
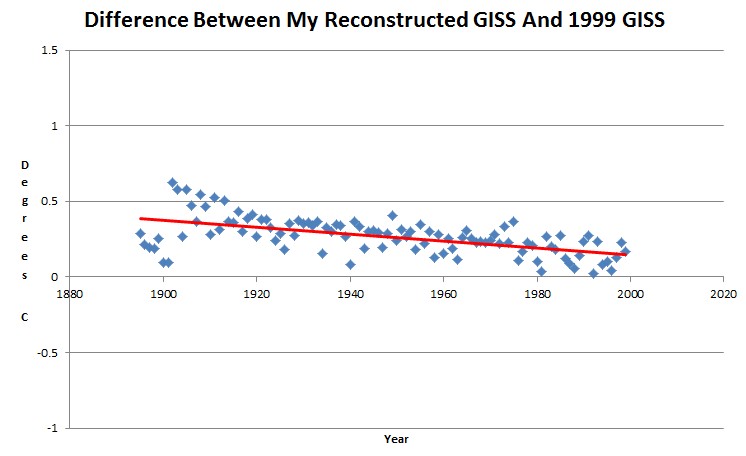
The graph below shows the difference between my GISS reconstruction and the 1999 published data. You can see that they were already cooling the past in 1999

But nothing like they are now!

Posted in Uncategorized | 11 Comments

USHCN Code Released

My USHCN code is available here as a zip file.

Once you unzip it you will see these files.

Main.cpp  Makefile  USHCN.cpp  USHCN.exe  USHCN.h

USHCN.exe is a Windows executable. Makefile is a Gnu makefile. If you aren’t a C++/STL programmer, you will probably have a difficult time understanding how it works.

In order to run it, you will need two files in the same directory as the executable.

http://cdiac.ornl.gov/ftp/ushcn_daily/ushcn-stations.txt

and any one of the the data files below. You will have to unzip the data file after you download it using gunzip.

Usage is : ushcn.exe USHCN_DATA_FILE_NAME [month=0-12] [max] [min]

Examples. Open up a command prompt window. Navigate to the directory with USHCN.exe, ushcn-stations.txt, and state41_TX.txt

ushcn.exe state41_TX.txt  > Texas.csv   – dumps out csv information for Texas to file Texas.csv

ushcn.exe state08_FL.txt  month=5 max > Florida_May_Max.csv   – dumps out csv information for Florida May maximum temperatures

ushcn.exe us.txt > US.csv – dumps out all US information

The code makes no attempt to do any adjustments or corrections. All it does is find all valid temperature recordings for all stations on all days, calculates averages – and finds min/max records per day of year for each station. There is no time bias. Earlier years are neither favored nor disadvantaged.

The reason I don’t do any corrections is because I am assuming a Monte Carlo distribution of error, which is the normal way that real scientists handle large data sets. There is no valid reason to believe that a huge data set created by thousands of observers over 130 years would have any systematic time-dependent bias to it – other than UHI. People read thermometers the same way in 1980 as they did in 1934.

If you mess the code up, take responsibility for it and don’t try to blame your mistakes on me.

Continue reading →

Posted in Uncategorized | 11 Comments

GISS Would Show No US Temperature Trend Without The USHCN Adjustments

USHCN daily data : us.txt.gz

GISS US:  data data.giss.nasa.gov/gistemp/graphs_v3/Fig.D.txt

Current NCDC data : CONTIGUOUS UNITED STATES Climate Summary

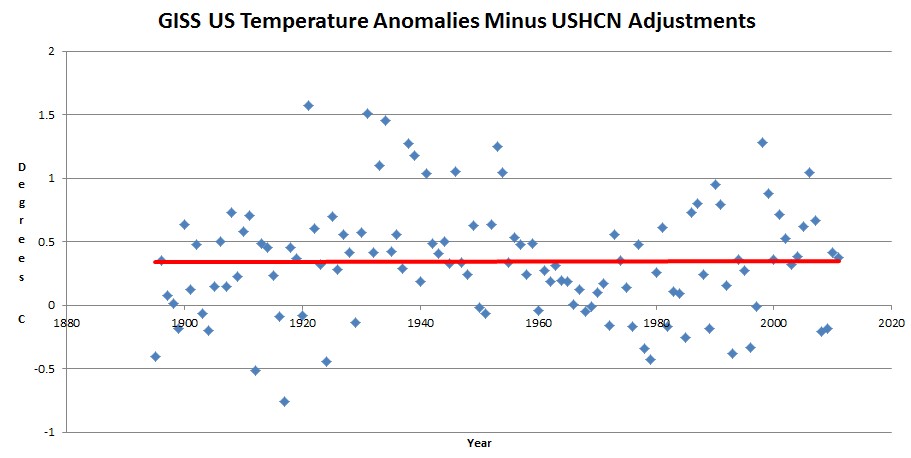
The graph above plots published GISS US temperature anomalies, minus the difference between published USHCN temperatures and their raw data (scaled for centigrade of course.)

GISS is based on USHCN, and without their adjustments there is no warming trend since at least 1895.

Posted in Uncategorized | 6 Comments

USHCN Busted : Their Adjustments Are Much Larger Than They Advertise

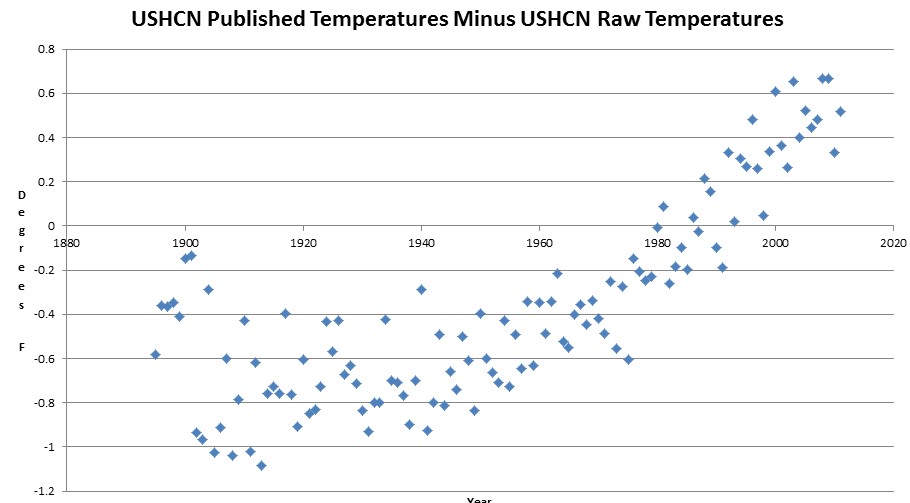
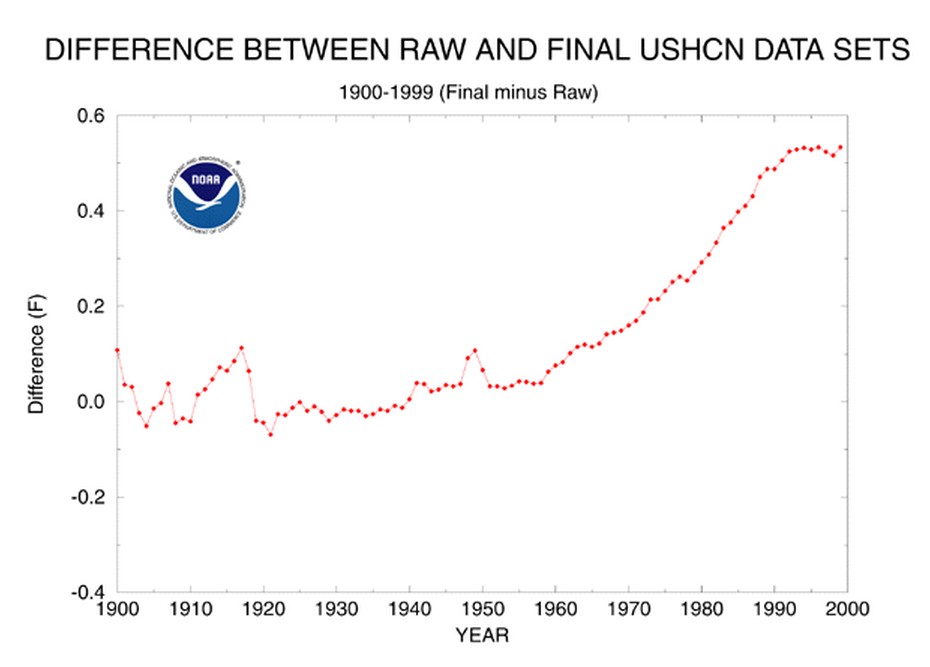
USHCN advertises that they cheat by 0.6F, but it is much worse than it seems.

ts.ushcn_anom25_diffs_urb-raw_pg.gif (650×502)

This is heinous enough, but I started thinking about it and realized that it doesn’t make any sense. We have seen hundreds of examples of them cooling the past, and their graph above doesn’t show that. So I calculated the actual adjustment by averaging all valid daily minimum and maximum temperatures at all USHCN stations (per year) and compared them to what they publish.

Their adjustment is much larger than what they admit, and it accounts for the entire claimed GISS US warming trend.

Fig.D.gif (513×438)

There has been no US warming. It was all manufactured by climate activists James Hansen and Tom Karl over the last decade.

Phil Jones and NOAA 1989

February 04, 1989

Last week, scientists from the United States Commerce Department’s National Oceanic and Atmospheric Administration said that a study of temperature readings for the contiguous 48 states over the last century showed there had been no significant change in average temperature over that period. Dr. (Phil) Jones said in a telephone interview today that his own results for the 48 states agreed with those findings.

Global Warmth In ’88 Is Found To Set a Record – New York Times

James Hansen  1999

Empirical evidence does not lend much support to the notion that climate is headed precipitately toward more extreme heat and drought. The drought of 1999 covered a smaller area than the 1988 drought, when the Mississippi almost dried up. And 1988 was a temporary inconvenience as compared with repeated droughts during the 1930s “Dust Bowl” that caused an exodus from the prairies, as chronicled in Steinbeck’s Grapes of Wrath…..

in the U.S. there has been little temperature change in the past 50 years, the time of rapidly increasing greenhouse gases — in fact, there was a slight cooling throughout much of the country

NASA GISS: Science Briefs: Whither U.S. Climate?

Posted in Uncategorized | 13 Comments

Why We Should Never Question The Consensus Of Experts

I get messages posted here all the time by people calling me ignorant – for questioning a list of authorities who are happy to receive large quantities of global warming research money. What kind of evil person would question authority? After all, 97% of National Socialist German Workers Party Experts agreed that Jews were destroying Germany during the 1930s.

Posted in Uncategorized | 31 Comments

US Drought Monitor : Living In The Past

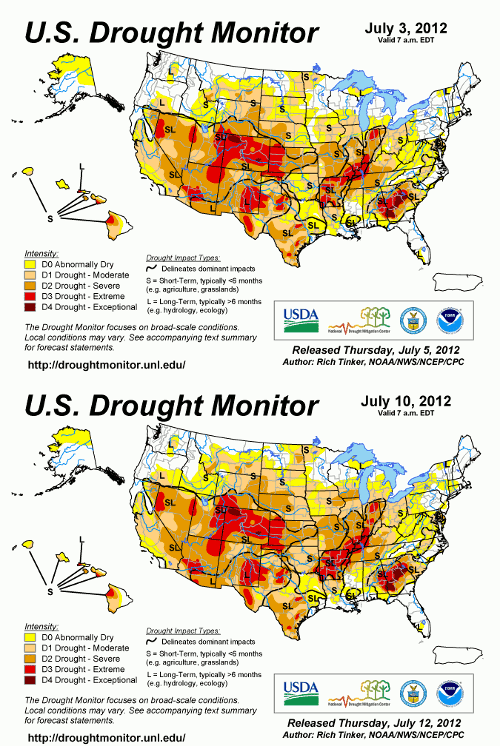
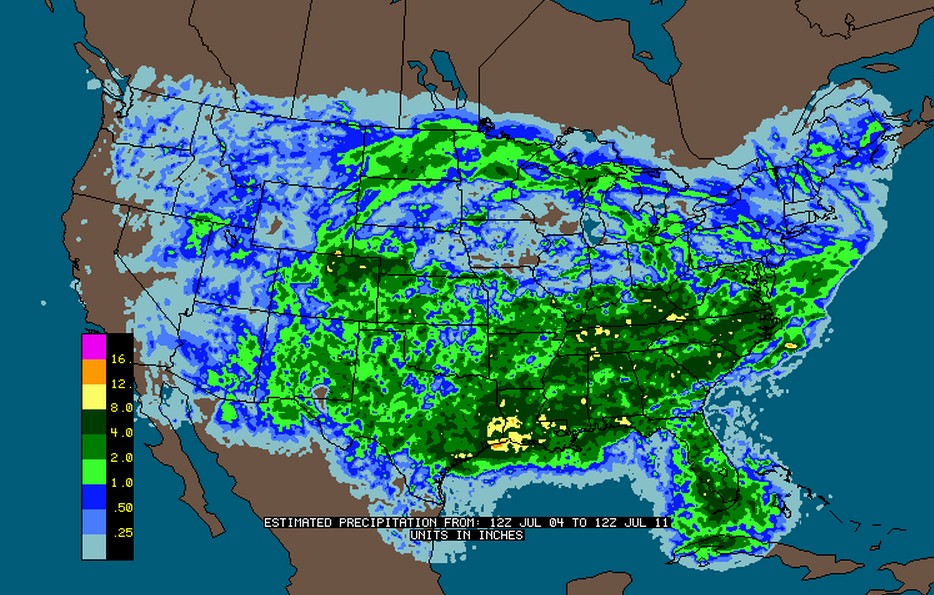
No change in Colorado/New Mexico/Georgia drought conditions over the past week, despite huge amounts of rain. This site was featured prominently by Al Gore this week.

US Drought Monitor

Intellicast – Weekly Precipitation in United States

Posted in Uncategorized | 17 Comments