The 1930s Was Hotter In Laurel, Maryland

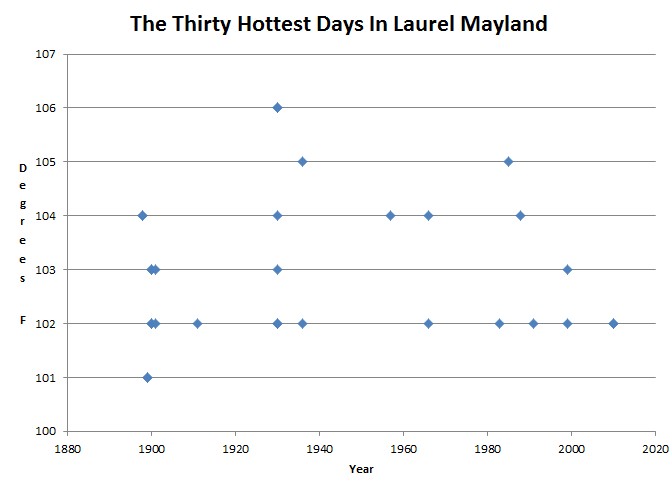
Laurel is in between Baltimore and Washington, close to where I spent the winter in Columbia. During the 1930s, they averaged 7.8 days per year over 95 degrees. By contrast, since the year 2000 they have only averaged 5.7 days per year over 95 degrees.

U.S. Historical Climatology Network

All but three of their thirty hottest days occurred below 350 ppm CO2.

Jason Samenow at the Washington Post came up with all kinds of meaningless statistics to prove global warming in DC, but he hid the only ones which really matter.

Posted in Uncategorized | 2 Comments

Colorado Burning Update

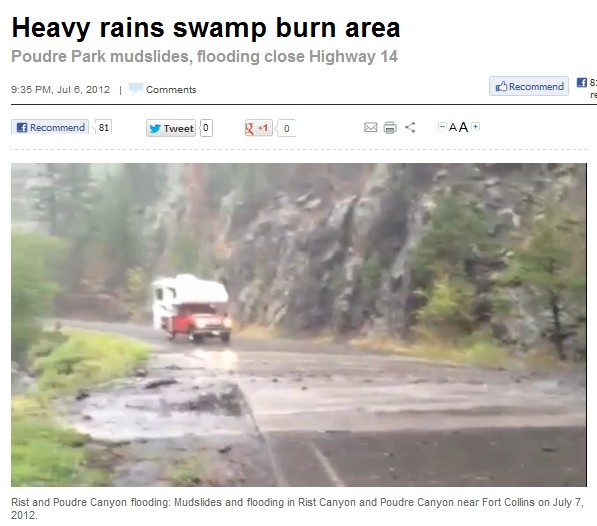
This is what the press corps(e) is hysterical about.

Heavy rains swamp burn area | The Coloradoan | coloradoan.com

Posted in Uncategorized | 6 Comments

PR Event Ends In A Bust For Bill McKibben

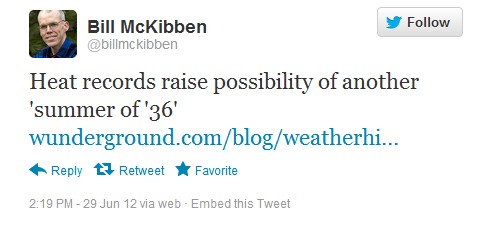
A few days ago, Bill McKibben was trying to resurrect the Dust Bowl

Twitter / billmckibben: Heat records raise possibi

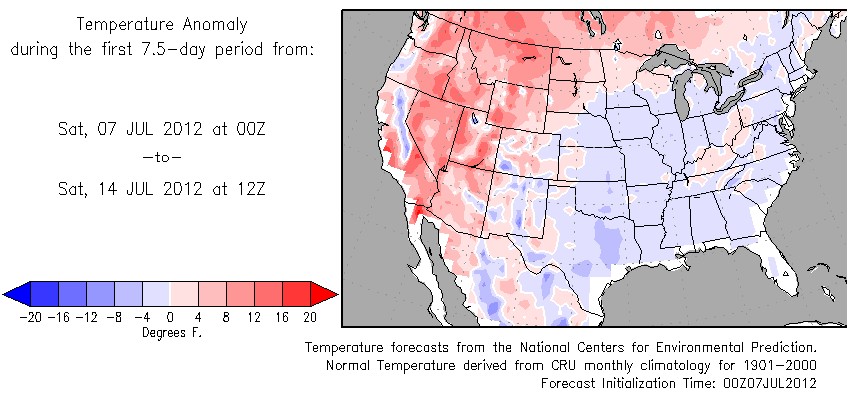
Then the eastern half of the US turned cool and wet.

10-Day Temperature Outlook for the Conterminous U.S.

Posted in Uncategorized | 2 Comments

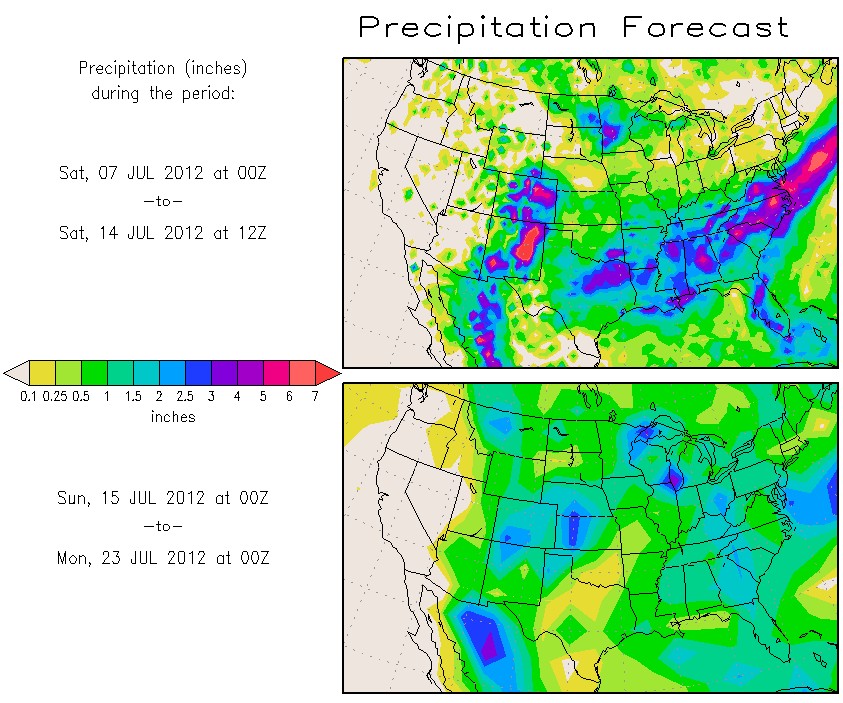
Heavy Rain Forecast For Southwest And The Corn Belt

Another sad day for alarmists, who are always hoping for misery and death.

10-Day Precipitation Outlook for the Conterminous U.S.

Posted in Uncategorized | 2 Comments

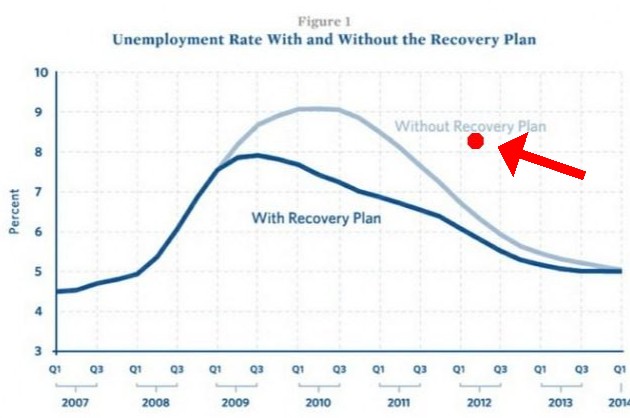
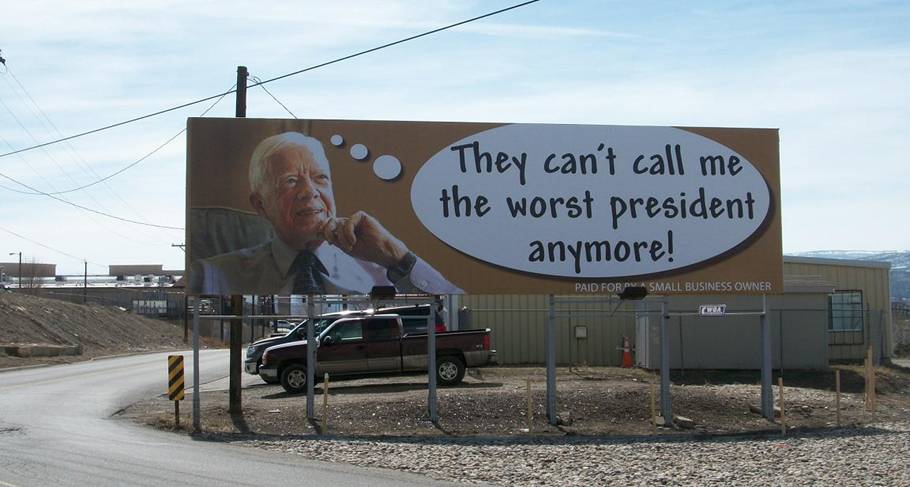
Obama’s Scenario F

It is all Bush’s fault. It has nothing to do with Obama being incompetent.


Posted in Uncategorized | 5 Comments

A Proof That Greenhouse Gas Driven Global Warming Theory Is Incorrect

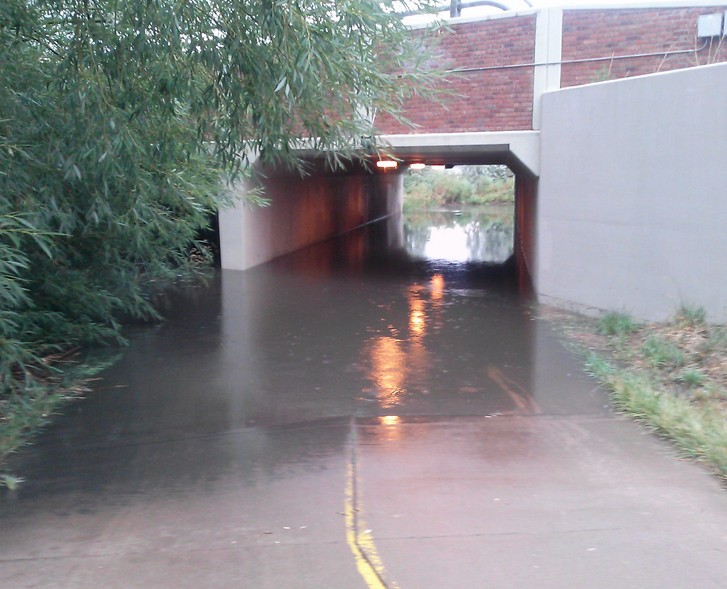
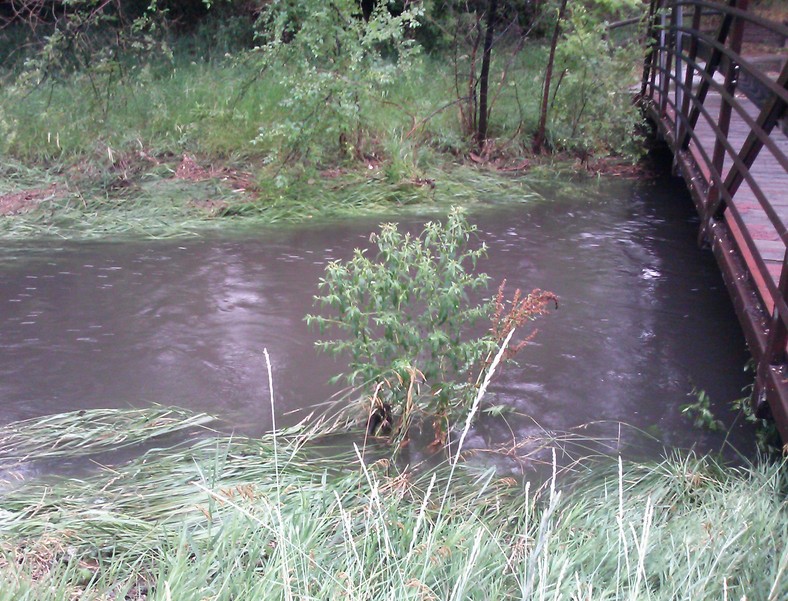
I was riding my bike over to Whole Foods down a flooded bike trail earlier, when I had a Eureka moment. (Something about water seems to stimulate those.) I realized that is possible to empirically disprove global warming theory.

Venus has a fixed lapse rate of about 8ºK/km through its troposphere, which is similar to Earth – despite very different atmospheric chemistry. This in itself is strong evidence that temperature is not closely tied to atmospheric composition, but is not the basis of this proof.
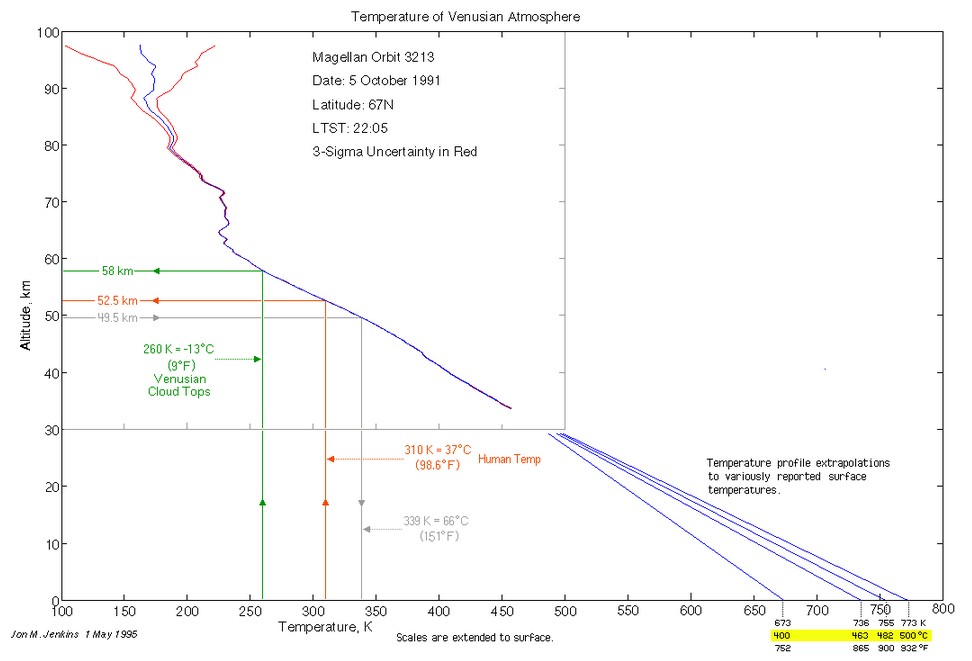
Venus Atmosphere Temperature and Pressure Profiles

The atmosphere of Venus is about 95% CO2, and at 1 bar pressure (50km elevation) the greenhouse effect is weak – because there is little water vapor. Note that the absorption bands of CO2 are very narrow compared to H2O, which means that Venus has a weak greenhouse effect at one bar pressure.
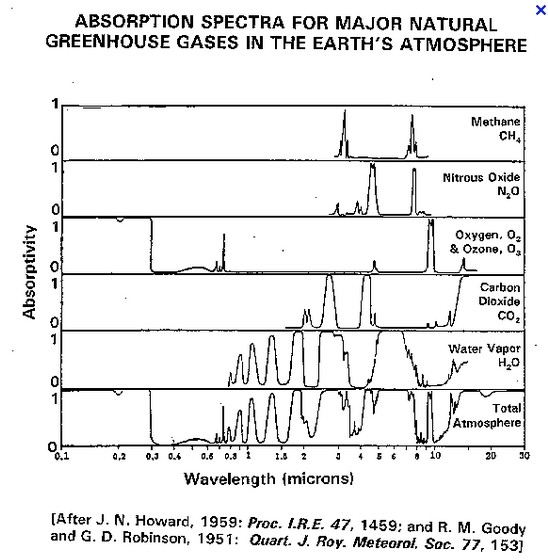
Radiative Physics – Yes CO2 Does Create Warming « the Air Vent

However, the pressure at the surface of Venus is almost 100 bars, and that does something to the CO2. The absorption bands broaden and occupy much more of the LW spectrum. What this means is that the greenhouse effect on Venus is much stronger near the surface than it is at 50km.

If the greenhouse effect controlled the temperature profile of the Venusian atmosphere, we would necessarily have to see a greater lapse rate closer to the surface – where the greenhouse effect is stronger. This is because the increased resistance to radiative heat transfer closer to the surface, would create a larger temperature gradient. But we don’t see that – the lapse rate is fixed throughout Venus’ troposphere . This means that the temperature profile of Venus troposphere is not controlled by the greenhouse effect. There is no way to get around this argument.

Conclusion : Even a huge increase in the greenhouse effect as we approach the surface of Venus, has no impact on the lapse rate. Observations on Venus demonstrate that increasing the greenhouse effect even by a large amount, has little impact on the temperature profile of a convective atmosphere.  i.e. greenhouse gas driven global warming theory simply does not work in a convective atmosphere.

David Appell told me that I would get a Nobel Prize if I could disprove global warming. I expect him to nominate me.

BTW – here are some pixs I took on my flooded bike ride in Fort Collins this evening. The air here smells like drowned campfire.
Posted in Uncategorized | 54 Comments

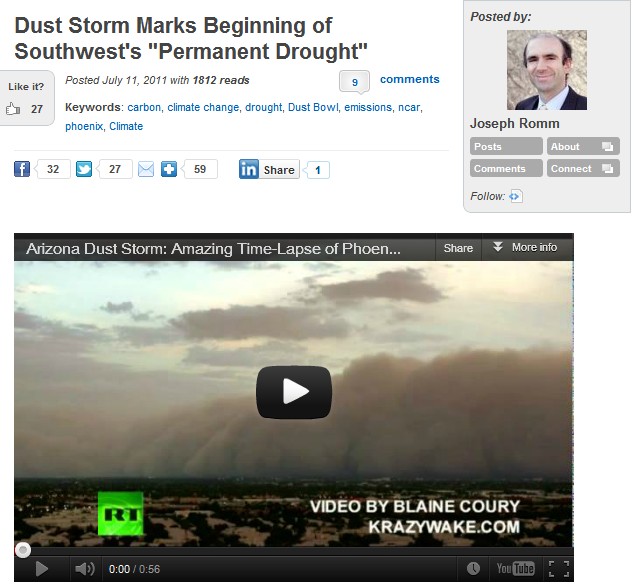
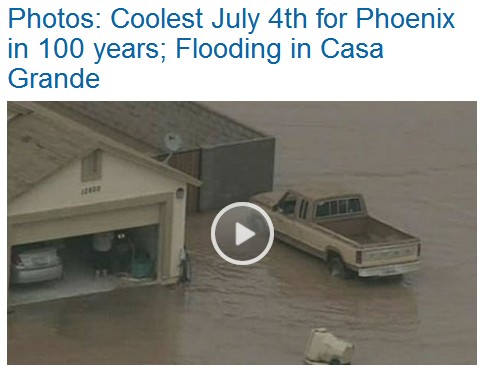
Shocking Photo Of Joe Romm’s Permanent Drought

One year ago this week, Joe Romm declared that the southwest permanent drought had begun.

Dust Storm Marks Beginning of Southwest’s “Permanent Drought” | The Energy Collective

This important story from Joe Romm deserves an update – avert your eyes if you are squeamish or easily upset.

Photos: Coolest July 4th for Phoenix in 100 years; Flooding in Casa Grande 

As usual, Romm had no idea what he was talking about.

h/t to Kirk Meyers

Posted in Uncategorized | 3 Comments

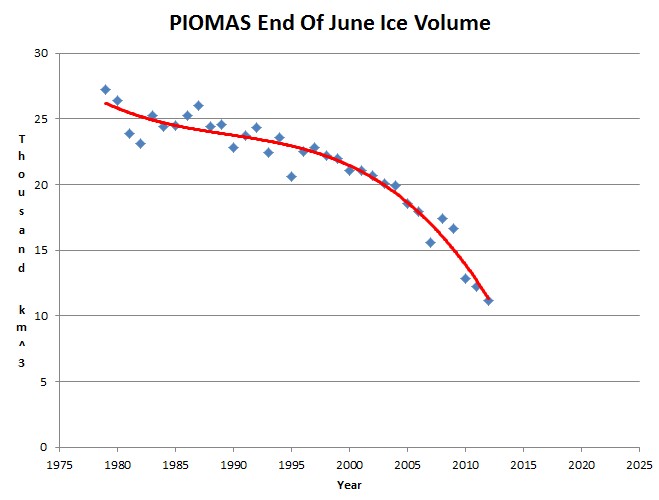
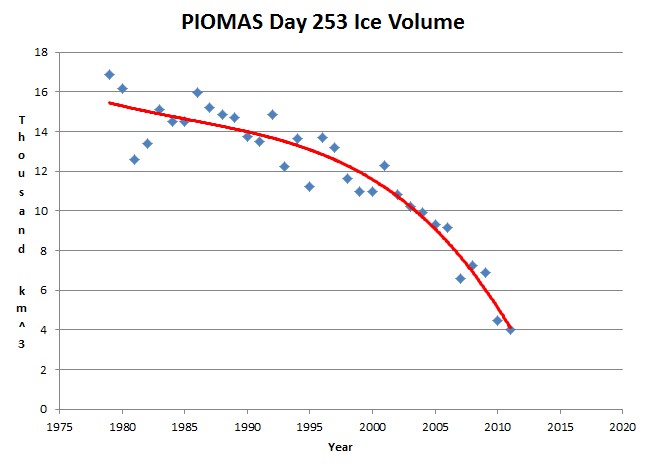
PIOMAS : Ice Free June In Eight Years

PIOMAS continues to paint themselves into a corner with their remarkable ice volume claims.

Ice free September in three years

Posted in Uncategorized | 1 Comment

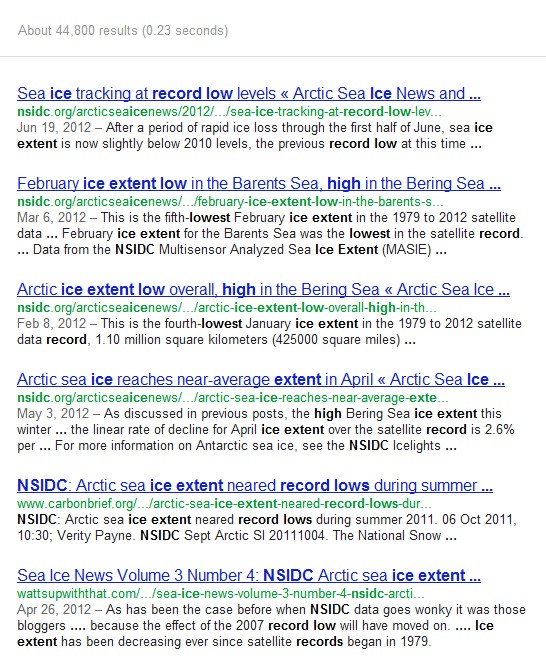
44,000 Record Low Ice Extents

A Google search for “nsidc record low ice extent” turns up 44,800 results. It is like that scene from The Holy Grail, where the horseman is galloping towards you – but never gets any closer.

Nearly every month NSIDC tells us that ice is at a “record low” – yet Arctic ice extent and age continues to increase since the 2007-20o8 minimum. That is what happens when people use confirmation bias ladders to do their cherry picking.

Posted in Uncategorized | 3 Comments

What Happened To Texas? What Happened To Tornadoes?

One year ago Andrew Dessler from Texas A&M University wrote an editorial in the Houston Chronicle declaring Texas to be in a permanent drought. No one is talking about Texas any more because they have had above normal rainfall this year.

Similarly, back in February, our friends got hysterical about some early tornadoes. The rest of the tornado season turned out slow and they quit talking about it. Same story for Moscow, Europe 2003, snow is a thing of the past, global cooling ……

The Colorado icon only lasted a couple of weeks, though the MSM is still trying to get mileage out of it. It is a pathetic three-ring circus.

Posted in Uncategorized | 14 Comments